| Param | Original file | Final file |
|---|---|---|
| Filename | modeM0/AS1A05_163T01_9000003010_20356cztM0_level2.evt | modeM0/AS1A05_163T01_9000003010_20356cztM0_level2_quad_clean.evt |
| Size (bytes) | 594,953,280 | 90,014,400 |
| Size | 567.4 MB | 85.8 MB |
| Events in quadrant A | 4,031,238 | 546,880 |
| Events in quadrant B | 4,140,776 | 551,076 |
| Events in quadrant C | 4,048,214 | 536,384 |
| Events in quadrant D | 5,233,553 | 513,690 |
| Mode SS | |||
|---|---|---|---|
| Quadrant | BADHDUFLAG | Total packets | Discarded packets |
| A | 0 | 170 | 0 |
| B | 0 | 170 | 0 |
| C | 0 | 170 | 0 |
| D | 0 | 170 | 0 |
| Mode M0 | |||
|---|---|---|---|
| Quadrant | BADHDUFLAG | Total packets | Discarded packets |
| A | 0 | 17379 | 2 |
| B | 0 | 17571 | 3 |
| C | 0 | 17336 | 2 |
| D | 0 | 21227 | 2 |
| Mode M9 | |||
|---|---|---|---|
| Quadrant | BADHDUFLAG | Total packets | Discarded packets |
| A | 0 | 5 | 0 |
| B | 0 | 5 | 0 |
| C | 0 | 5 | 0 |
| D | 0 | 5 | 0 |
| Quadrant | Total seconds | Saturated seconds | Saturation percentage |
|---|---|---|---|
| A | 8312 | 291 | 3.500962% |
| B | 8312 | 324 | 3.897979% |
| C | 8312 | 288 | 3.464870% |
| D | 8312 | 587 | 7.062079% |
Noise dominated data is calculated using 1-second bins in cleaned event files. If a bin has >2000 counts, and if more than 50% of those come from <1% of pixels, then it is considered to be noise-dominated and hence unusable.
| Quadrant | # 1 sec bins | Bins with >0 counts | Bins with >2000 counts | High rate bins dominated by noise | Noise dominated (total time) | Noise dominated (detector-on time) | Marked lightcurve |
|---|---|---|---|---|---|---|---|
| A | 8817 | 8314 | 0 | 0 | 0.00% | 0.00% | 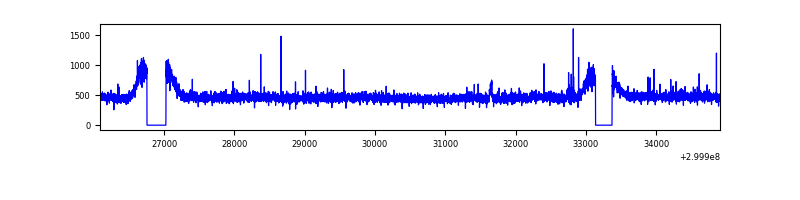 |
| B | 8817 | 8313 | 17 | 17 | 0.19% | 0.20% | 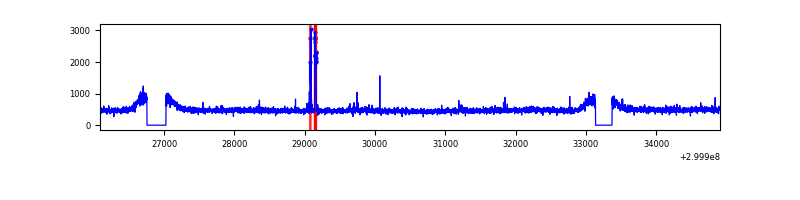 |
| C | 8817 | 8314 | 3 | 3 | 0.03% | 0.04% | 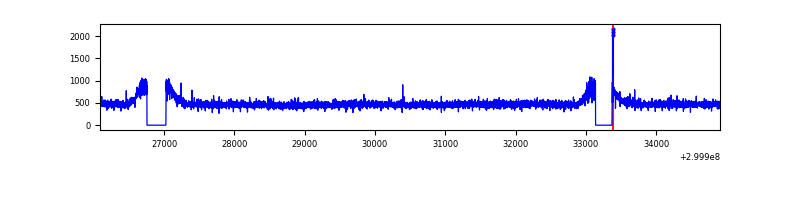 |
| D | 8817 | 8314 | 337 | 337 | 3.82% | 4.05% | 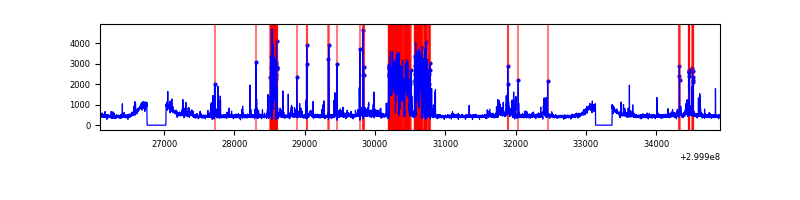 |
Top three noisy pixels from each quadrant. If the there are fewer than three noisy pixels in the level2.evt file, extra rows are filled as -1
| Pixel properties | Quadrant properties | ||||||
|---|---|---|---|---|---|---|---|
| Quadrant | DetID | PixID | Counts | Sigma | Mean | Median | Sigma |
| A | 6 | 16 | 13068 | 56.66 | 1040 | 1013 | 212.7 |
| A | 10 | 17 | 12526 | 54.12 | 1040 | 1013 | 212.7 |
| A | 13 | 254 | 9686 | 40.77 | 1040 | 1013 | 212.7 |
| B | 3 | 64 | 66733 | 322.02 | 1028 | 997 | 204.1 |
| B | 12 | 111 | 25924 | 122.11 | 1028 | 997 | 204.1 |
| B | 11 | 111 | 23254 | 109.03 | 1028 | 997 | 204.1 |
| C | 14 | 238 | 153312 | 651.19 | 994 | 1000 | 233.9 |
| C | 7 | 220 | 17506 | 70.57 | 994 | 1000 | 233.9 |
| C | 13 | 61 | 6894 | 25.2 | 994 | 1000 | 233.9 |
| D | 1 | 52 | 1071938 | 4396.62 | 1000 | 969 | 243.6 |
| D | 7 | 238 | 382628 | 1566.81 | 1000 | 969 | 243.6 |
| D | 2 | 234 | 32651 | 130.06 | 1000 | 969 | 243.6 |
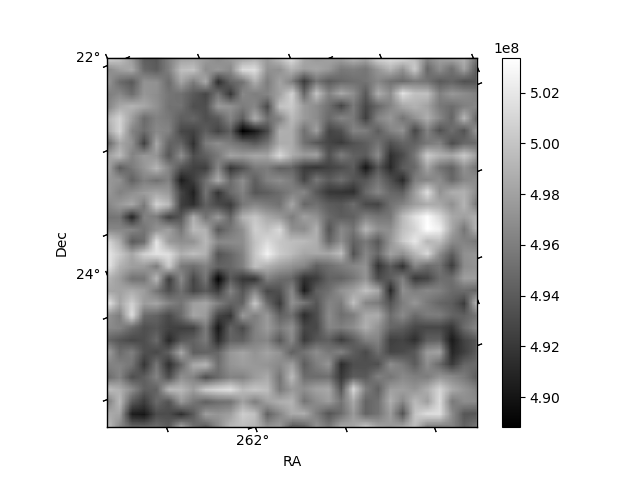
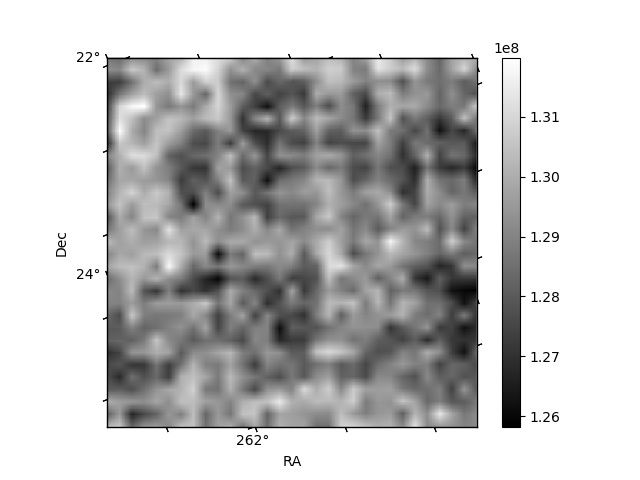
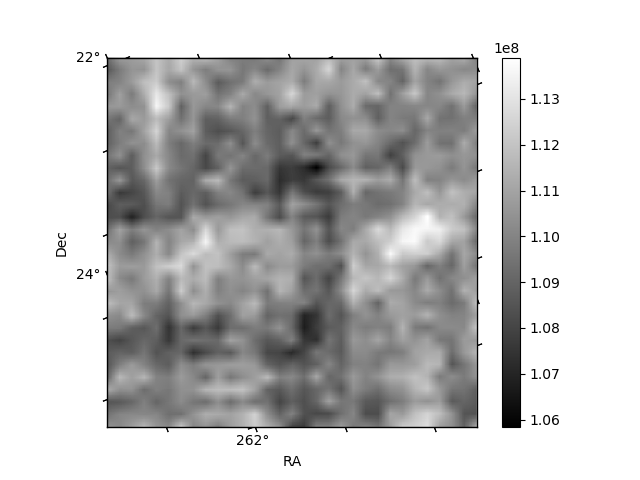
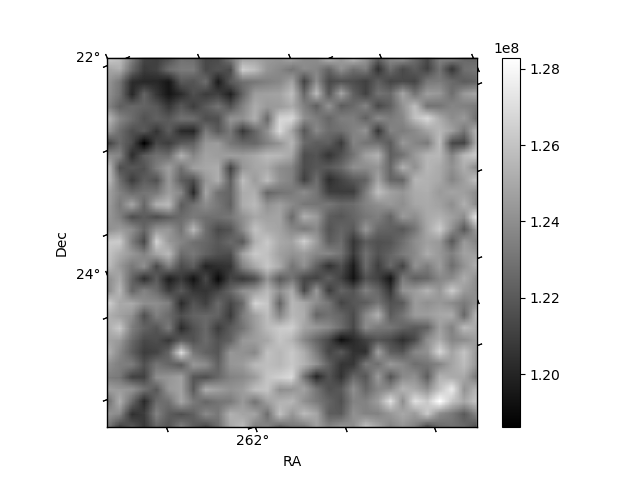
Histogram calculated using DETX and DETY for each event in the final _common_clean file
| Quadrant A | 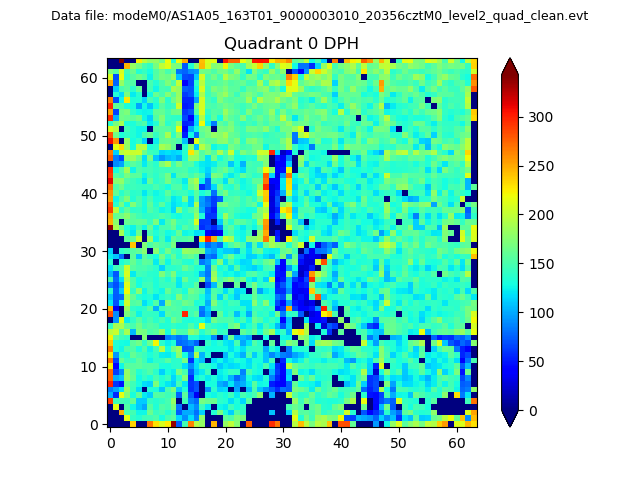 |
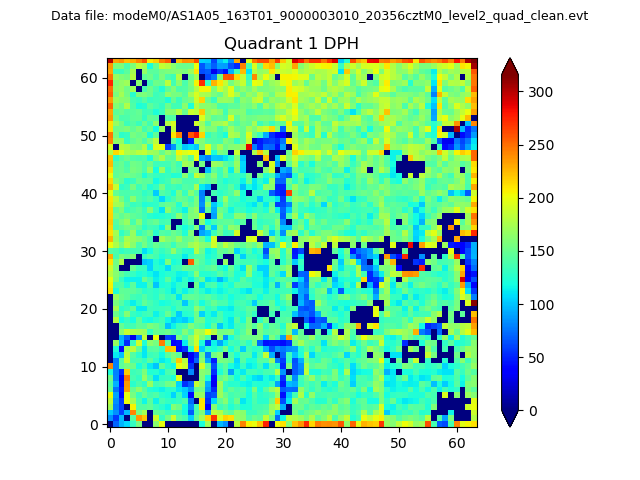 |
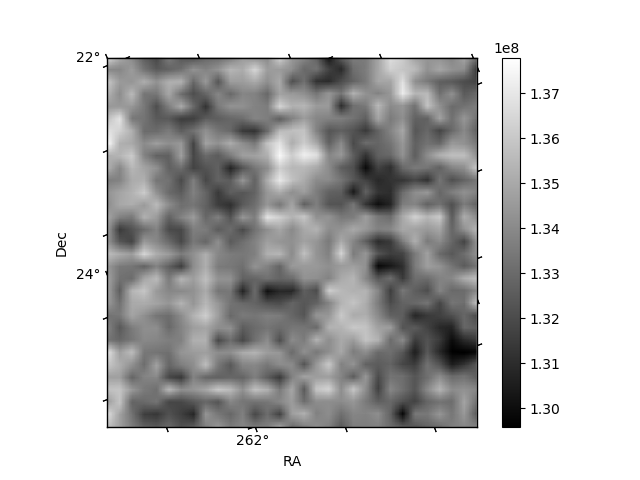
Quadrant B |
|---|---|---|---|
| Quadrant D | 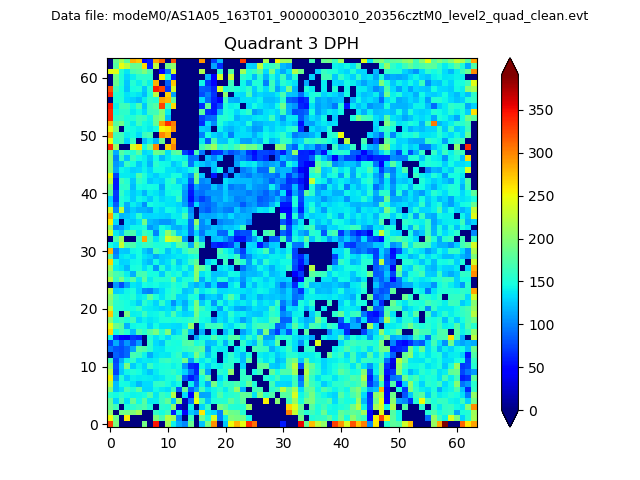 |
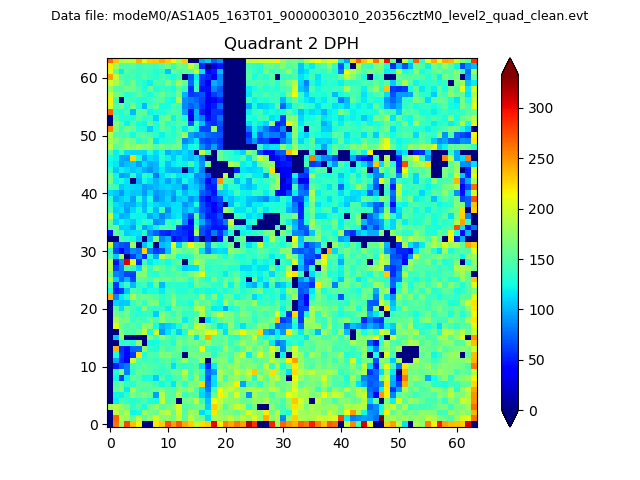 |
Quadrant C |
| Plot type | Count rate plots | Images |
|---|---|---|
| Comparison with Poisson distribution Blue bars denote a histogram of data divided into 1 sec bins. Red curve is a Poisson curve with rate = median count rate of data. |
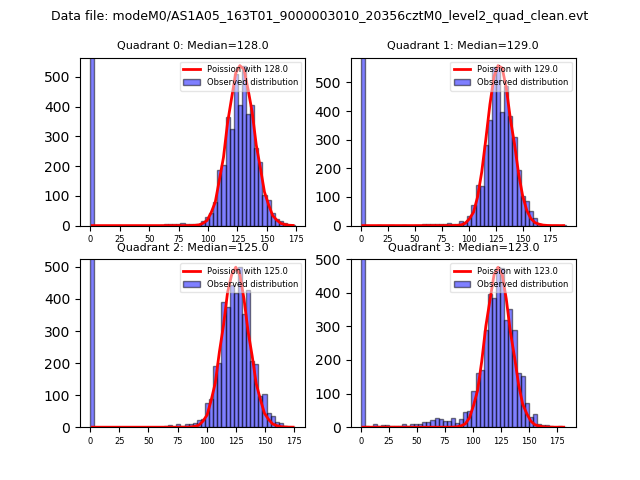 |
 |
| Quadrant-wise count rates Data is divided into 100 sec bins |
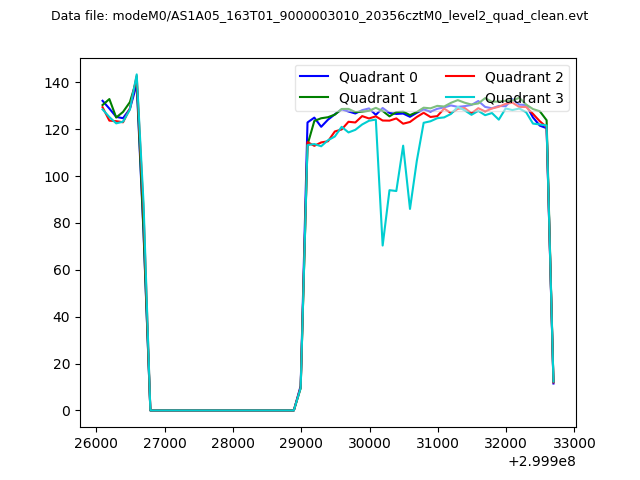 |
|
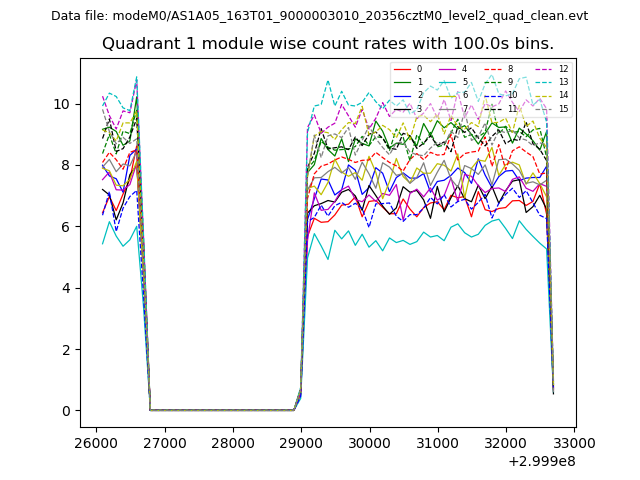
| Module-wise count rates for Quadrant A Data is divided into 100 sec bins |
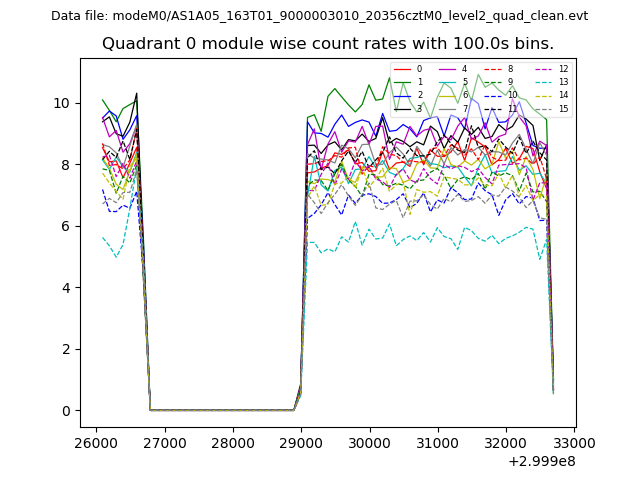 |
 |
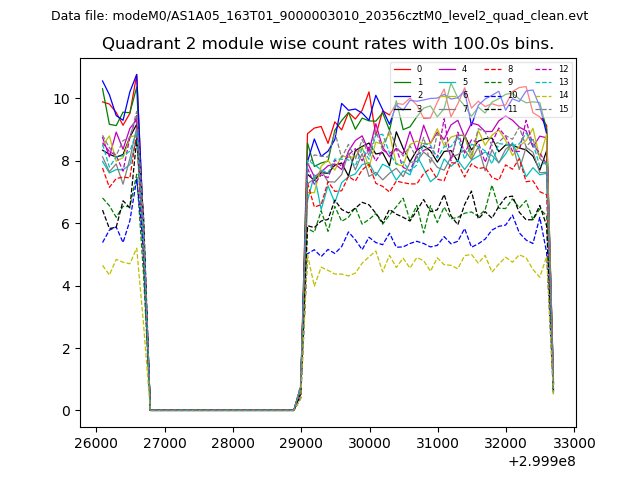
| Module-wise count rates for Quadrant B Data is divided into 100 sec bins |
 |
 |
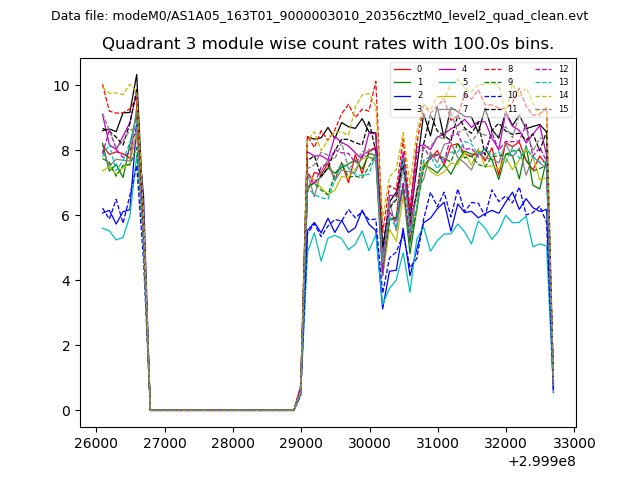
| Module-wise count rates for Quadrant C Data is divided into 100 sec bins |
 |
 |
| Module-wise count rates for Quadrant D Data is divided into 100 sec bins |
 |
 |
| Parameter | Plot |
|---|---|
| CZT HV Monitor | 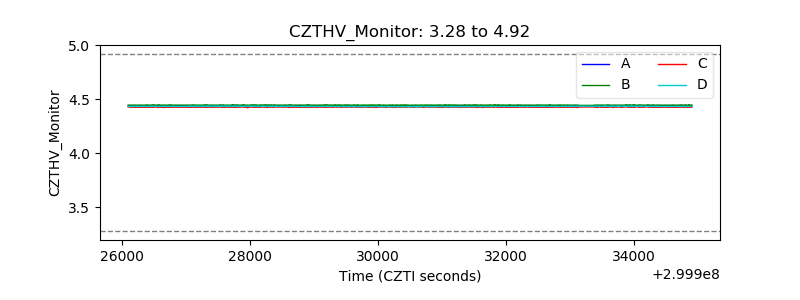 |
| D_VDD | 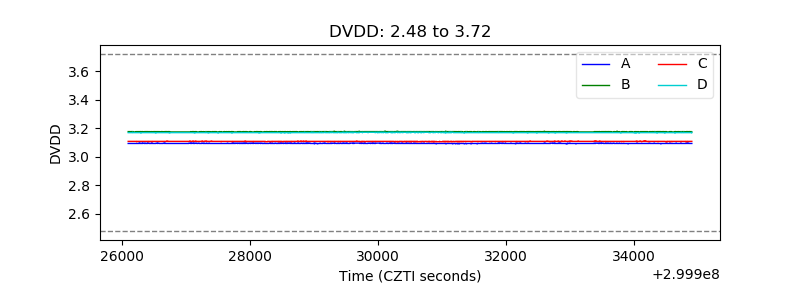 |
| Temperature 1 | 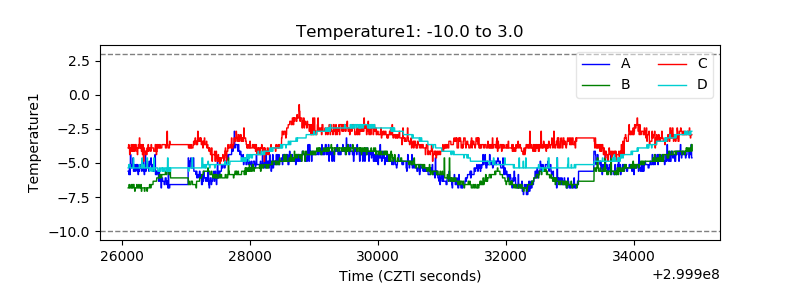 |
| Veto HV Monitor |  |
| Veto LLD | 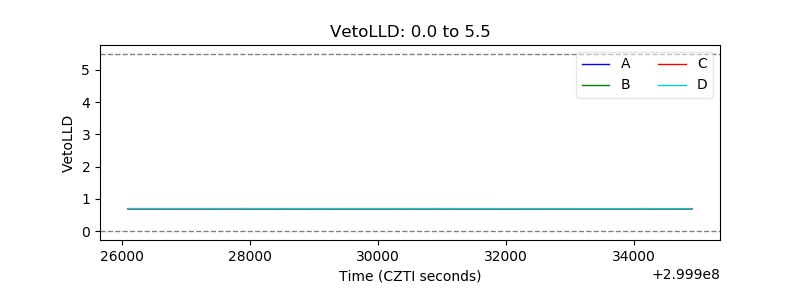 |
| Alpha Counter | 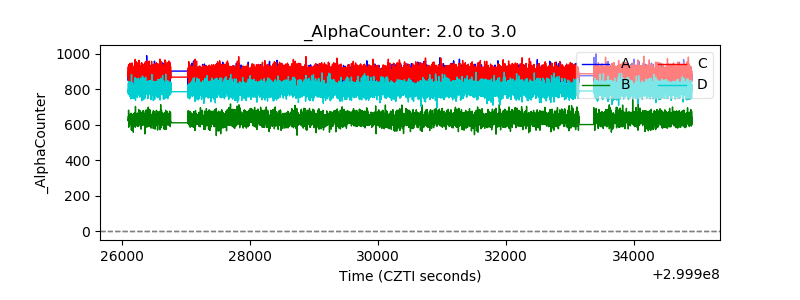 |
| _CPM_Rate | 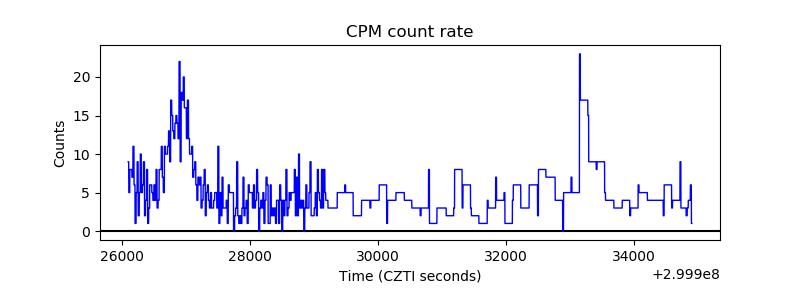 |
| CZT Counter |  |
| +2.5 Volts monitor |  |
| +5 Volts monitor |  |
| _ROLL_ROT |  |
| _Roll_DEC |  |
| _Roll_RA | 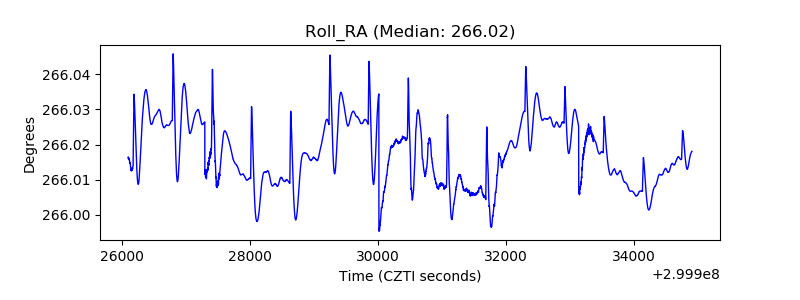 |
| Veto Counter |  |