| Param | Original file | Final file |
|---|---|---|
| Filename | modeM0/AS1A05_163T01_9000003010_20359cztM0_level2.evt | modeM0/AS1A05_163T01_9000003010_20359cztM0_level2_quad_clean.evt |
| Size (bytes) | 899,717,760 | 170,735,040 |
| Size | 858.0 MB | 162.8 MB |
| Events in quadrant A | 6,266,823 | 1,077,708 |
| Events in quadrant B | 6,398,676 | 1,086,473 |
| Events in quadrant C | 6,343,675 | 1,046,559 |
| Events in quadrant D | 7,337,690 | 1,041,132 |
| Mode SS | |||
|---|---|---|---|
| Quadrant | BADHDUFLAG | Total packets | Discarded packets |
| A | 0 | 270 | 0 |
| B | 0 | 270 | 0 |
| C | 0 | 270 | 0 |
| D | 0 | 270 | 0 |
| Mode M0 | |||
|---|---|---|---|
| Quadrant | BADHDUFLAG | Total packets | Discarded packets |
| A | 0 | 27318 | 3 |
| B | 0 | 27487 | 3 |
| C | 0 | 27283 | 3 |
| D | 0 | 31040 | 3 |
| Mode M9 | |||
|---|---|---|---|
| Quadrant | BADHDUFLAG | Total packets | Discarded packets |
| A | 0 | 18 | 0 |
| B | 0 | 18 | 0 |
| C | 0 | 18 | 0 |
| D | 0 | 18 | 0 |
| Quadrant | Total seconds | Saturated seconds | Saturation percentage |
|---|---|---|---|
| A | 13312 | 204 | 1.532452% |
| B | 13313 | 239 | 1.795238% |
| C | 13313 | 293 | 2.200856% |
| D | 13313 | 366 | 2.749193% |
Noise dominated data is calculated using 1-second bins in cleaned event files. If a bin has >2000 counts, and if more than 50% of those come from <1% of pixels, then it is considered to be noise-dominated and hence unusable.
| Quadrant | # 1 sec bins | Bins with >0 counts | Bins with >2000 counts | High rate bins dominated by noise | Noise dominated (total time) | Noise dominated (detector-on time) | Marked lightcurve |
|---|---|---|---|---|---|---|---|
| A | 15032 | 13312 | 0 | 0 | 0.00% | 0.00% | 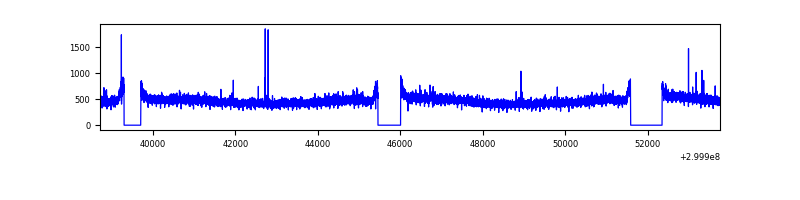 |
| B | 15033 | 13314 | 1 | 1 | 0.01% | 0.01% | 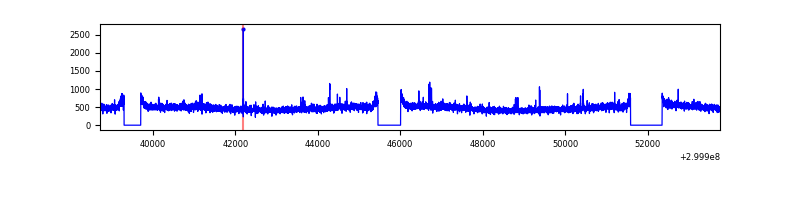 |
| C | 15033 | 13314 | 0 | 0 | 0.00% | 0.00% | 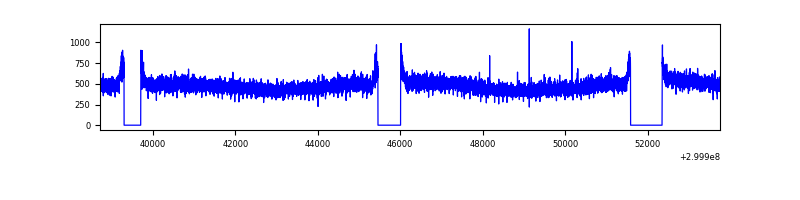 |
| D | 15033 | 13314 | 105 | 105 | 0.70% | 0.79% | 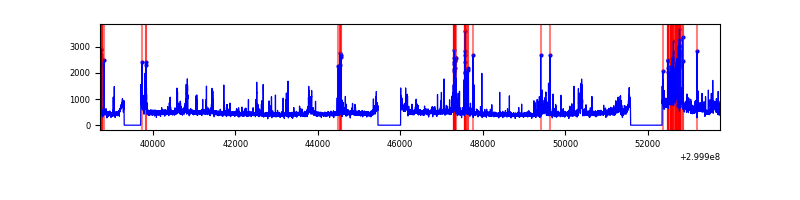 |
Top three noisy pixels from each quadrant. If the there are fewer than three noisy pixels in the level2.evt file, extra rows are filled as -1
| Pixel properties | Quadrant properties | ||||||
|---|---|---|---|---|---|---|---|
| Quadrant | DetID | PixID | Counts | Sigma | Mean | Median | Sigma |
| A | 13 | 254 | 16240 | 44.98 | 1622 | 1583 | 325.9 |
| A | 6 | 16 | 15768 | 43.53 | 1622 | 1583 | 325.9 |
| A | 3 | 137 | 14236 | 38.83 | 1622 | 1583 | 325.9 |
| B | 12 | 111 | 39291 | 121.59 | 1609 | 1562 | 310.3 |
| B | 11 | 111 | 35743 | 110.16 | 1609 | 1562 | 310.3 |
| B | 0 | 183 | 35504 | 109.39 | 1609 | 1562 | 310.3 |
| C | 14 | 238 | 241464 | 655.71 | 1561 | 1572 | 365.9 |
| C | 13 | 61 | 10904 | 25.51 | 1561 | 1572 | 365.9 |
| C | 3 | 233 | 8320 | 18.44 | 1561 | 1572 | 365.9 |
| D | 1 | 52 | 1056126 | 2502.99 | 1566 | 1534 | 421.3 |
| D | 7 | 238 | 236875 | 558.56 | 1566 | 1534 | 421.3 |
| D | 2 | 234 | 59123 | 136.68 | 1566 | 1534 | 421.3 |
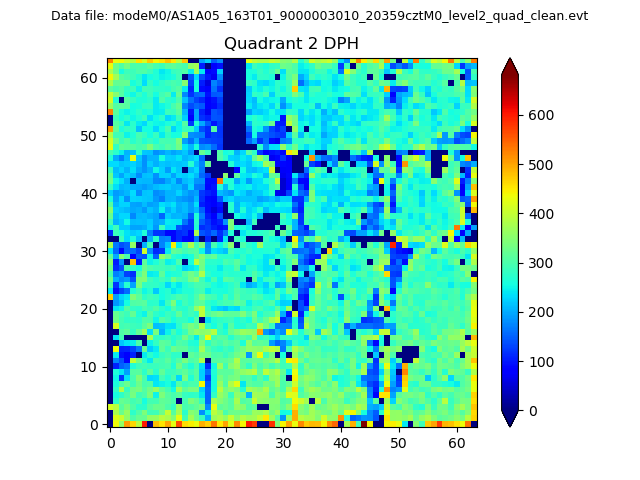
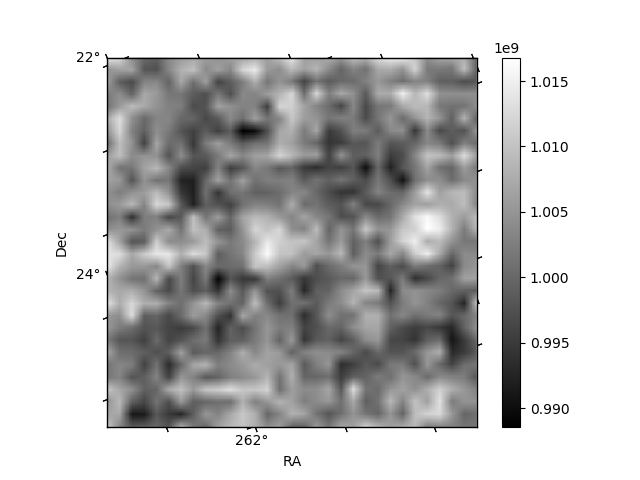
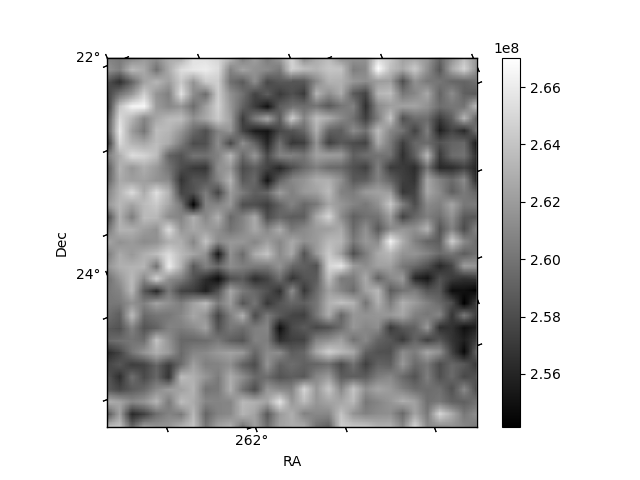
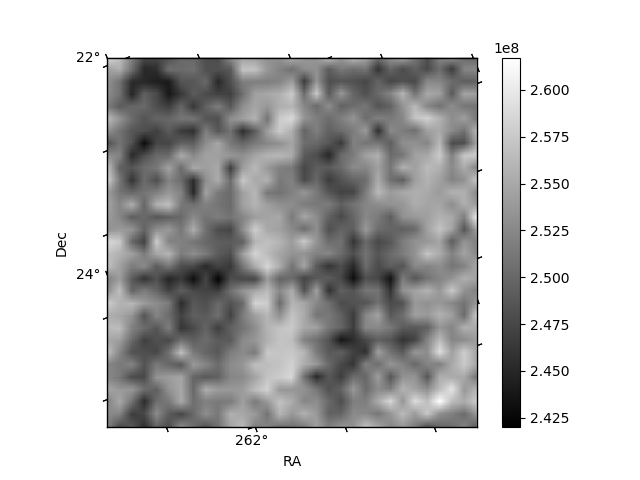
Histogram calculated using DETX and DETY for each event in the final _common_clean file
| Quadrant A | 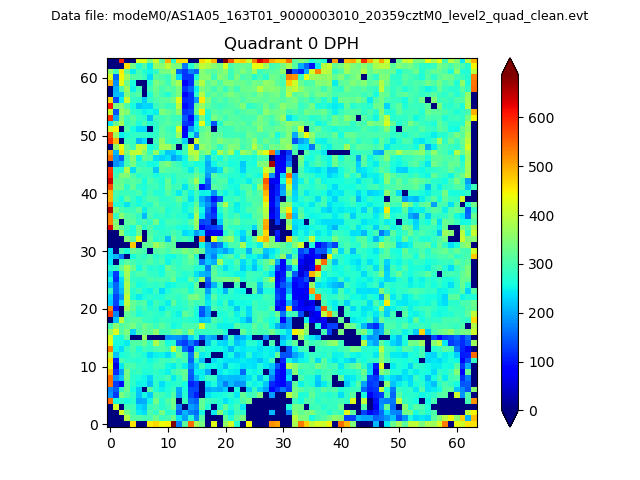 |
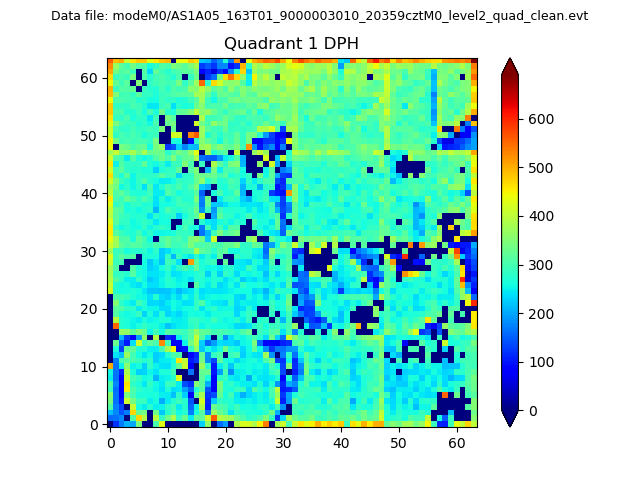 |
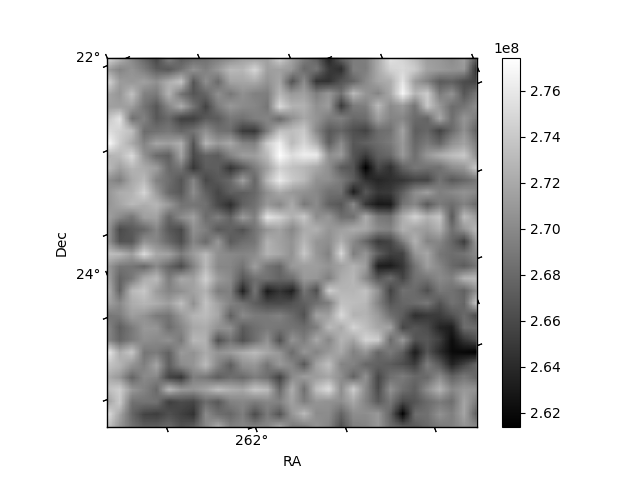
Quadrant B |
|---|---|---|---|
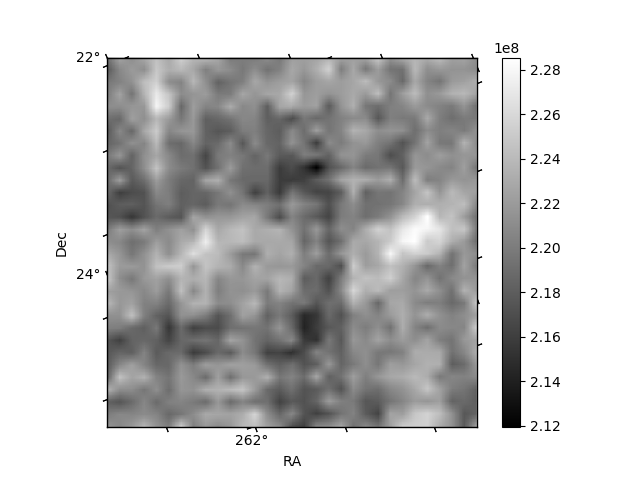
| Quadrant D | 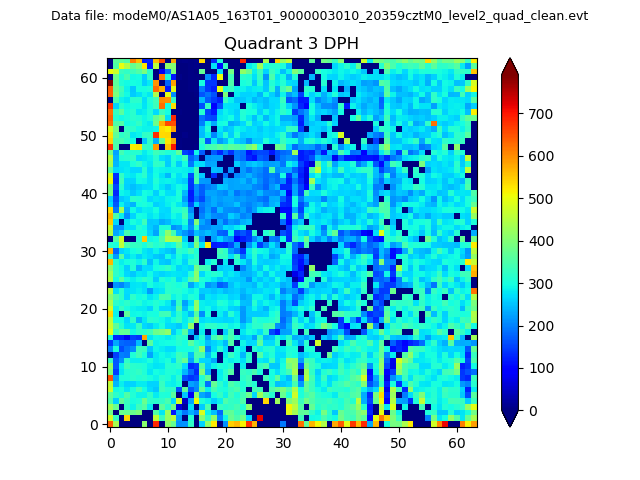 |
 |
Quadrant C |
| Plot type | Count rate plots | Images |
|---|---|---|
| Comparison with Poisson distribution Blue bars denote a histogram of data divided into 1 sec bins. Red curve is a Poisson curve with rate = median count rate of data. |
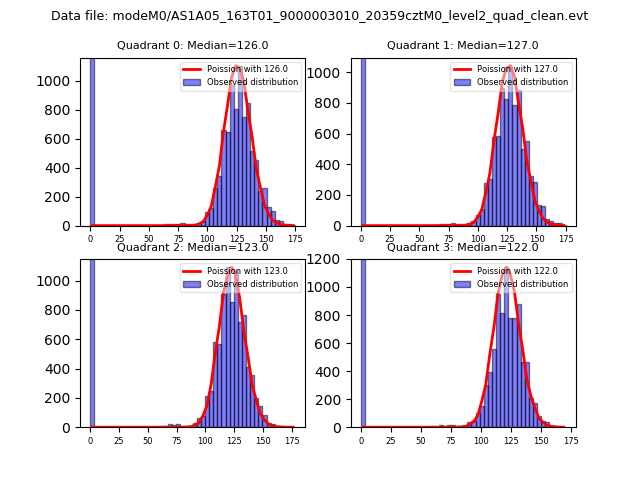 |
 |
| Quadrant-wise count rates Data is divided into 100 sec bins |
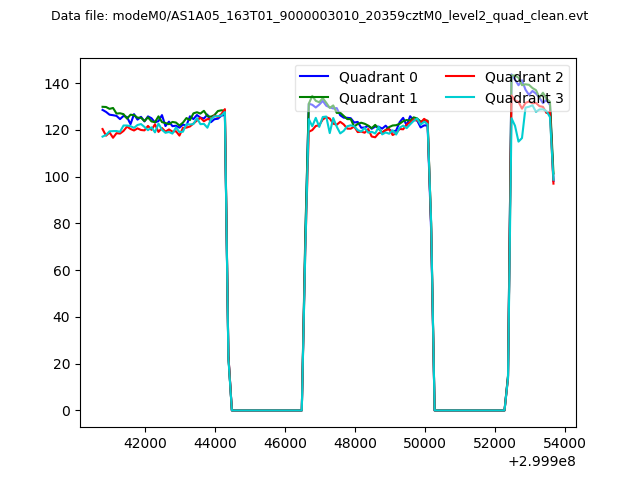 |
|
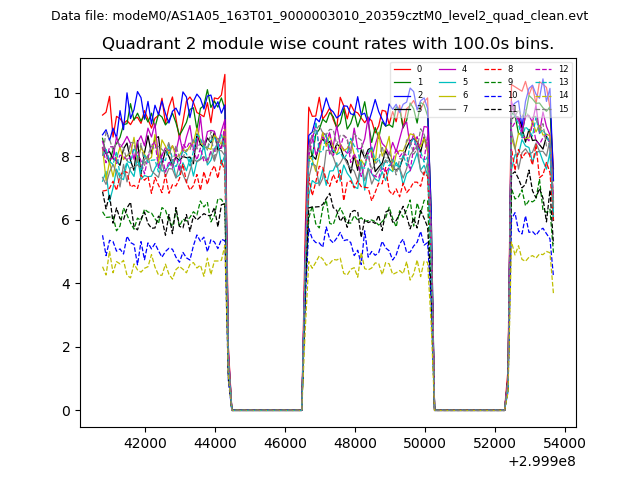
| Module-wise count rates for Quadrant A Data is divided into 100 sec bins |
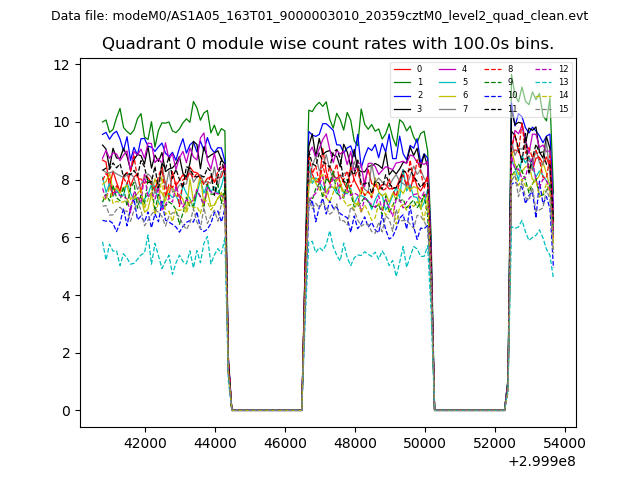 |
 |
| Module-wise count rates for Quadrant B Data is divided into 100 sec bins |
 |
 |
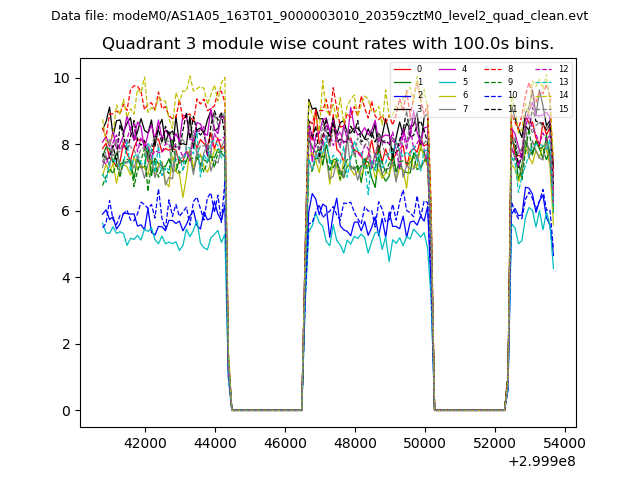
| Module-wise count rates for Quadrant C Data is divided into 100 sec bins |
 |
 |
| Module-wise count rates for Quadrant D Data is divided into 100 sec bins |
 |
 |
| Parameter | Plot |
|---|---|
| CZT HV Monitor |  |
| D_VDD | 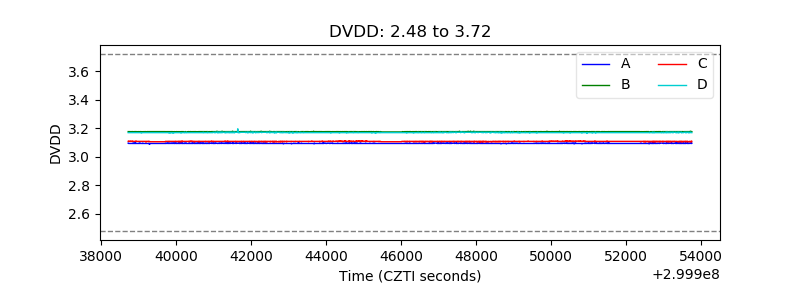 |
| Temperature 1 | 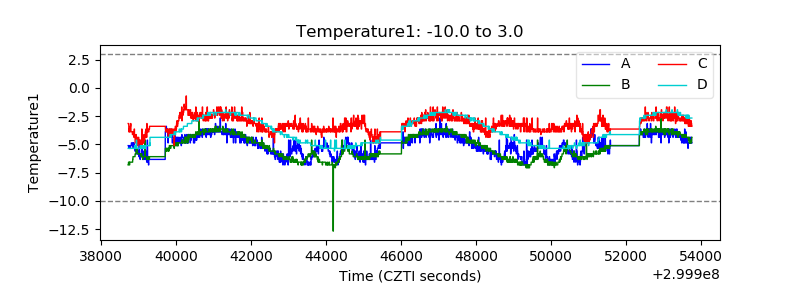 |
| Veto HV Monitor | 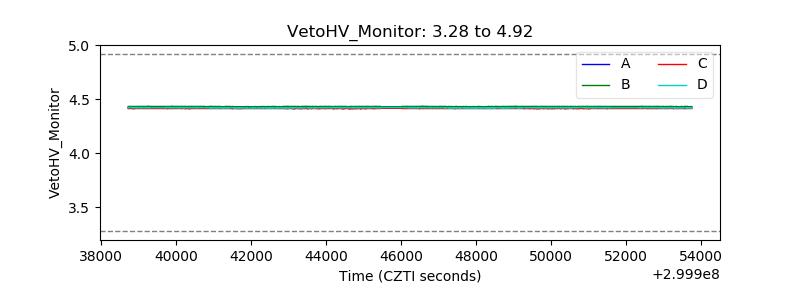 |
| Veto LLD | 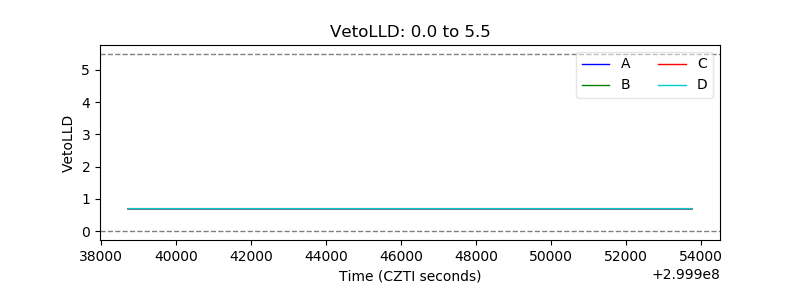 |
| Alpha Counter | 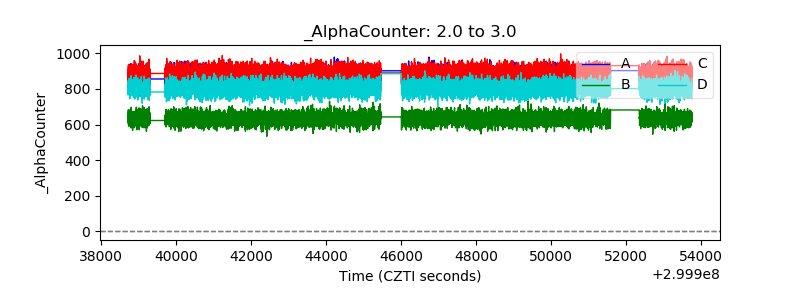 |
| _CPM_Rate | 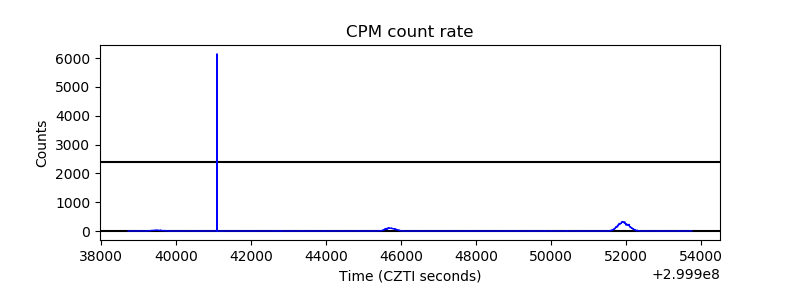 |
| CZT Counter | 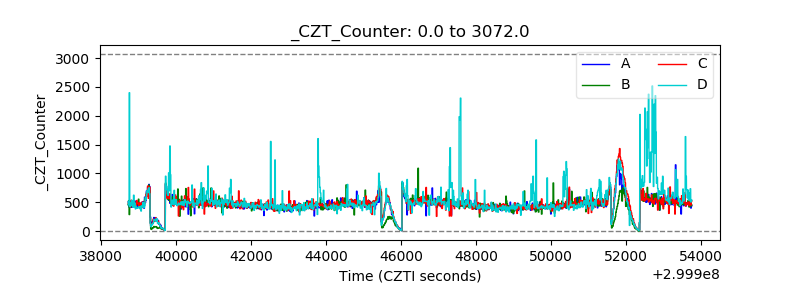 |
| +2.5 Volts monitor |  |
| +5 Volts monitor |  |
| _ROLL_ROT | 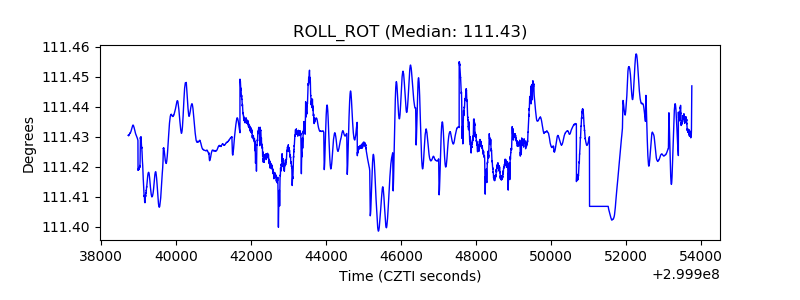 |
| _Roll_DEC | 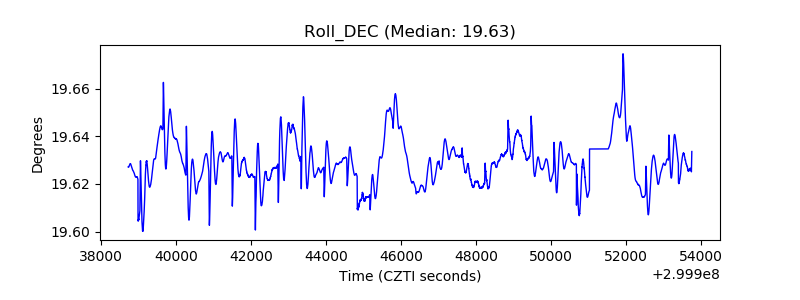 |
| _Roll_RA | 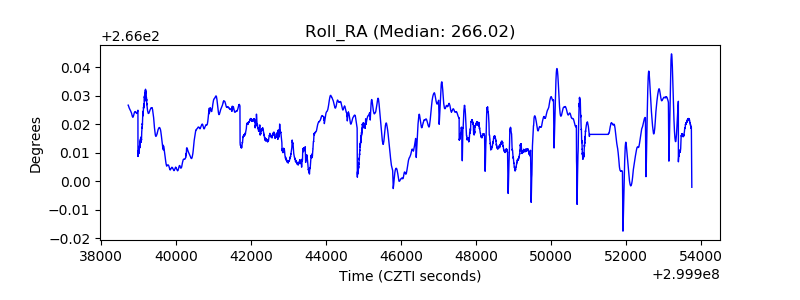 |
| Veto Counter | 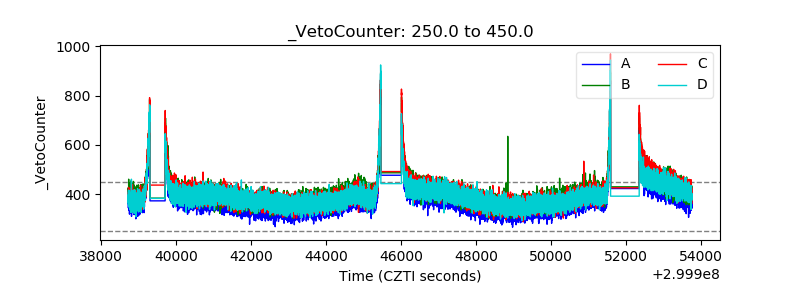 |