| Param | Original file | Final file |
|---|---|---|
| Filename | modeM0/AS1A05_163T01_9000003010_20361cztM0_level2.evt | modeM0/AS1A05_163T01_9000003010_20361cztM0_level2_quad_clean.evt |
| Size (bytes) | 530,144,640 | 98,879,040 |
| Size | 505.6 MB | 94.3 MB |
| Events in quadrant A | 3,345,069 | 642,098 |
| Events in quadrant B | 3,246,220 | 655,217 |
| Events in quadrant C | 3,244,863 | 639,091 |
| Events in quadrant D | 5,773,761 | 599,949 |
| Mode SS | |||
|---|---|---|---|
| Quadrant | BADHDUFLAG | Total packets | Discarded packets |
| A | 0 | 132 | 0 |
| B | 0 | 132 | 0 |
| C | 0 | 132 | 0 |
| D | 0 | 132 | 0 |
| Mode M0 | |||
|---|---|---|---|
| Quadrant | BADHDUFLAG | Total packets | Discarded packets |
| A | 0 | 14529 | 2 |
| B | 0 | 13990 | 2 |
| C | 0 | 13990 | 2 |
| D | 0 | 21847 | 4 |
| Mode M9 | |||
|---|---|---|---|
| Quadrant | BADHDUFLAG | Total packets | Discarded packets |
| A | 0 | 12 | 0 |
| B | 0 | 13 | 0 |
| C | 0 | 13 | 0 |
| D | 0 | 13 | 0 |
| Quadrant | Total seconds | Saturated seconds | Saturation percentage |
|---|---|---|---|
| A | 6573 | 65 | 0.988894% |
| B | 6573 | 54 | 0.821543% |
| C | 6573 | 100 | 1.521375% |
| D | 6572 | 750 | 11.412051% |
Noise dominated data is calculated using 1-second bins in cleaned event files. If a bin has >2000 counts, and if more than 50% of those come from <1% of pixels, then it is considered to be noise-dominated and hence unusable.
| Quadrant | # 1 sec bins | Bins with >0 counts | Bins with >2000 counts | High rate bins dominated by noise | Noise dominated (total time) | Noise dominated (detector-on time) | Marked lightcurve |
|---|---|---|---|---|---|---|---|
| A | 7633 | 6573 | 0 | 0 | 0.00% | 0.00% | 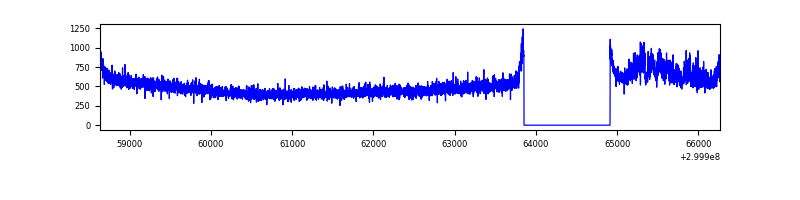 |
| B | 7633 | 6574 | 0 | 0 | 0.00% | 0.00% | 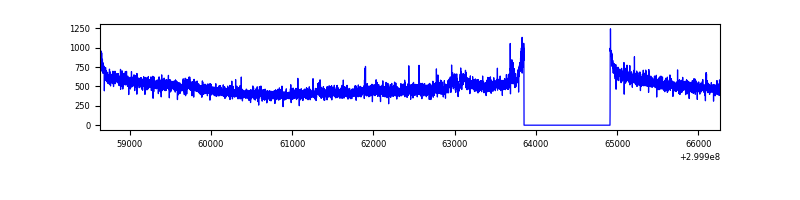 |
| C | 7633 | 6573 | 0 | 0 | 0.00% | 0.00% | 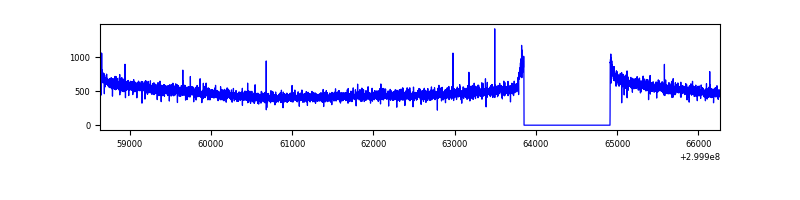 |
| D | 7632 | 6572 | 615 | 615 | 8.06% | 9.36% | 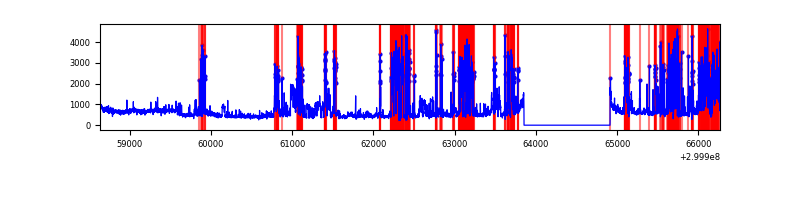 |
Top three noisy pixels from each quadrant. If the there are fewer than three noisy pixels in the level2.evt file, extra rows are filled as -1
| Pixel properties | Quadrant properties | ||||||
|---|---|---|---|---|---|---|---|
| Quadrant | DetID | PixID | Counts | Sigma | Mean | Median | Sigma |
| A | 14 | 111 | 190905 | 1152.36 | 819 | 801 | 165.0 |
| A | 0 | 226 | 6919 | 37.09 | 819 | 801 | 165.0 |
| A | 3 | 137 | 6888 | 36.9 | 819 | 801 | 165.0 |
| B | 15 | 201 | 25239 | 156.26 | 816 | 797 | 156.4 |
| B | 12 | 111 | 19334 | 118.51 | 816 | 797 | 156.4 |
| B | 11 | 111 | 17249 | 105.18 | 816 | 797 | 156.4 |
| C | 14 | 238 | 123802 | 655.83 | 800 | 806 | 187.5 |
| C | 13 | 61 | 5458 | 24.8 | 800 | 806 | 187.5 |
| C | 3 | 233 | 2395 | 8.47 | 800 | 806 | 187.5 |
| D | 1 | 52 | 2366539 | 12668.3 | 775 | 754 | 186.7 |
| D | 7 | 238 | 422320 | 2257.4 | 775 | 754 | 186.7 |
| D | 2 | 153 | 41399 | 217.64 | 775 | 754 | 186.7 |
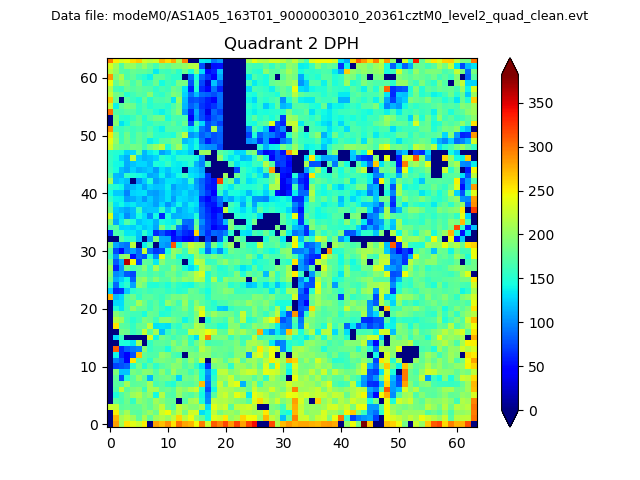
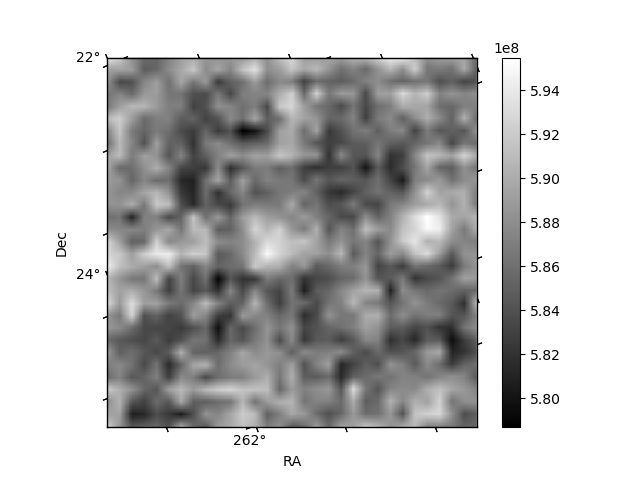
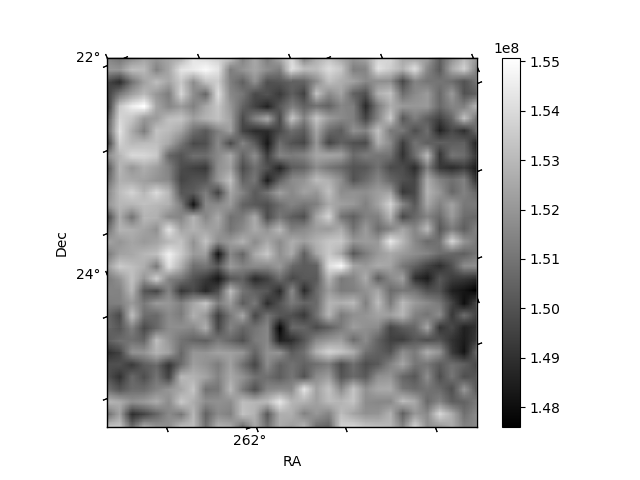
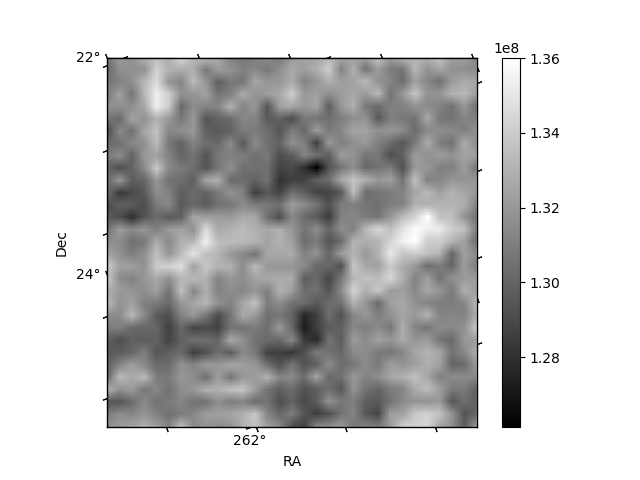
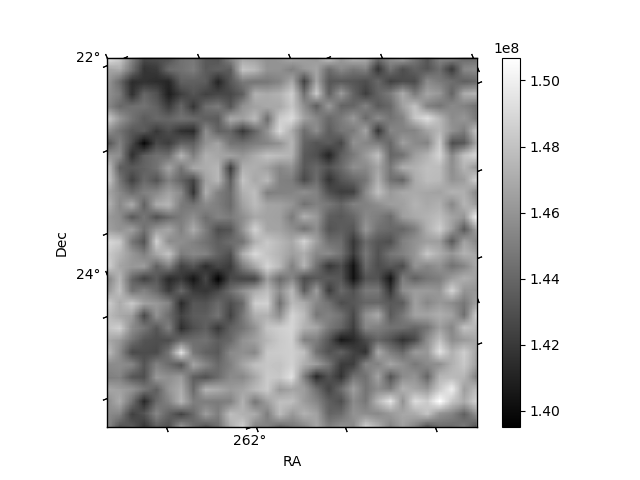
Histogram calculated using DETX and DETY for each event in the final _common_clean file
| Quadrant A | 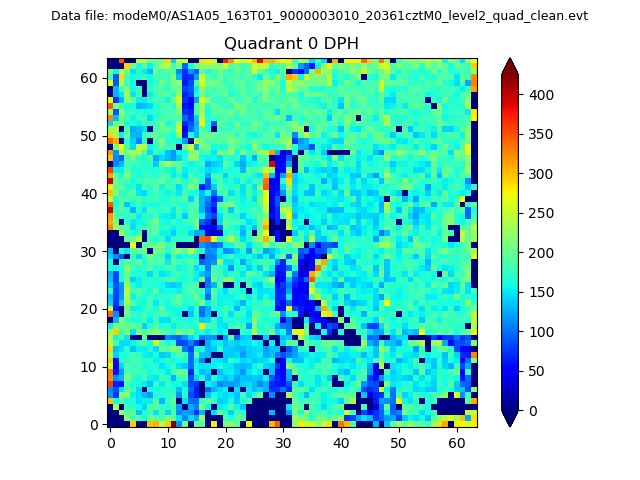 |
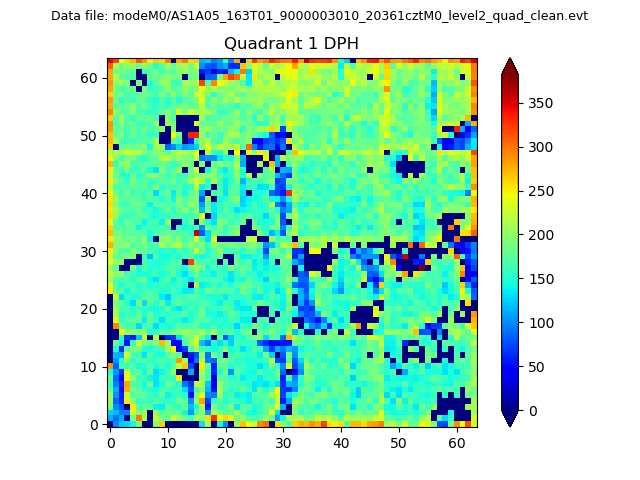 |
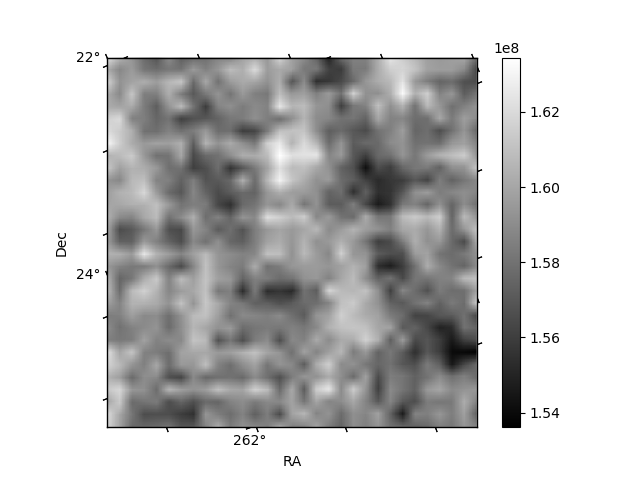
Quadrant B |
|---|---|---|---|
| Quadrant D | 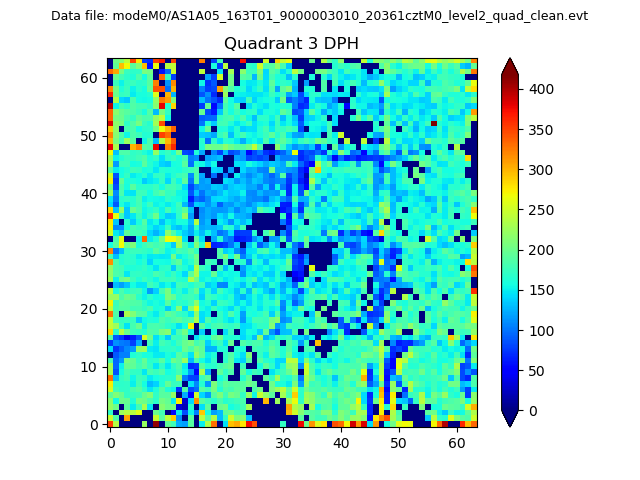 |
 |
Quadrant C |
| Plot type | Count rate plots | Images |
|---|---|---|
| Comparison with Poisson distribution Blue bars denote a histogram of data divided into 1 sec bins. Red curve is a Poisson curve with rate = median count rate of data. |
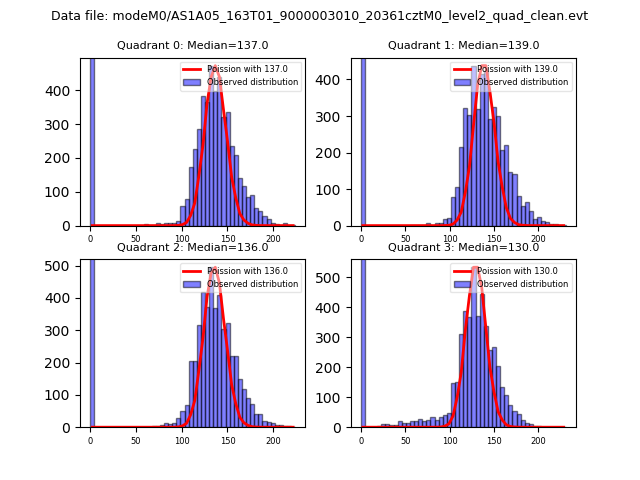 |
 |
| Quadrant-wise count rates Data is divided into 100 sec bins |
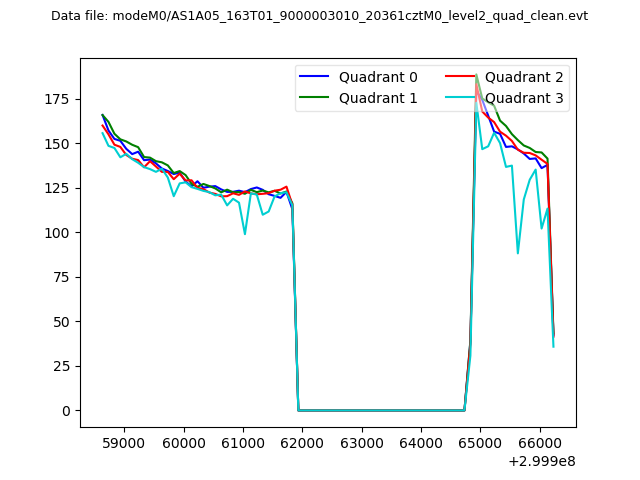 |
|
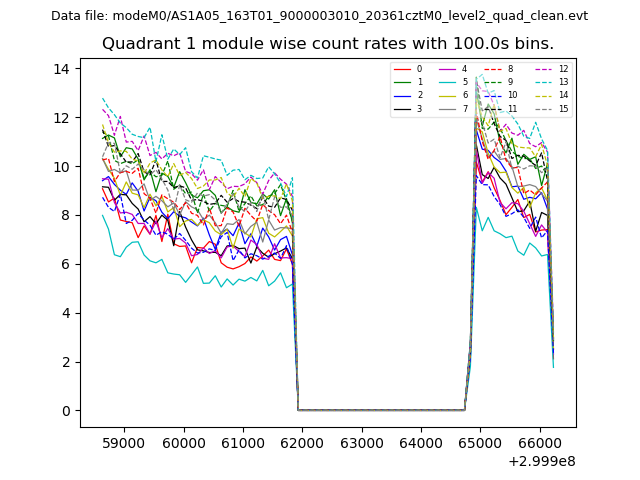
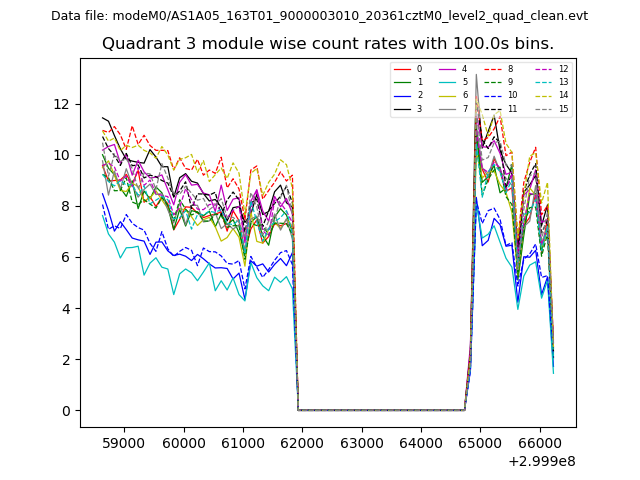
| Module-wise count rates for Quadrant A Data is divided into 100 sec bins |
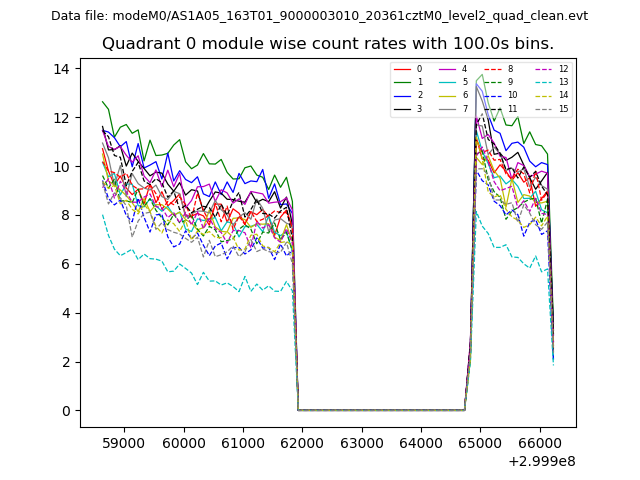 |
 |
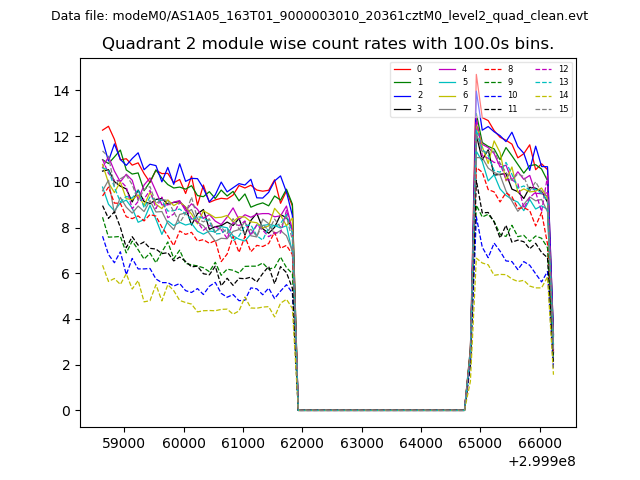
| Module-wise count rates for Quadrant B Data is divided into 100 sec bins |
 |
 |
| Module-wise count rates for Quadrant C Data is divided into 100 sec bins |
 |
 |
| Module-wise count rates for Quadrant D Data is divided into 100 sec bins |
 |
 |
| Parameter | Plot |
|---|---|
| CZT HV Monitor | 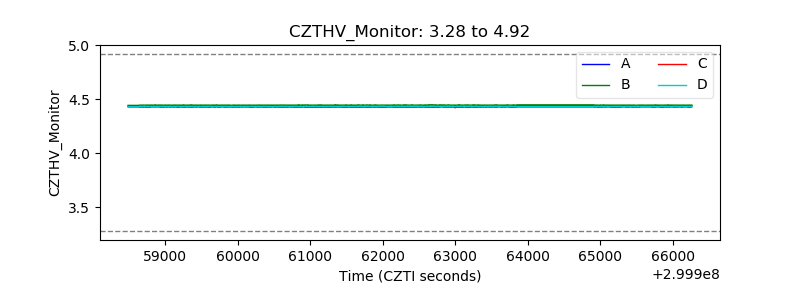 |
| D_VDD | 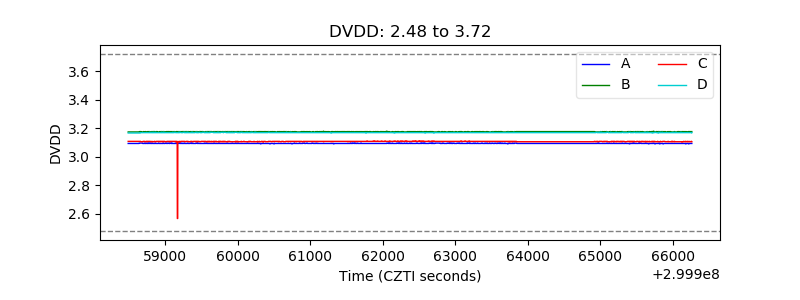 |
| Temperature 1 | 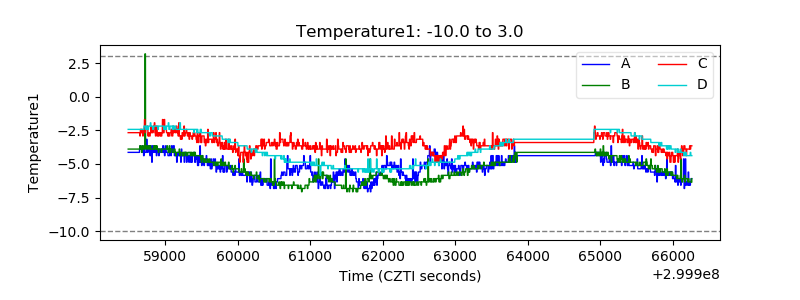 |
| Veto HV Monitor | 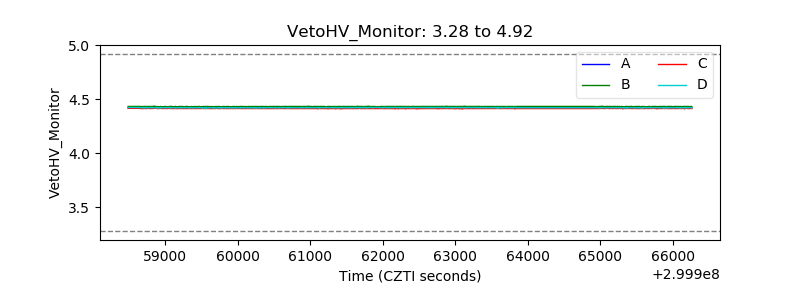 |
| Veto LLD | 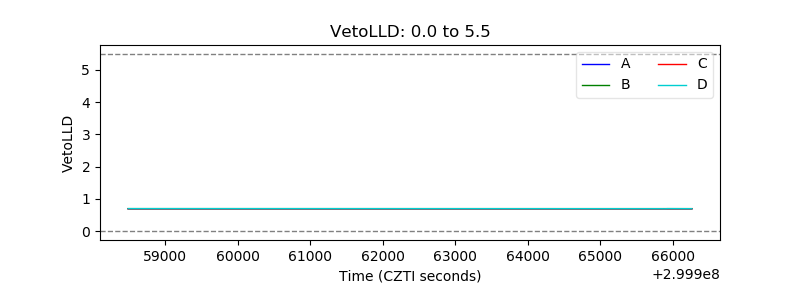 |
| Alpha Counter | 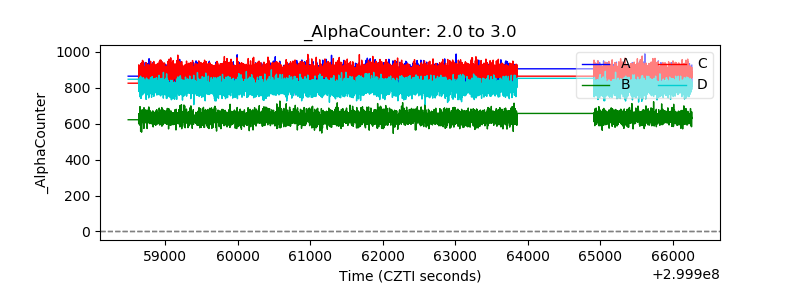 |
| _CPM_Rate | 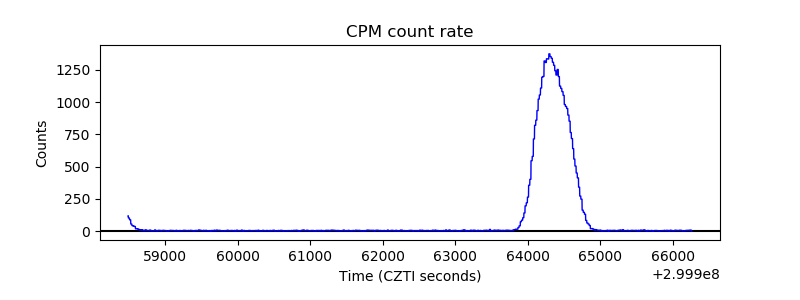 |
| CZT Counter | 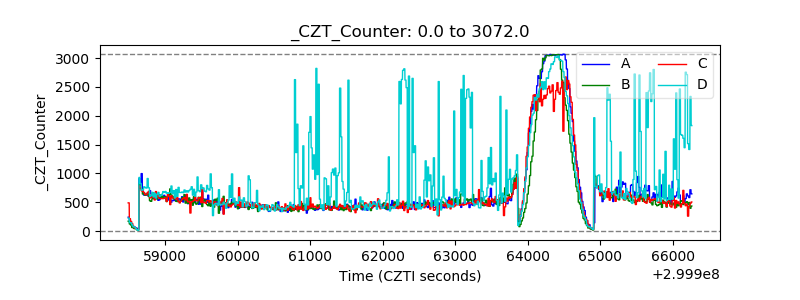 |
| +2.5 Volts monitor | 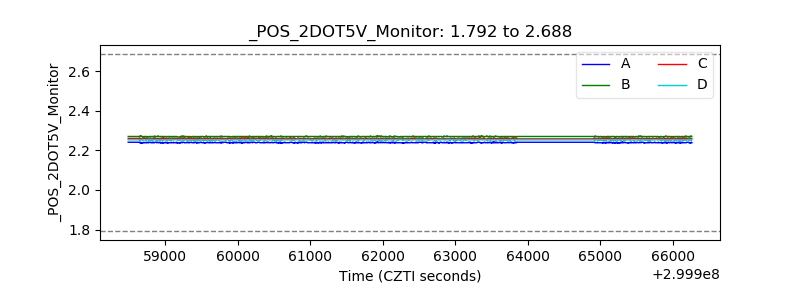 |
| +5 Volts monitor | 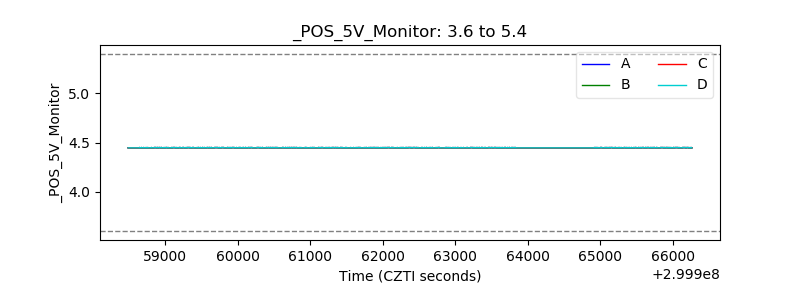 |
| _ROLL_ROT | 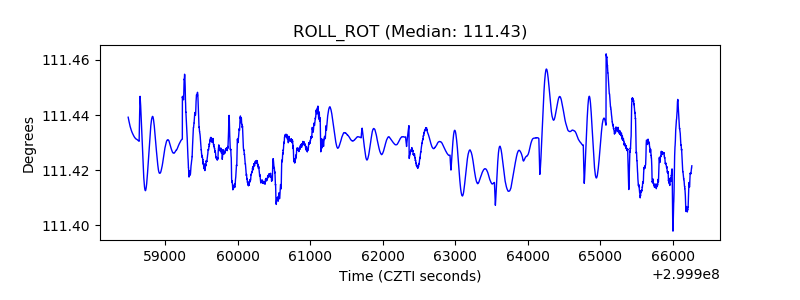 |
| _Roll_DEC | 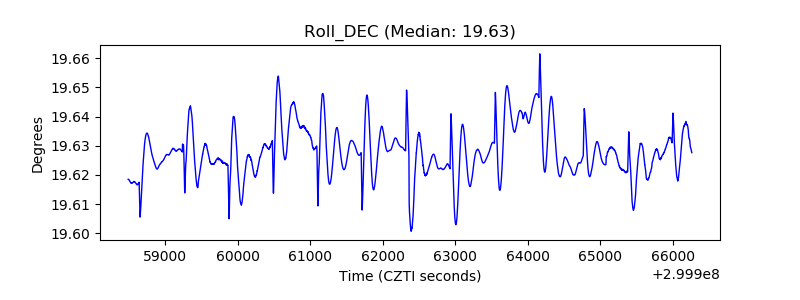 |
| _Roll_RA | 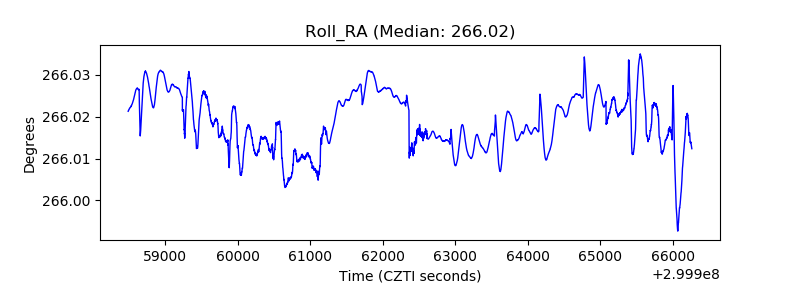 |
| Veto Counter | 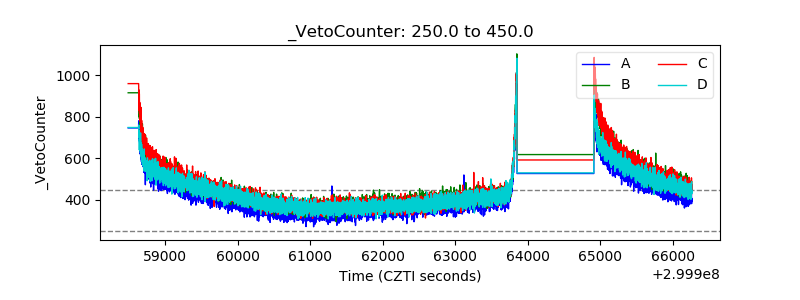 |