| Param | Original file | Final file |
|---|---|---|
| Filename | modeM0/AS1A05_163T01_9000003010_20363cztM0_level2.evt | modeM0/AS1A05_163T01_9000003010_20363cztM0_level2_quad_clean.evt |
| Size (bytes) | 171,106,560 | 36,311,040 |
| Size | 163.2 MB | 34.6 MB |
| Events in quadrant A | 1,091,255 | 249,787 |
| Events in quadrant B | 886,303 | 259,931 |
| Events in quadrant C | 906,763 | 251,658 |
| Events in quadrant D | 2,180,876 | 213,801 |
| Mode SS | |||
|---|---|---|---|
| Quadrant | BADHDUFLAG | Total packets | Discarded packets |
| A | 0 | 34 | 0 |
| B | 0 | 34 | 0 |
| C | 0 | 34 | 0 |
| D | 0 | 34 | 0 |
| Mode M0 | |||
|---|---|---|---|
| Quadrant | BADHDUFLAG | Total packets | Discarded packets |
| A | 0 | 4487 | 1 |
| B | 0 | 3733 | 1 |
| C | 0 | 3787 | 1 |
| D | 0 | 7636 | 1 |
| Mode M9 | |||
|---|---|---|---|
| Quadrant | BADHDUFLAG | Total packets | Discarded packets |
| A | 0 | 7 | 0 |
| B | 0 | 8 | 0 |
| C | 0 | 8 | 0 |
| D | 0 | 8 | 0 |
| Quadrant | Total seconds | Saturated seconds | Saturation percentage |
|---|---|---|---|
| A | 1686 | 21 | 1.245552% |
| B | 1686 | 6 | 0.355872% |
| C | 1686 | 24 | 1.423488% |
| D | 1686 | 404 | 23.962040% |
Noise dominated data is calculated using 1-second bins in cleaned event files. If a bin has >2000 counts, and if more than 50% of those come from <1% of pixels, then it is considered to be noise-dominated and hence unusable.
| Quadrant | # 1 sec bins | Bins with >0 counts | Bins with >2000 counts | High rate bins dominated by noise | Noise dominated (total time) | Noise dominated (detector-on time) | Marked lightcurve |
|---|---|---|---|---|---|---|---|
| A | 1686 | 1686 | 0 | 0 | 0.00% | 0.00% | 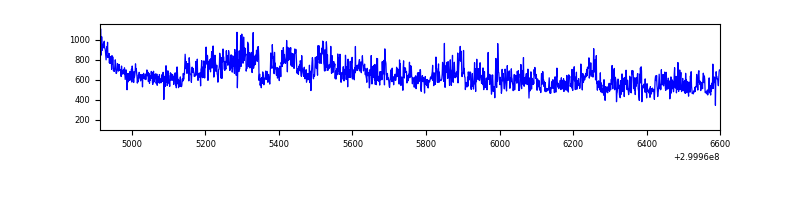 |
| B | 1686 | 1686 | 0 | 0 | 0.00% | 0.00% | 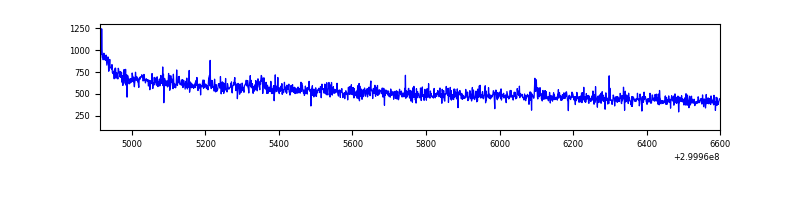 |
| C | 1686 | 1686 | 0 | 0 | 0.00% | 0.00% | 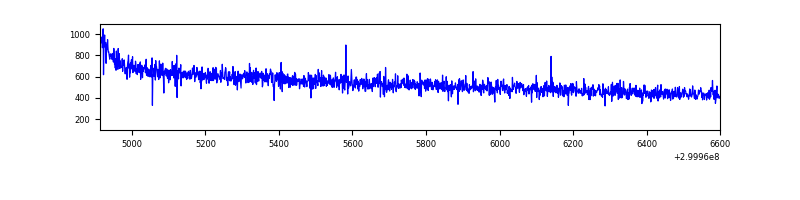 |
| D | 1686 | 1686 | 365 | 365 | 21.65% | 21.65% | 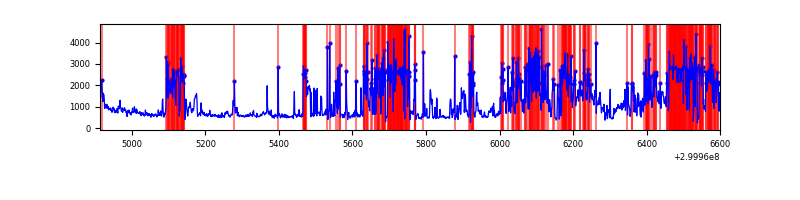 |
Top three noisy pixels from each quadrant. If the there are fewer than three noisy pixels in the level2.evt file, extra rows are filled as -1
| Pixel properties | Quadrant properties | ||||||
|---|---|---|---|---|---|---|---|
| Quadrant | DetID | PixID | Counts | Sigma | Mean | Median | Sigma |
| A | 14 | 111 | 232992 | 5122.84 | 222 | 218 | 45.4 |
| A | 0 | 226 | 1924 | 37.55 | 222 | 218 | 45.4 |
| A | 3 | 137 | 1659 | 31.71 | 222 | 218 | 45.4 |
| B | 0 | 198 | 8361 | 188.01 | 223 | 218 | 43.3 |
| B | 12 | 111 | 4994 | 110.27 | 223 | 218 | 43.3 |
| B | 11 | 111 | 4442 | 97.52 | 223 | 218 | 43.3 |
| C | 14 | 238 | 35235 | 654.57 | 223 | 225 | 53.5 |
| C | 13 | 61 | 1515 | 24.12 | 223 | 225 | 53.5 |
| C | 3 | 233 | 725 | 9.35 | 223 | 225 | 53.5 |
| D | 1 | 52 | 909034 | 17901.28 | 204 | 199 | 50.8 |
| D | 7 | 238 | 457095 | 8999.46 | 204 | 199 | 50.8 |
| D | 2 | 153 | 38961 | 763.49 | 204 | 199 | 50.8 |
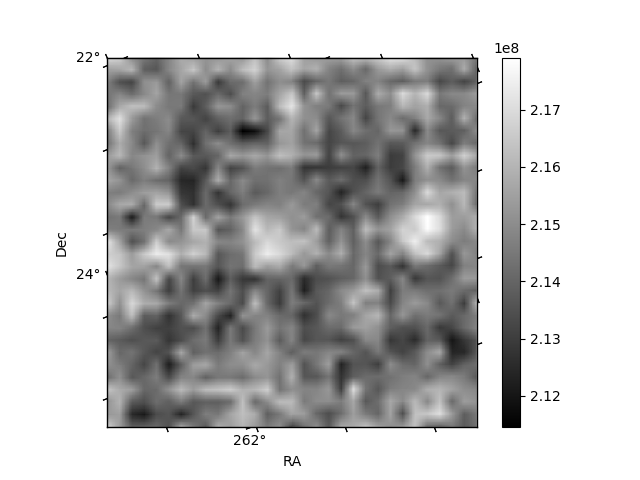
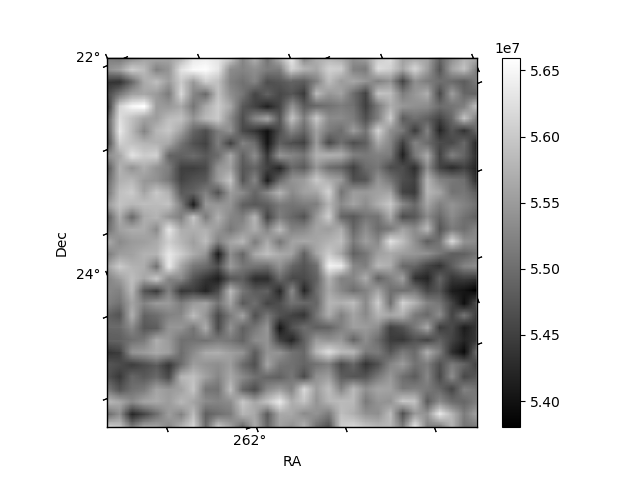
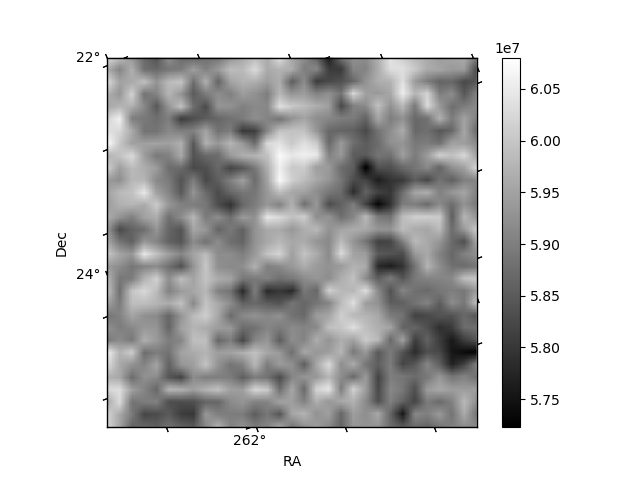
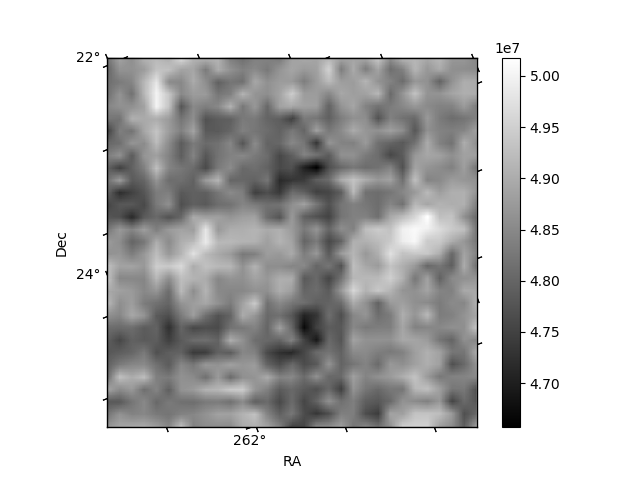
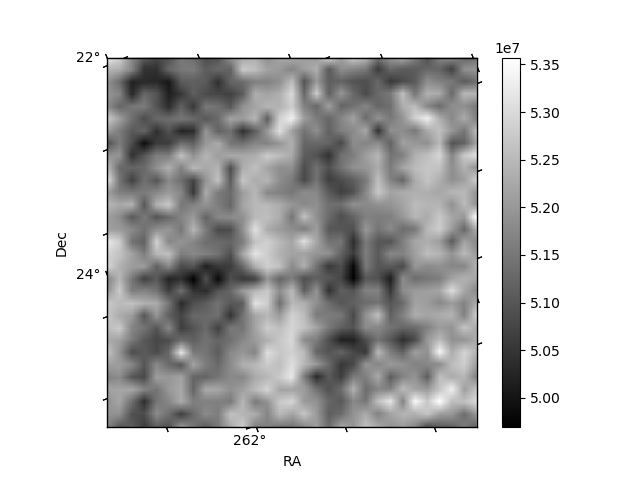
Histogram calculated using DETX and DETY for each event in the final _common_clean file
| Quadrant A | 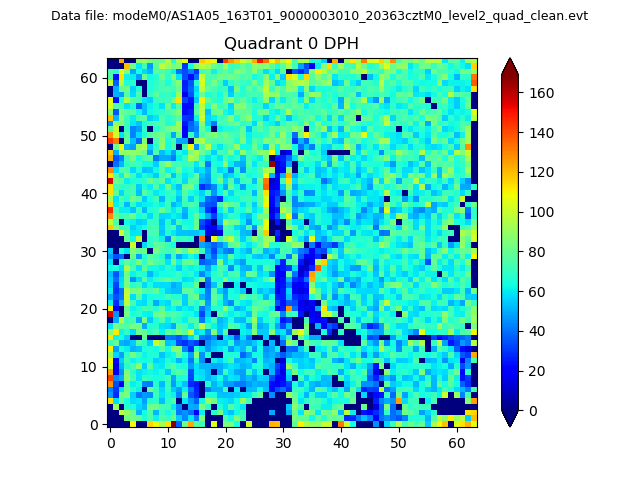 |
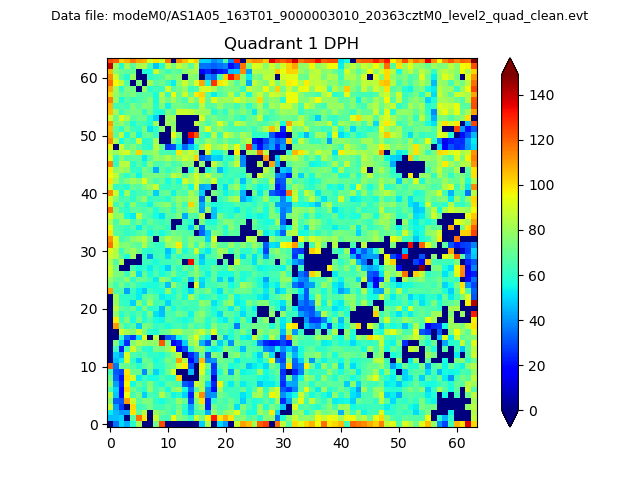 |
Quadrant B |
|---|---|---|---|
| Quadrant D |  |
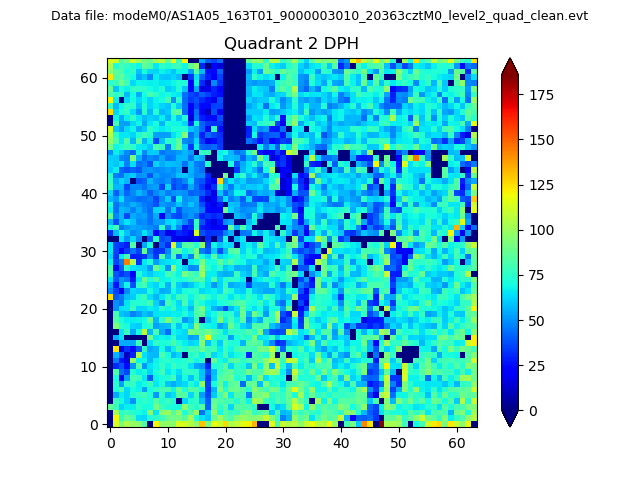 |
Quadrant C |
| Plot type | Count rate plots | Images |
|---|---|---|
| Comparison with Poisson distribution Blue bars denote a histogram of data divided into 1 sec bins. Red curve is a Poisson curve with rate = median count rate of data. |
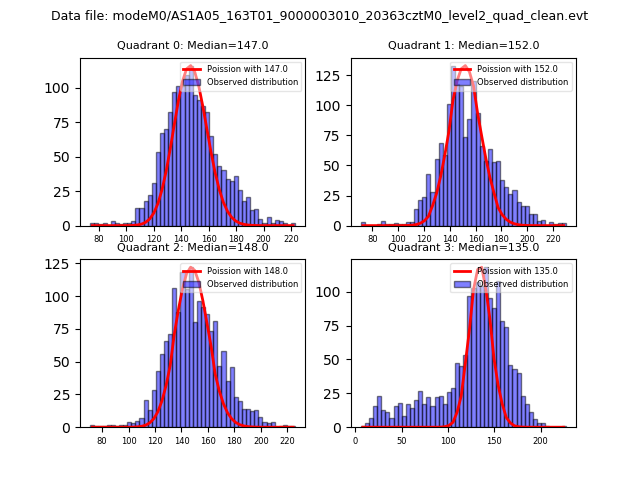 |
 |
| Quadrant-wise count rates Data is divided into 100 sec bins |
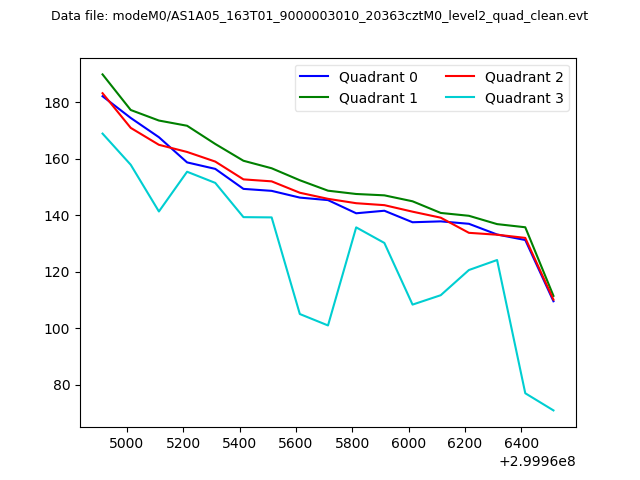 |
|
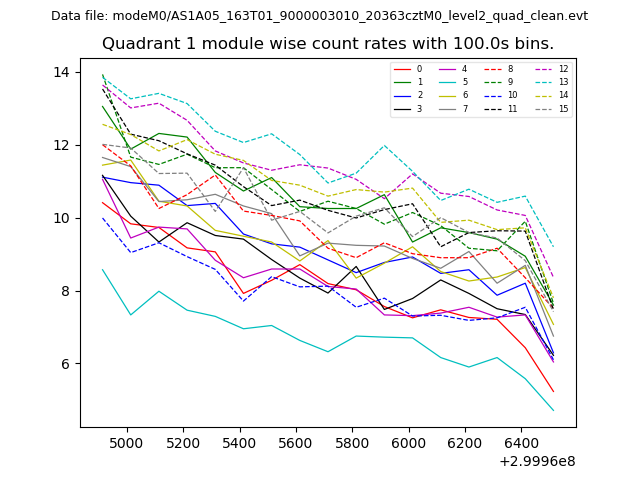
| Module-wise count rates for Quadrant A Data is divided into 100 sec bins |
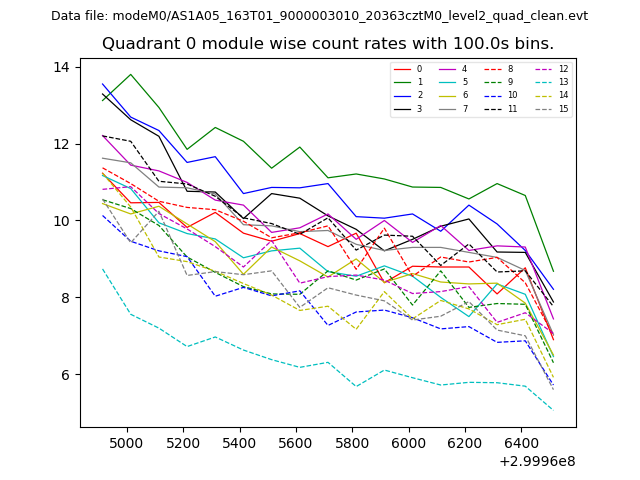 |
 |
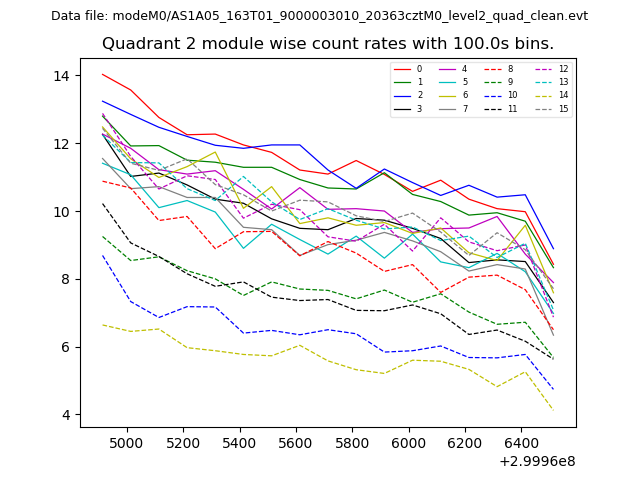
| Module-wise count rates for Quadrant B Data is divided into 100 sec bins |
 |
 |
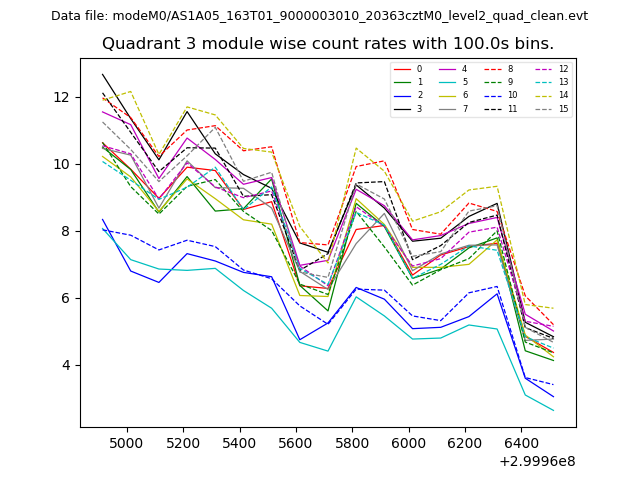
| Module-wise count rates for Quadrant C Data is divided into 100 sec bins |
 |
 |
| Module-wise count rates for Quadrant D Data is divided into 100 sec bins |
 |
 |
| Parameter | Plot |
|---|---|
| CZT HV Monitor | 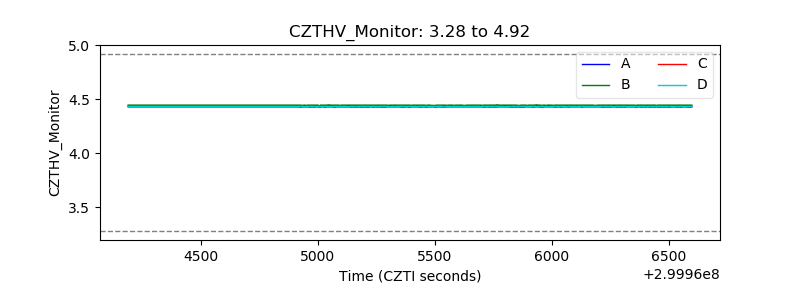 |
| D_VDD | 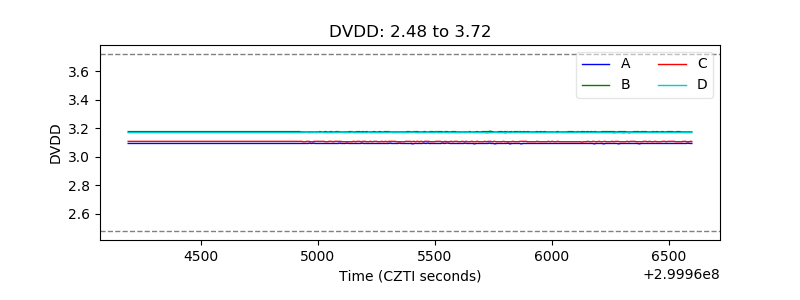 |
| Temperature 1 | 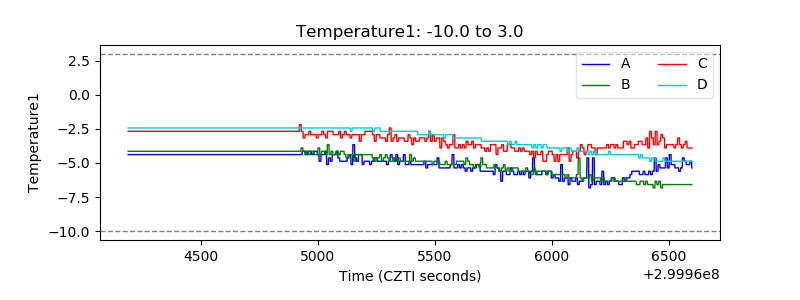 |
| Veto HV Monitor |  |
| Veto LLD | 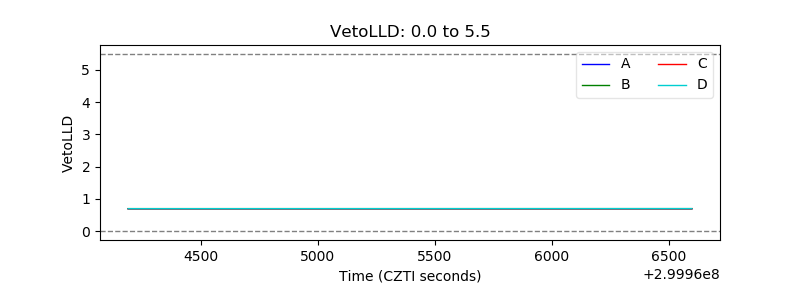 |
| Alpha Counter | 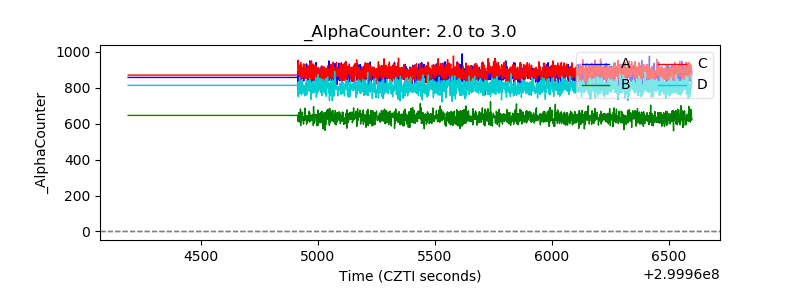 |
| _CPM_Rate | 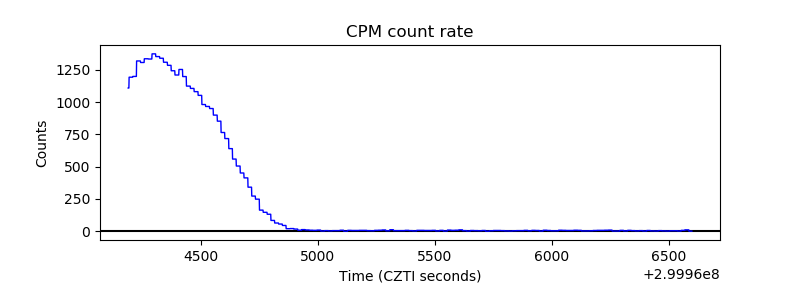 |
| CZT Counter | 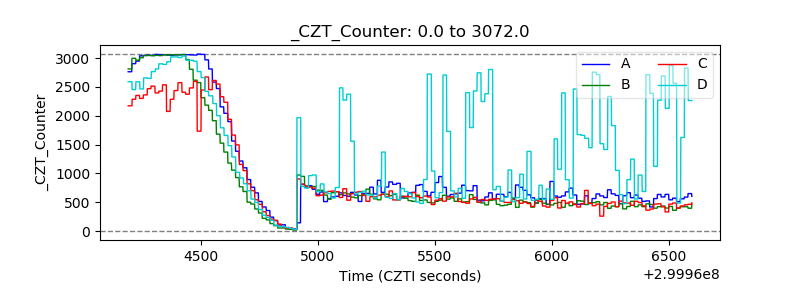 |
| +2.5 Volts monitor | 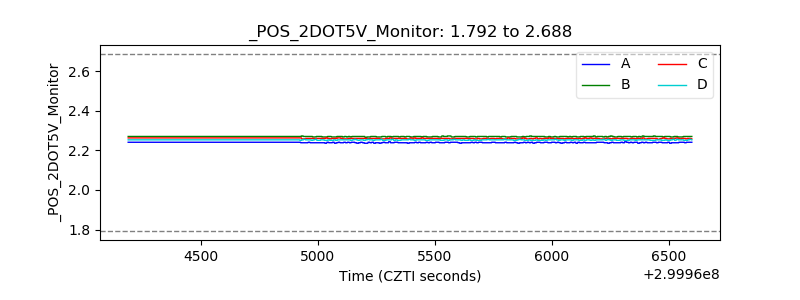 |
| +5 Volts monitor |  |
| _ROLL_ROT | 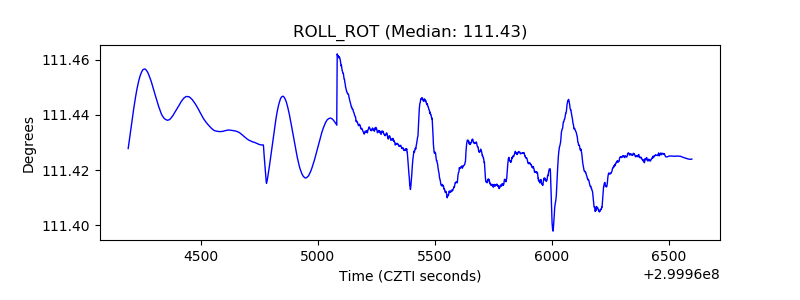 |
| _Roll_DEC | 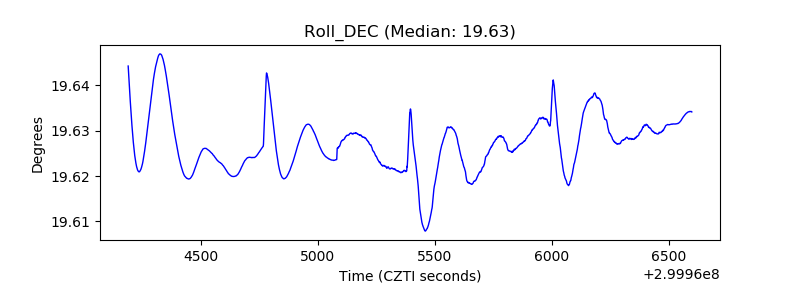 |
| _Roll_RA | 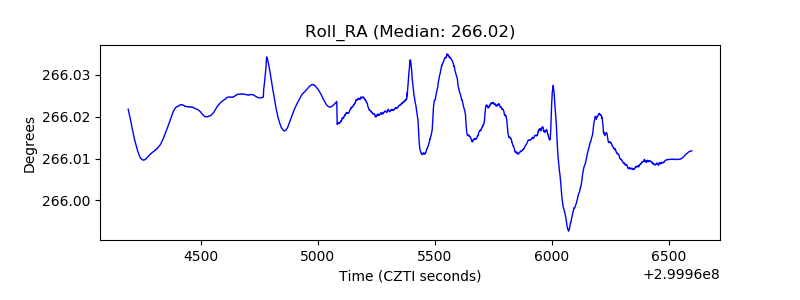 |
| Veto Counter | 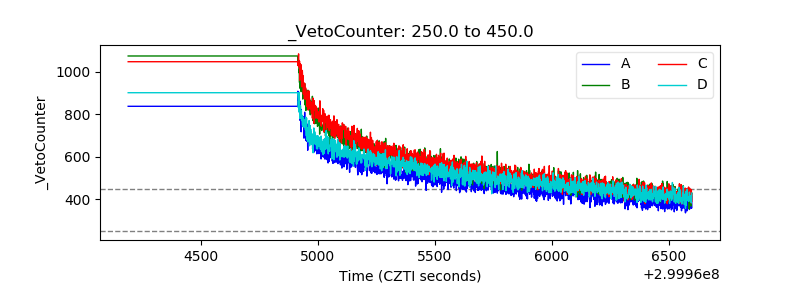 |