| Param | Original file | Final file |
|---|---|---|
| Filename | modeM0/AS1A05_205T01_9000003012cztM0_level2.fits | modeM0/AS1A05_205T01_9000003012cztM0_level2_quad_clean.evt |
| Size (bytes) | 1,222,545,600 | 999,610,560 |
| Size | 1.1 GB | 953.3 MB |
| Events in quadrant A | 7,467,790 | 5,678,075 |
| Events in quadrant B | 7,212,758 | 5,661,496 |
| Events in quadrant C | 7,419,324 | 5,444,739 |
| Events in quadrant D | 6,396,370 | 4,959,181 |
| Mode M9 | |||
|---|---|---|---|
| Quadrant | BADHDUFLAG | Total packets | Discarded packets |
| A | 0 | 205 | 0 |
| B | 0 | 205 | 0 |
| C | 0 | 205 | 0 |
| D | 0 | 205 | 0 |
| Mode SS | |||
|---|---|---|---|
| Quadrant | BADHDUFLAG | Total packets | Discarded packets |
| A | 0 | 2532 | 0 |
| B | 0 | 2532 | 0 |
| C | 0 | 2532 | 0 |
| D | 0 | 2532 | 0 |
| Mode M0 | |||
|---|---|---|---|
| Quadrant | BADHDUFLAG | Total packets | Discarded packets |
| A | 0 | 262043 | 0 |
| B | 0 | 271662 | 0 |
| C | 0 | 257585 | 0 |
| D | 0 | 291862 | 0 |
| Quadrant | Total seconds | Saturated seconds | Saturation percentage |
|---|---|---|---|
| A | 124454 | 2039 | 1.638356% |
| B | 124454 | 2576 | 2.069841% |
| C | 124455 | 2061 | 1.656020% |
| D | 124454 | 2851 | 2.290806% |
Noise dominated data is calculated using 1-second bins in cleaned event files. If a bin has >2000 counts, and if more than 50% of those come from <1% of pixels, then it is considered to be noise-dominated and hence unusable.
| Quadrant | # 1 sec bins | Bins with >0 counts | Bins with >2000 counts | High rate bins dominated by noise | Noise dominated (total time) | Noise dominated (detector-on time) | Marked lightcurve |
|---|---|---|---|---|---|---|---|
| A | 144840 | 124447 | 0 | 0 | 0.00% | 0.00% |  |
| B | 144840 | 124442 | 0 | 0 | 0.00% | 0.00% |  |
| C | 144840 | 124455 | 0 | 0 | 0.00% | 0.00% |  |
| D | 144840 | 124440 | 0 | 0 | 0.00% | 0.00% |  |
Top three noisy pixels from each quadrant. If the there are fewer than three noisy pixels in the level2.evt file, extra rows are filled as -1
| Pixel properties | Quadrant properties | ||||||
|---|---|---|---|---|---|---|---|
| Quadrant | DetID | PixID | Counts | Sigma | Mean | Median | Sigma |
| A | 0 | 29 | 7358 | 11.55 | 1945 | 1828 | 478.6 |
| A | 7 | 110 | 5891 | 8.49 | 1945 | 1828 | 478.6 |
| A | 0 | 30 | 5751 | 8.2 | 1945 | 1828 | 478.6 |
| B | 2 | 9 | 5945 | 10.97 | 1910 | 1823 | 375.9 |
| B | 2 | 8 | 4883 | 8.14 | 1910 | 1823 | 375.9 |
| B | 14 | 254 | 4842 | 8.03 | 1910 | 1823 | 375.9 |
| C | 1 | 80 | 5637 | 7.66 | 1956 | 1828 | 497.5 |
| C | 1 | 81 | 5547 | 7.48 | 1956 | 1828 | 497.5 |
| C | 12 | 241 | 5182 | 6.74 | 1956 | 1828 | 497.5 |
| D | 3 | 14 | 4713 | 6.21 | 1830 | 1669 | 490.4 |
| D | 7 | 3 | 4538 | 5.85 | 1830 | 1669 | 490.4 |
| D | 6 | 231 | 4521 | 5.81 | 1830 | 1669 | 490.4 |
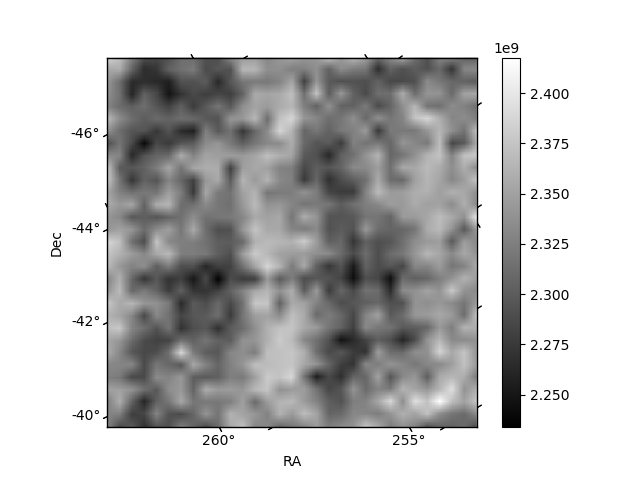
Histogram calculated using DETX and DETY for each event in the final _common_clean file
| Quadrant A |  |
 |
Quadrant B |
|---|---|---|---|
| Quadrant D |  |
 |
Quadrant C |
| Plot type | Count rate plots | Images |
|---|---|---|
| Comparison with Poisson distribution Blue bars denote a histogram of data divided into 1 sec bins. Red curve is a Poisson curve with rate = median count rate of data. |
 |
 |
| Quadrant-wise count rates Data is divided into 100 sec bins |
 |
|
| Module-wise count rates for Quadrant A Data is divided into 100 sec bins |
 |
 |
| Module-wise count rates for Quadrant B Data is divided into 100 sec bins |
 |
 |
| Module-wise count rates for Quadrant C Data is divided into 100 sec bins |
 |
 |
| Module-wise count rates for Quadrant D Data is divided into 100 sec bins |
 |
 |
| Parameter | Plot |
|---|---|
| CZT HV Monitor |  |
| D_VDD | 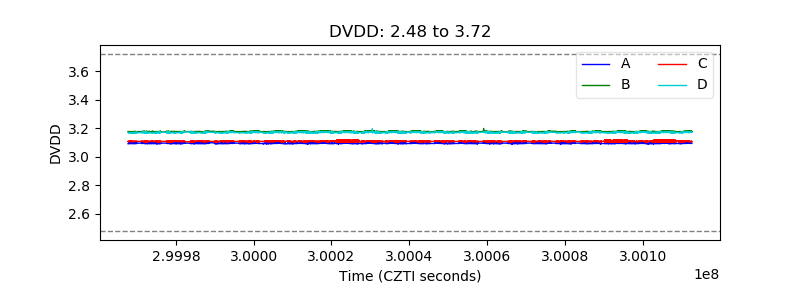 |
| Temperature 1 |  |
| Veto HV Monitor |  |
| Veto LLD |  |
| Alpha Counter |  |
| _CPM_Rate |  |
| CZT Counter |  |
| +2.5 Volts monitor |  |
| +5 Volts monitor |  |
| _ROLL_ROT |  |
| _Roll_DEC |  |
| _Roll_RA |  |
| Veto Counter |  |