| Param | Original file | Final file |
|---|---|---|
| Filename | modeM0/AS1A05_205T01_9000003012_20363cztM0_level2.evt | modeM0/AS1A05_205T01_9000003012_20363cztM0_level2_quad_clean.evt |
| Size (bytes) | 305,928,000 | 41,296,320 |
| Size | 291.8 MB | 39.4 MB |
| Events in quadrant A | 2,563,177 | 252,856 |
| Events in quadrant B | 1,904,644 | 263,329 |
| Events in quadrant C | 1,815,874 | 248,217 |
| Events in quadrant D | 2,739,465 | 234,470 |
| Mode M9 | |||
|---|---|---|---|
| Quadrant | BADHDUFLAG | Total packets | Discarded packets |
| A | 0 | 12 | 0 |
| B | 0 | 12 | 0 |
| C | 0 | 12 | 0 |
| D | 0 | 12 | 0 |
| Mode SS | |||
|---|---|---|---|
| Quadrant | BADHDUFLAG | Total packets | Discarded packets |
| A | 0 | 74 | 0 |
| B | 0 | 74 | 0 |
| C | 0 | 74 | 0 |
| D | 0 | 74 | 0 |
| Mode M0 | |||
|---|---|---|---|
| Quadrant | BADHDUFLAG | Total packets | Discarded packets |
| A | 0 | 10227 | 1 |
| B | 0 | 7761 | 2 |
| C | 0 | 7474 | 1 |
| D | 0 | 10510 | 1 |
| Quadrant | Total seconds | Saturated seconds | Saturation percentage |
|---|---|---|---|
| A | 3541 | 242 | 6.834228% |
| B | 3540 | 33 | 0.932203% |
| C | 3540 | 31 | 0.875706% |
| D | 3540 | 281 | 7.937853% |
Noise dominated data is calculated using 1-second bins in cleaned event files. If a bin has >2000 counts, and if more than 50% of those come from <1% of pixels, then it is considered to be noise-dominated and hence unusable.
| Quadrant | # 1 sec bins | Bins with >0 counts | Bins with >2000 counts | High rate bins dominated by noise | Noise dominated (total time) | Noise dominated (detector-on time) | Marked lightcurve |
|---|---|---|---|---|---|---|---|
| A | 4741 | 3542 | 0 | 0 | 0.00% | 0.00% | 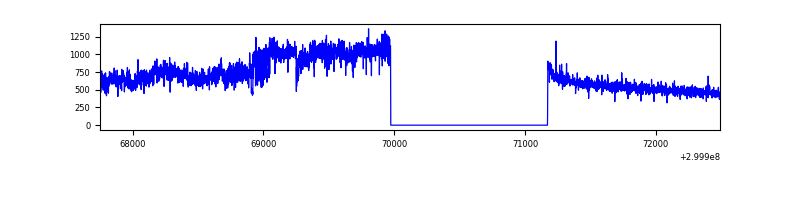 |
| B | 4740 | 3541 | 6 | 6 | 0.13% | 0.17% | 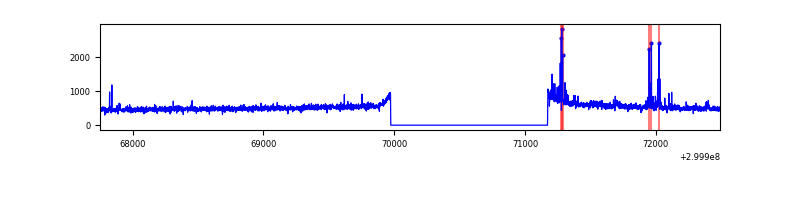 |
| C | 4740 | 3541 | 0 | 0 | 0.00% | 0.00% | 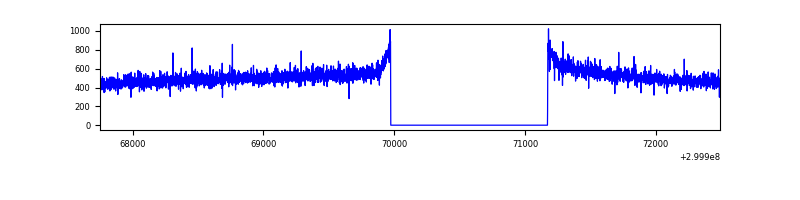 |
| D | 4740 | 3541 | 215 | 215 | 4.54% | 6.07% | 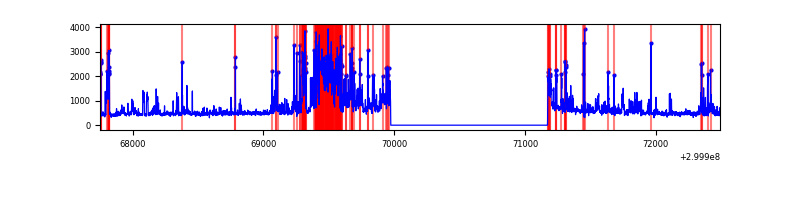 |
Top three noisy pixels from each quadrant. If the there are fewer than three noisy pixels in the level2.evt file, extra rows are filled as -1
| Pixel properties | Quadrant properties | ||||||
|---|---|---|---|---|---|---|---|
| Quadrant | DetID | PixID | Counts | Sigma | Mean | Median | Sigma |
| A | 14 | 111 | 793395 | 8496.95 | 458 | 448 | 93.3 |
| A | 13 | 254 | 4063 | 38.74 | 458 | 448 | 93.3 |
| A | 0 | 226 | 3908 | 37.08 | 458 | 448 | 93.3 |
| B | 0 | 190 | 17842 | 192.36 | 467 | 455 | 90.4 |
| B | 0 | 197 | 17625 | 189.96 | 467 | 455 | 90.4 |
| B | 4 | 142 | 16075 | 172.81 | 467 | 455 | 90.4 |
| C | 14 | 238 | 70628 | 667.14 | 447 | 449 | 105.2 |
| C | 13 | 61 | 3170 | 25.87 | 447 | 449 | 105.2 |
| C | 3 | 233 | 1412 | 9.15 | 447 | 449 | 105.2 |
| D | 1 | 52 | 646867 | 6035.93 | 435 | 421 | 107.1 |
| D | 11 | 176 | 429330 | 4004.76 | 435 | 421 | 107.1 |
| D | 2 | 120 | 16012 | 145.57 | 435 | 421 | 107.1 |
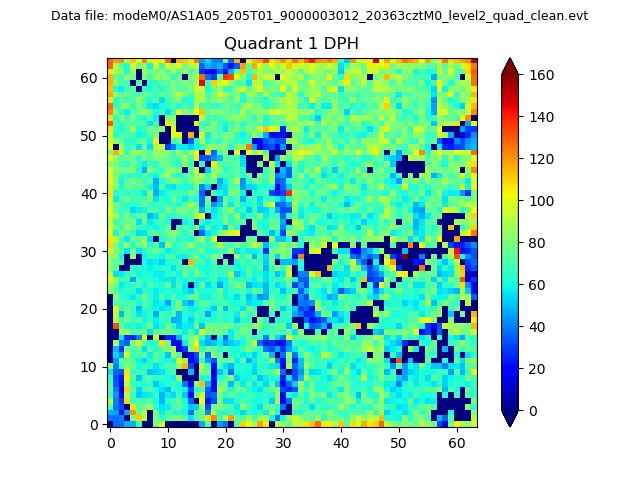
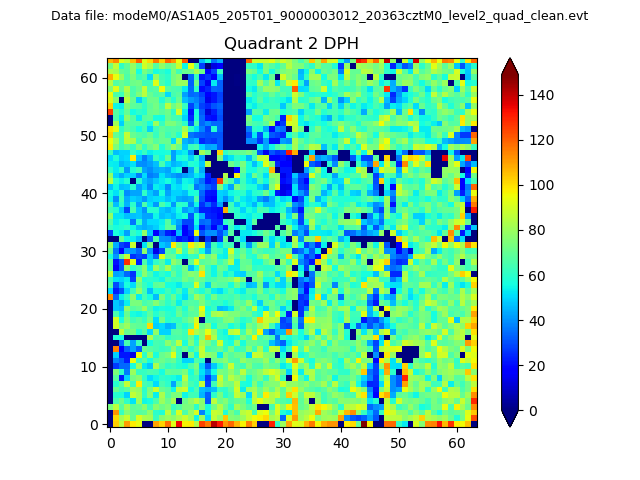
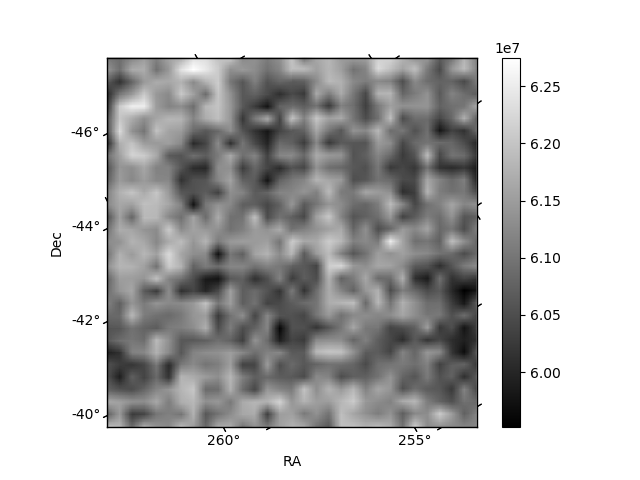
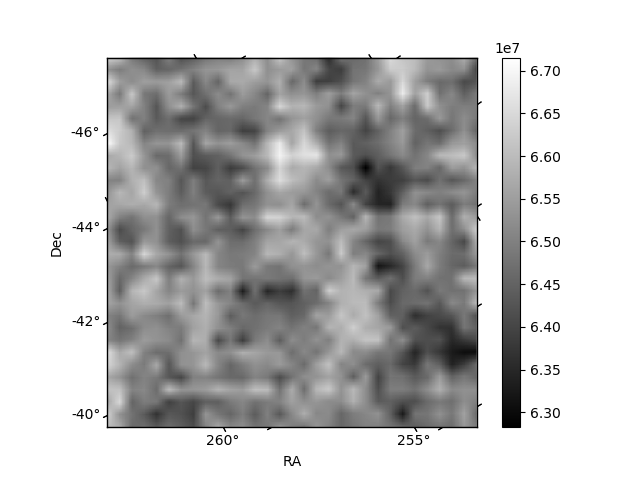
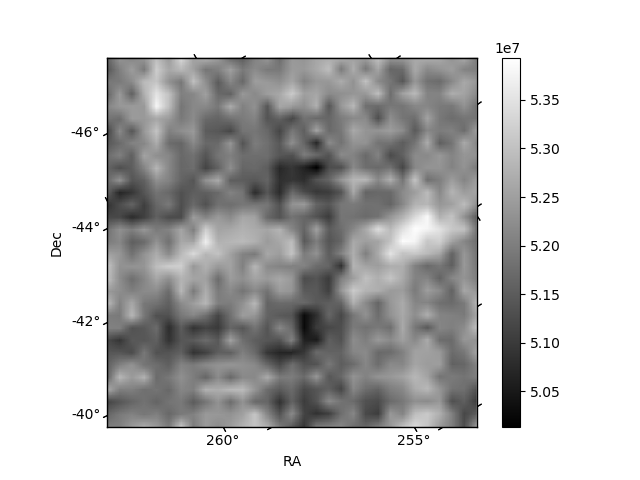
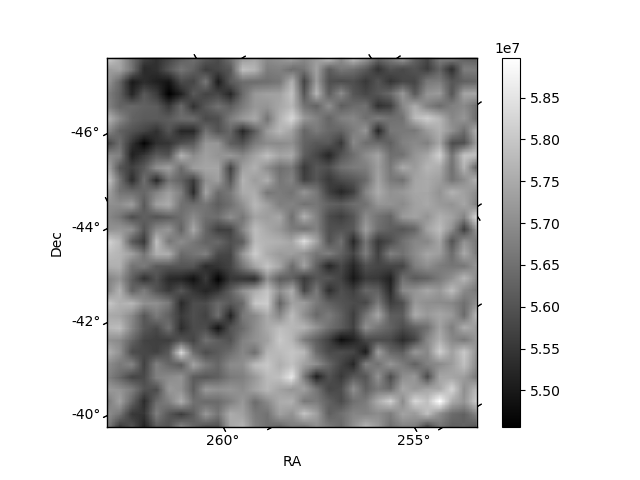
Histogram calculated using DETX and DETY for each event in the final _common_clean file
| Quadrant A |  |
 |
Quadrant B |
|---|---|---|---|
| Quadrant D |  |
 |
Quadrant C |
| Plot type | Count rate plots | Images |
|---|---|---|
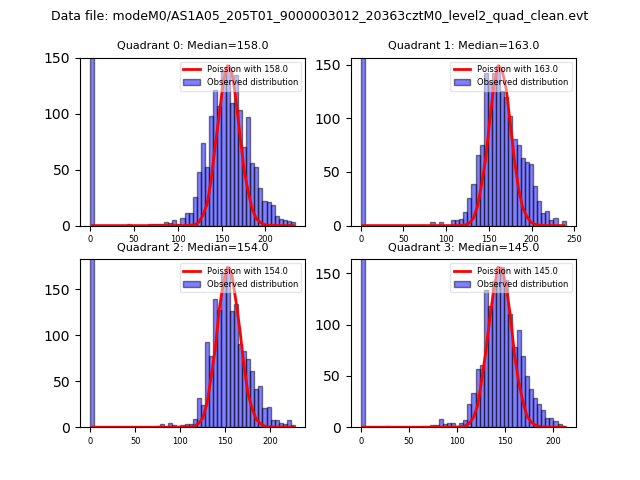
| Comparison with Poisson distribution Blue bars denote a histogram of data divided into 1 sec bins. Red curve is a Poisson curve with rate = median count rate of data. |
 |
 |
| Quadrant-wise count rates Data is divided into 100 sec bins |
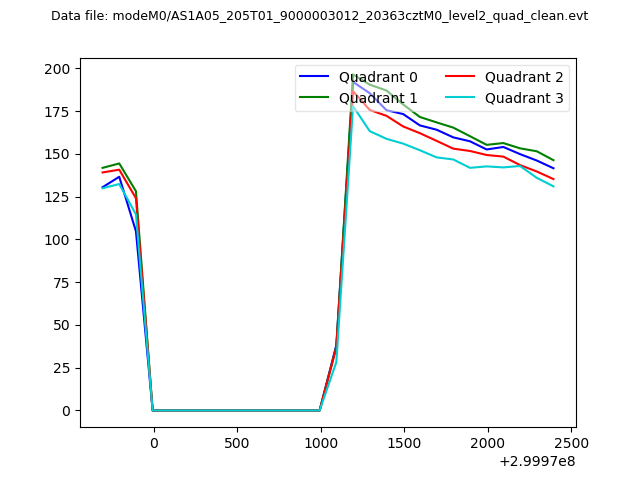 |
|
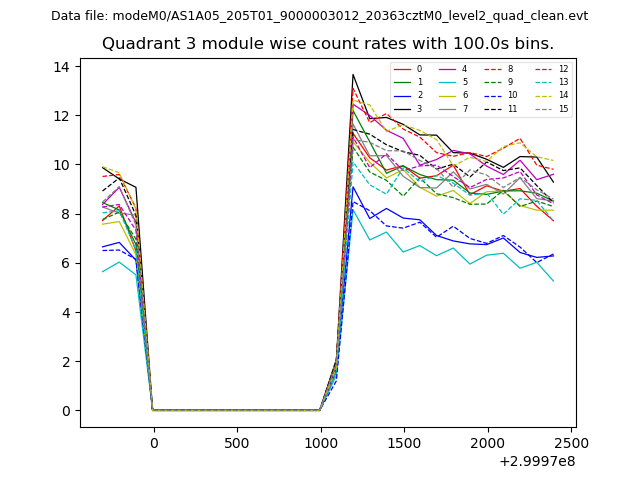
| Module-wise count rates for Quadrant A Data is divided into 100 sec bins |
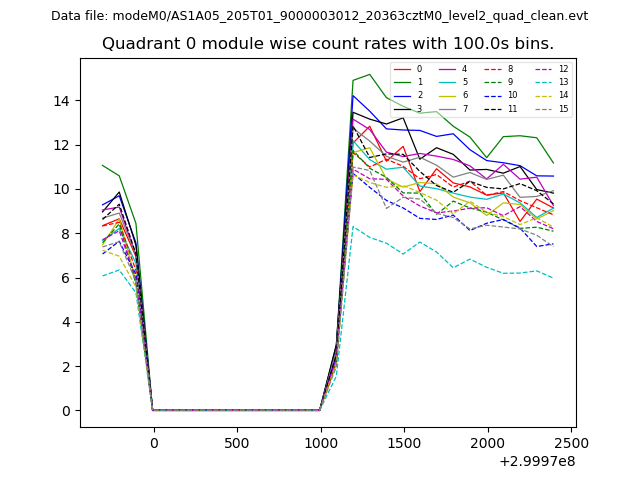 |
 |
| Module-wise count rates for Quadrant B Data is divided into 100 sec bins |
 |
 |
| Module-wise count rates for Quadrant C Data is divided into 100 sec bins |
 |
 |
| Module-wise count rates for Quadrant D Data is divided into 100 sec bins |
 |
 |
| Parameter | Plot |
|---|---|
| CZT HV Monitor | 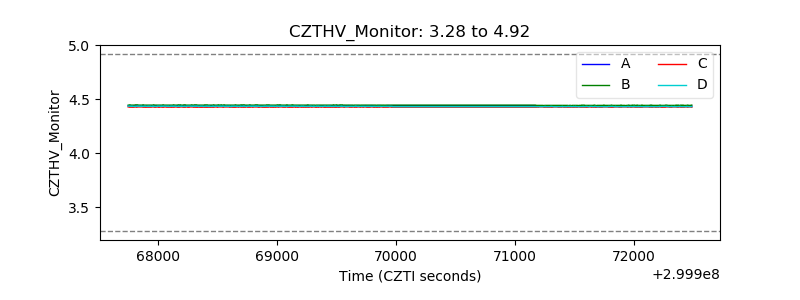 |
| D_VDD | 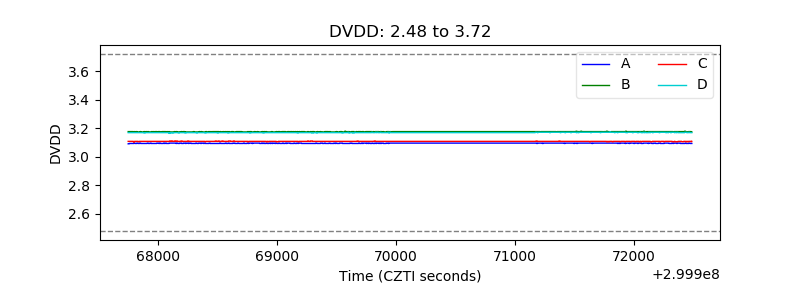 |
| Temperature 1 | 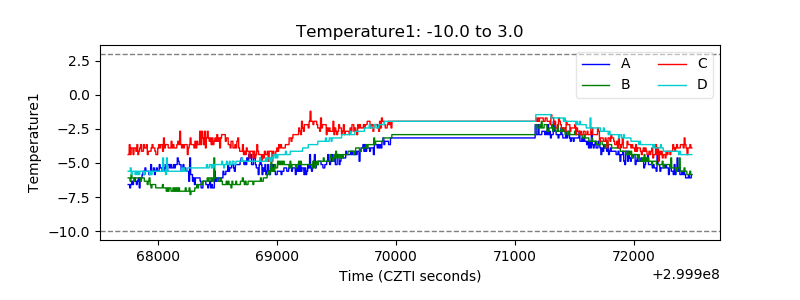 |
| Veto HV Monitor | 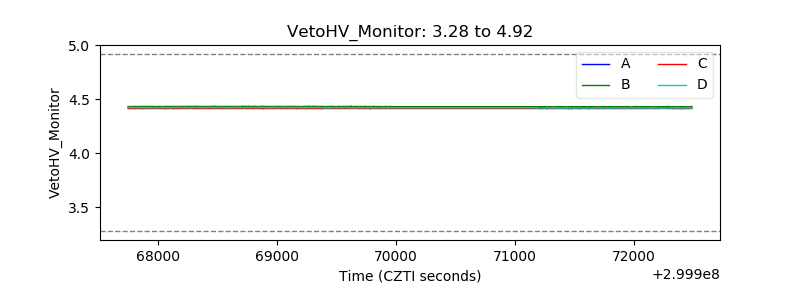 |
| Veto LLD | 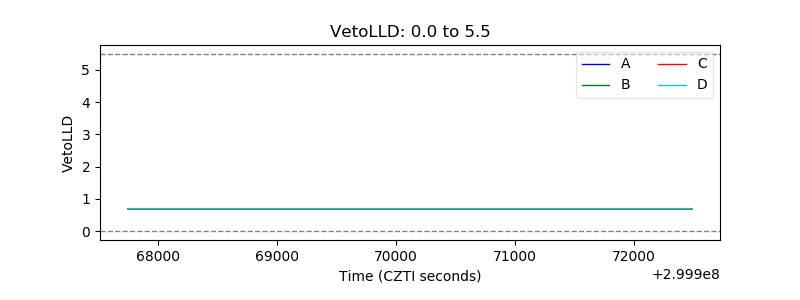 |
| Alpha Counter | 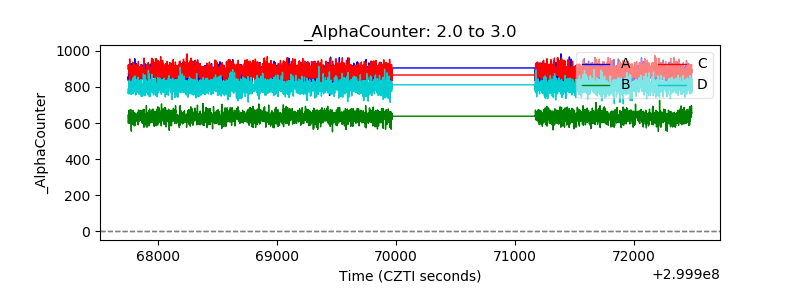 |
| _CPM_Rate | 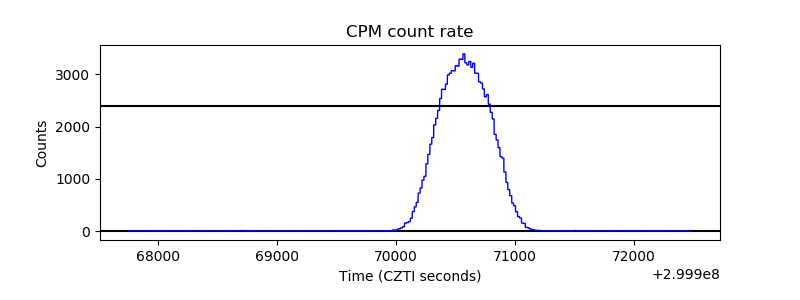 |
| CZT Counter | 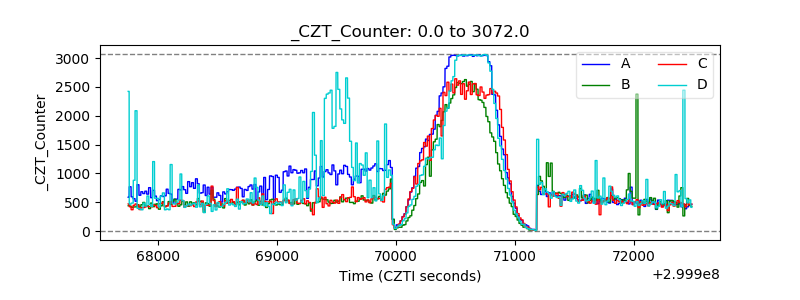 |
| +2.5 Volts monitor |  |
| +5 Volts monitor | 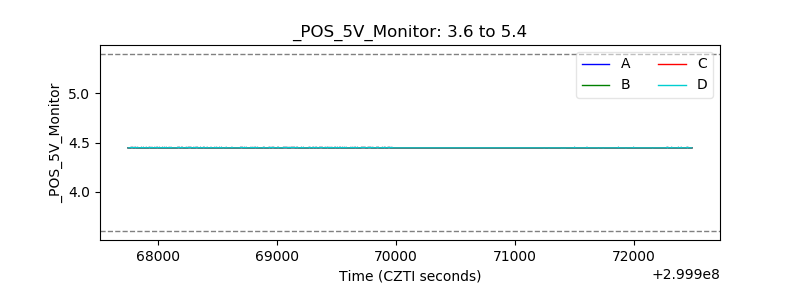 |
| _ROLL_ROT | 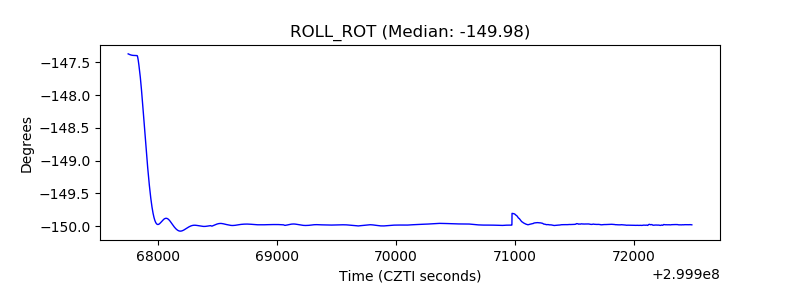 |
| _Roll_DEC | 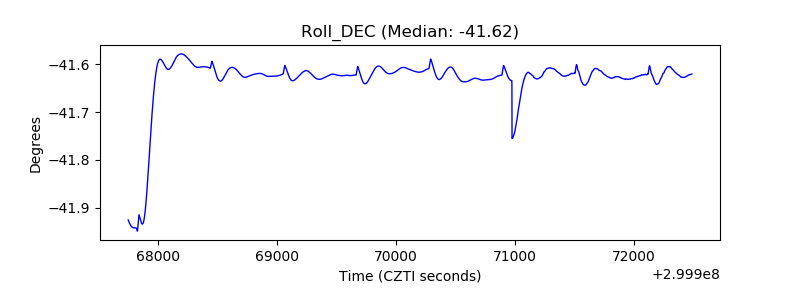 |
| _Roll_RA | 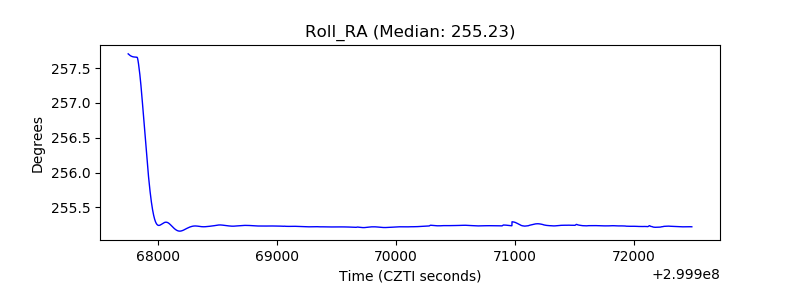 |
| Veto Counter | 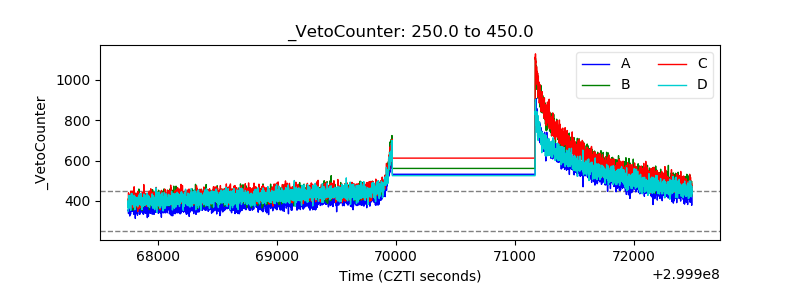 |