| Param | Original file | Final file |
|---|---|---|
| Filename | modeM0/AS1A05_205T01_9000003012_20364cztM0_level2.evt | modeM0/AS1A05_205T01_9000003012_20364cztM0_level2_quad_clean.evt |
| Size (bytes) | 455,374,080 | 95,212,800 |
| Size | 434.3 MB | 90.8 MB |
| Events in quadrant A | 3,393,314 | 609,610 |
| Events in quadrant B | 3,267,728 | 648,233 |
| Events in quadrant C | 3,107,658 | 612,887 |
| Events in quadrant D | 3,605,255 | 584,098 |
| Mode M9 | |||
|---|---|---|---|
| Quadrant | BADHDUFLAG | Total packets | Discarded packets |
| A | 0 | 18 | 0 |
| B | 0 | 19 | 0 |
| C | 0 | 19 | 0 |
| D | 0 | 19 | 0 |
| Mode SS | |||
|---|---|---|---|
| Quadrant | BADHDUFLAG | Total packets | Discarded packets |
| A | 0 | 126 | 0 |
| B | 0 | 126 | 0 |
| C | 0 | 126 | 0 |
| D | 0 | 126 | 0 |
| Mode M0 | |||
|---|---|---|---|
| Quadrant | BADHDUFLAG | Total packets | Discarded packets |
| A | 0 | 14074 | 2 |
| B | 0 | 13495 | 2 |
| C | 0 | 12990 | 3 |
| D | 0 | 14765 | 2 |
| Quadrant | Total seconds | Saturated seconds | Saturation percentage |
|---|---|---|---|
| A | 6136 | 328 | 5.345502% |
| B | 6136 | 63 | 1.026728% |
| C | 6135 | 59 | 0.961695% |
| D | 6135 | 75 | 1.222494% |
Noise dominated data is calculated using 1-second bins in cleaned event files. If a bin has >2000 counts, and if more than 50% of those come from <1% of pixels, then it is considered to be noise-dominated and hence unusable.
| Quadrant | # 1 sec bins | Bins with >0 counts | Bins with >2000 counts | High rate bins dominated by noise | Noise dominated (total time) | Noise dominated (detector-on time) | Marked lightcurve |
|---|---|---|---|---|---|---|---|
| A | 7451 | 6136 | 9 | 9 | 0.12% | 0.15% | 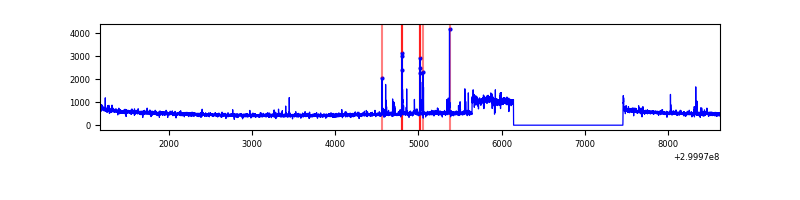 |
| B | 7451 | 6137 | 9 | 9 | 0.12% | 0.15% | 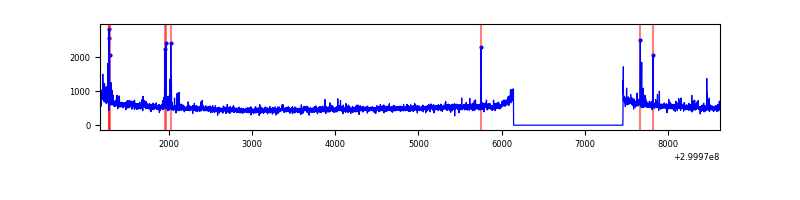 |
| C | 7450 | 6136 | 0 | 0 | 0.00% | 0.00% | 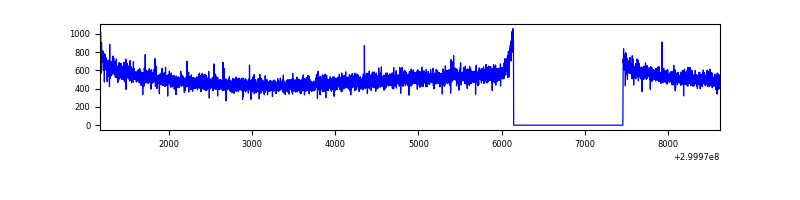 |
| D | 7450 | 6136 | 52 | 52 | 0.70% | 0.85% | 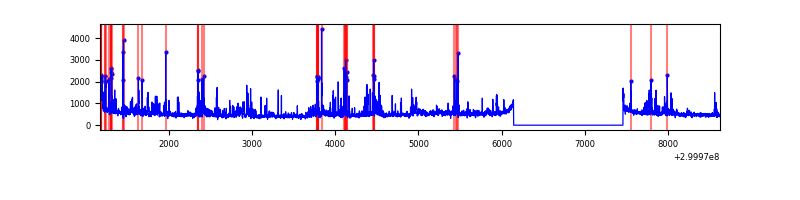 |
Top three noisy pixels from each quadrant. If the there are fewer than three noisy pixels in the level2.evt file, extra rows are filled as -1
| Pixel properties | Quadrant properties | ||||||
|---|---|---|---|---|---|---|---|
| Quadrant | DetID | PixID | Counts | Sigma | Mean | Median | Sigma |
| A | 14 | 111 | 306653 | 1979.64 | 774 | 762 | 154.5 |
| A | 12 | 96 | 101232 | 650.21 | 774 | 762 | 154.5 |
| A | 13 | 254 | 7869 | 45.99 | 774 | 762 | 154.5 |
| B | 7 | 220 | 30315 | 196.96 | 802 | 783 | 149.9 |
| B | 4 | 142 | 28328 | 183.7 | 802 | 783 | 149.9 |
| B | 0 | 197 | 21598 | 138.82 | 802 | 783 | 149.9 |
| C | 14 | 238 | 121068 | 674.57 | 764 | 772 | 178.3 |
| C | 13 | 61 | 5379 | 25.83 | 764 | 772 | 178.3 |
| C | 7 | 220 | 4586 | 21.39 | 764 | 772 | 178.3 |
| D | 1 | 52 | 674196 | 3659.78 | 760 | 738 | 184.0 |
| D | 2 | 234 | 26408 | 139.5 | 760 | 738 | 184.0 |
| D | 2 | 120 | 20870 | 109.4 | 760 | 738 | 184.0 |
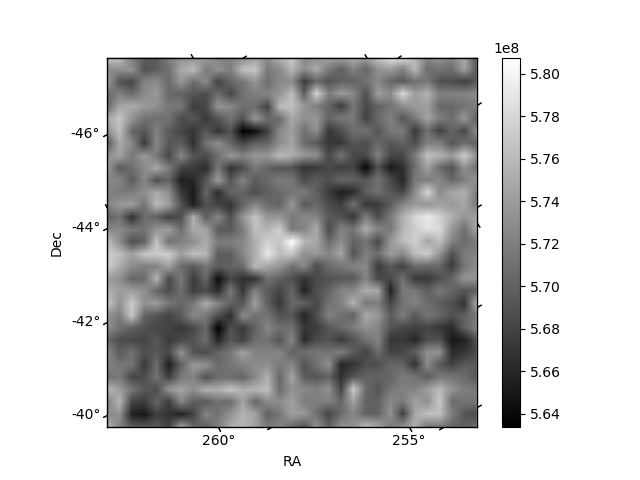
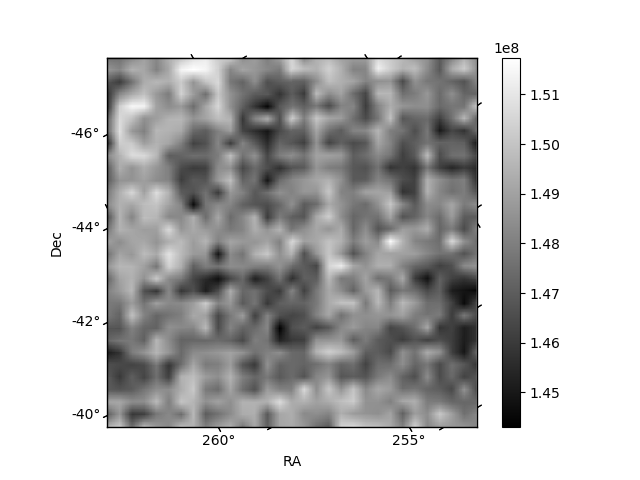
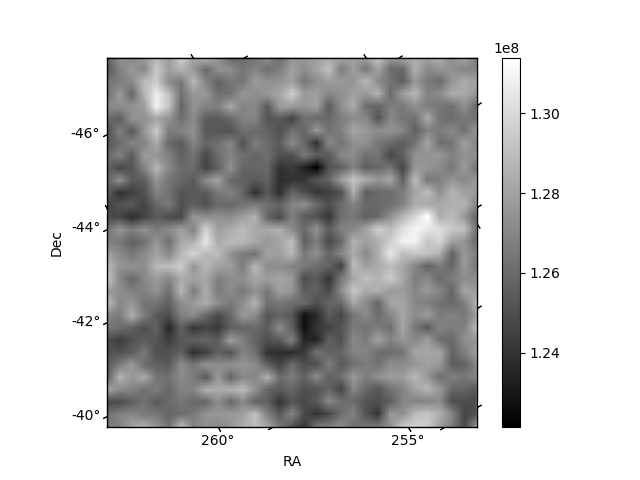
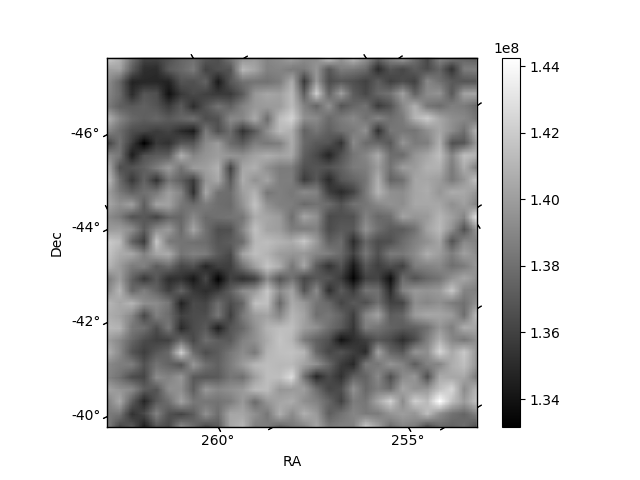
Histogram calculated using DETX and DETY for each event in the final _common_clean file
| Quadrant A | 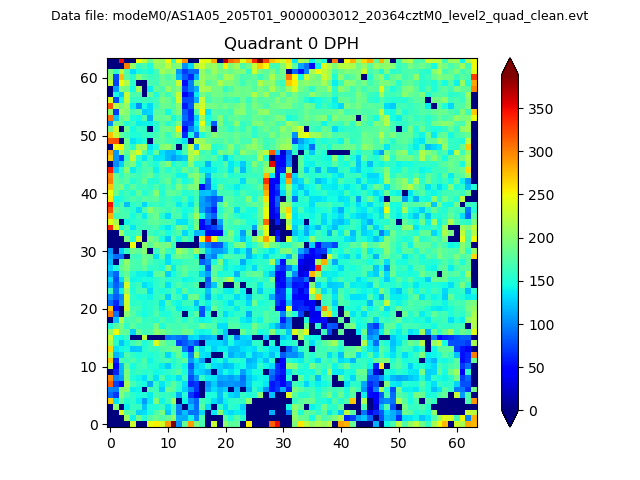 |
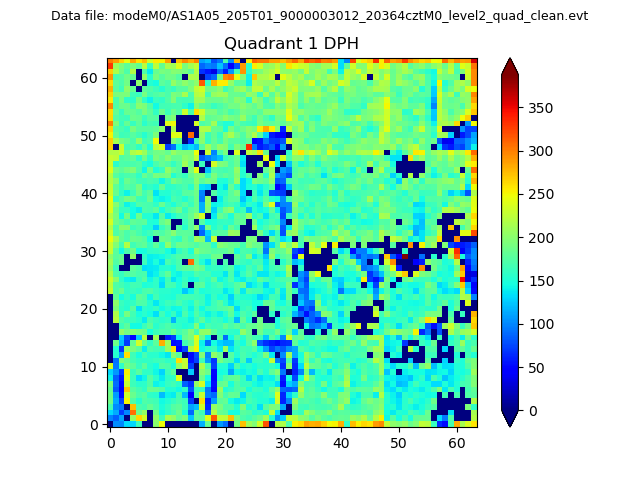 |
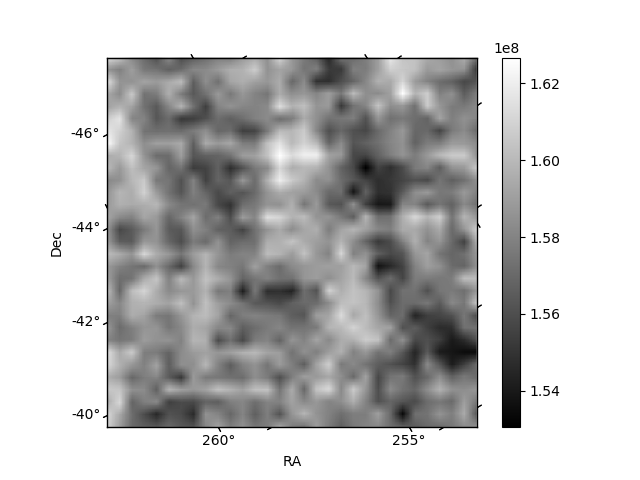
Quadrant B |
|---|---|---|---|
| Quadrant D | 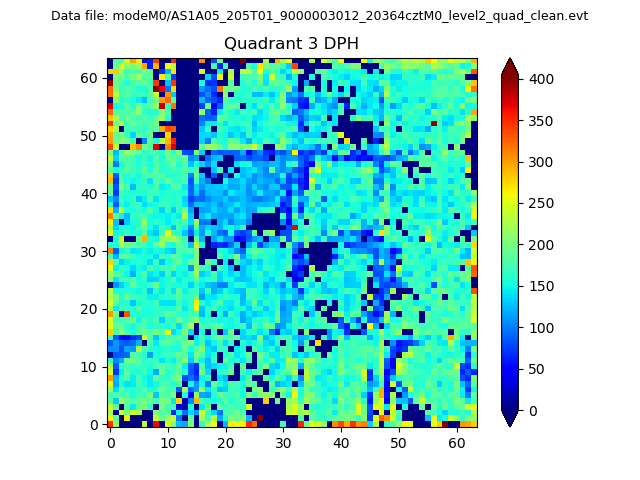 |
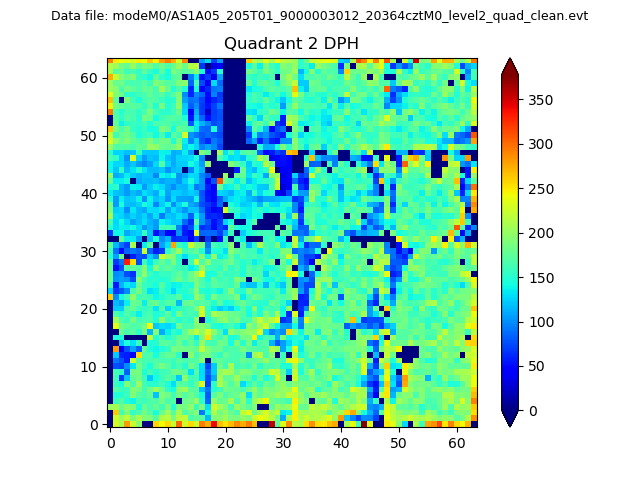 |
Quadrant C |
| Plot type | Count rate plots | Images |
|---|---|---|
| Comparison with Poisson distribution Blue bars denote a histogram of data divided into 1 sec bins. Red curve is a Poisson curve with rate = median count rate of data. |
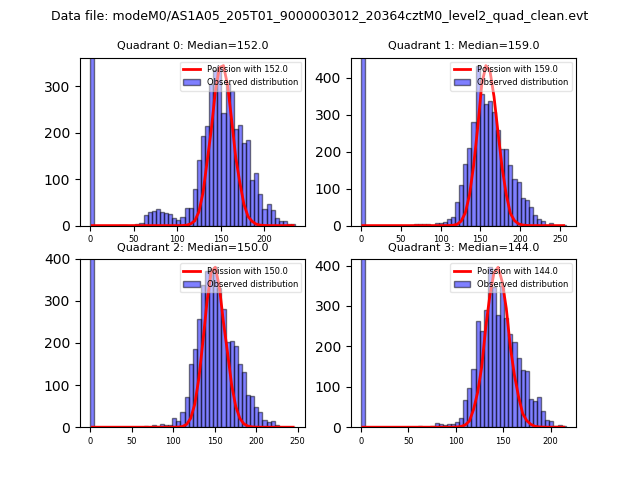 |
 |
| Quadrant-wise count rates Data is divided into 100 sec bins |
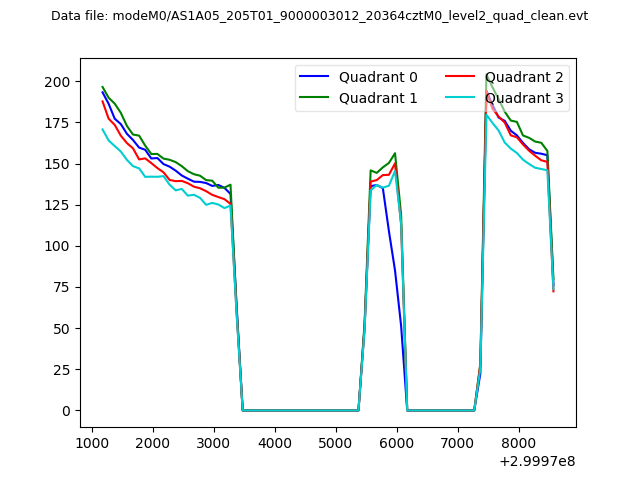 |
|
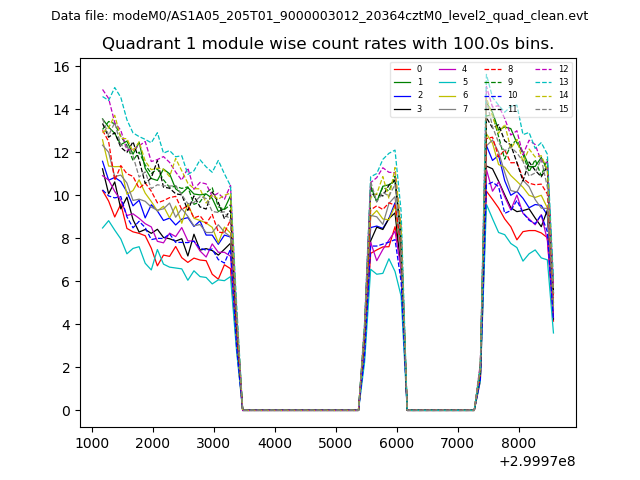
| Module-wise count rates for Quadrant A Data is divided into 100 sec bins |
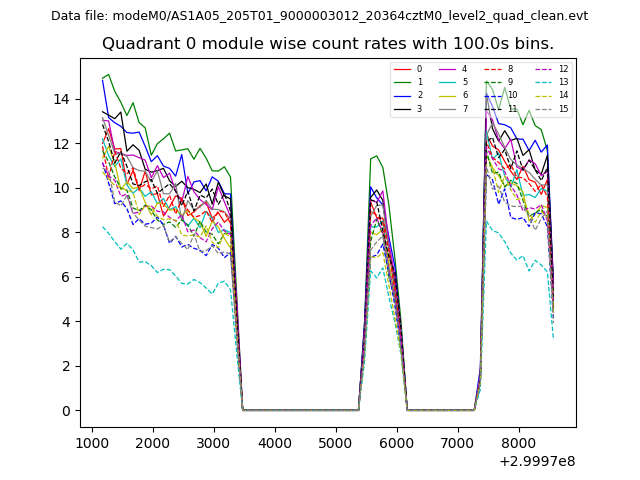 |
 |
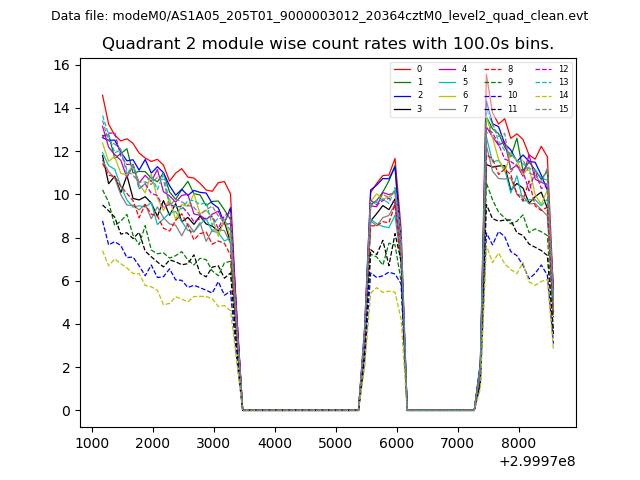
| Module-wise count rates for Quadrant B Data is divided into 100 sec bins |
 |
 |
| Module-wise count rates for Quadrant C Data is divided into 100 sec bins |
 |
 |
| Module-wise count rates for Quadrant D Data is divided into 100 sec bins |
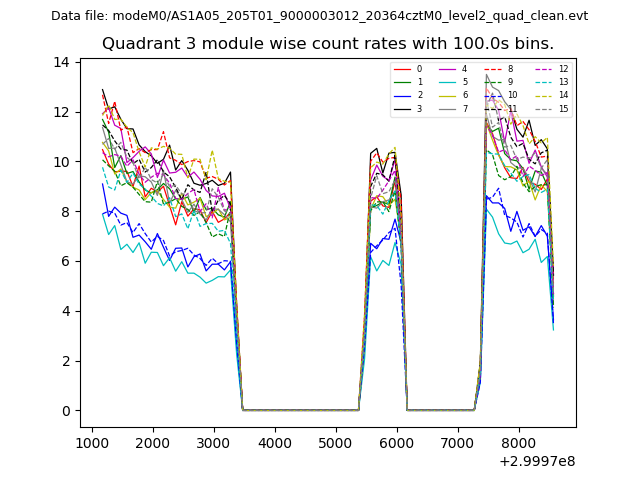 |
 |
| Parameter | Plot |
|---|---|
| CZT HV Monitor | 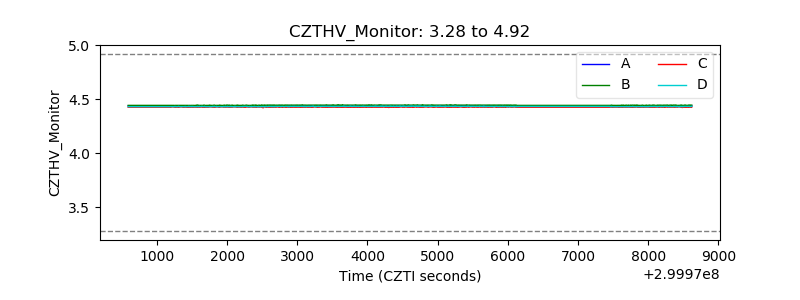 |
| D_VDD | 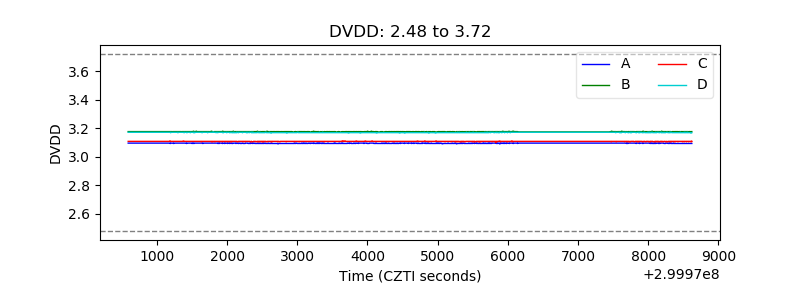 |
| Temperature 1 | 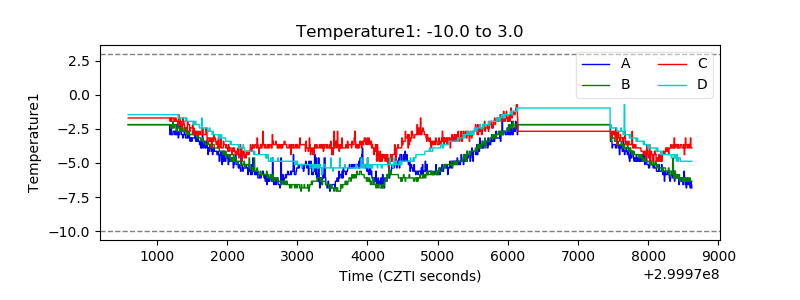 |
| Veto HV Monitor | 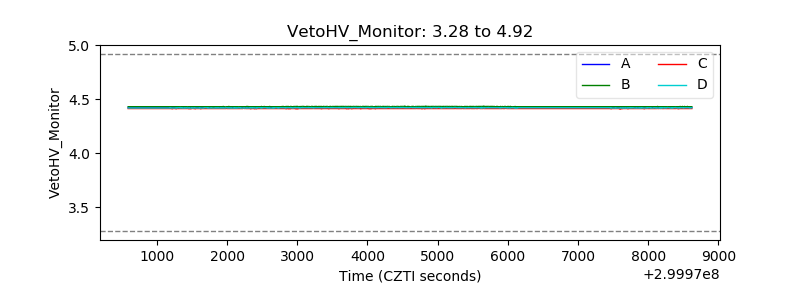 |
| Veto LLD | 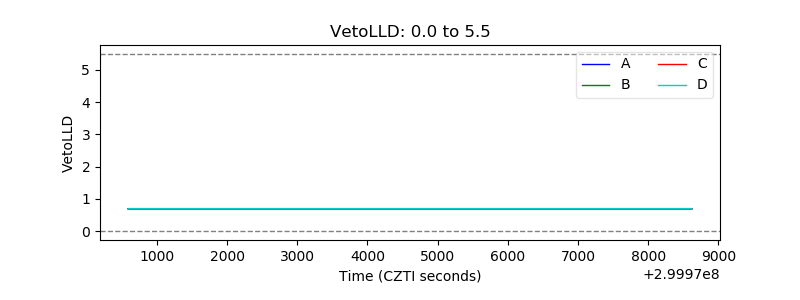 |
| Alpha Counter | 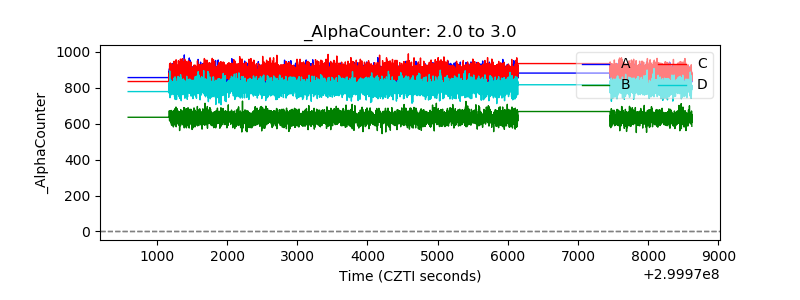 |
| _CPM_Rate | 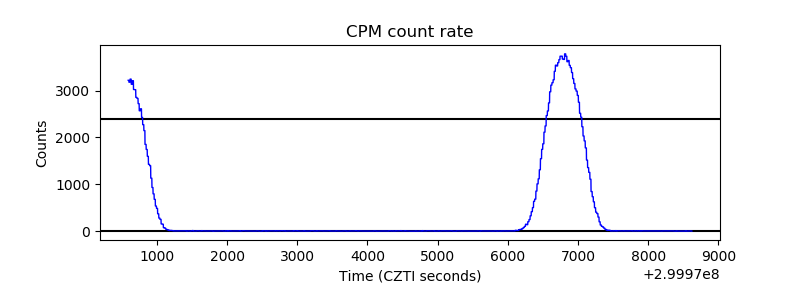 |
| CZT Counter | 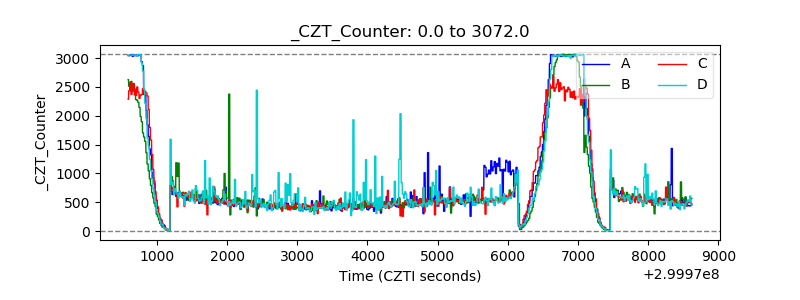 |
| +2.5 Volts monitor |  |
| +5 Volts monitor |  |
| _ROLL_ROT | 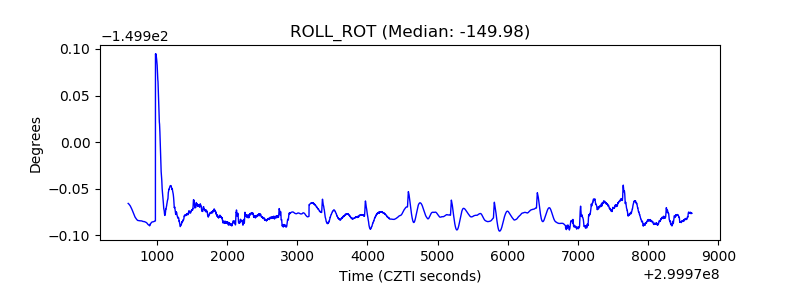 |
| _Roll_DEC | 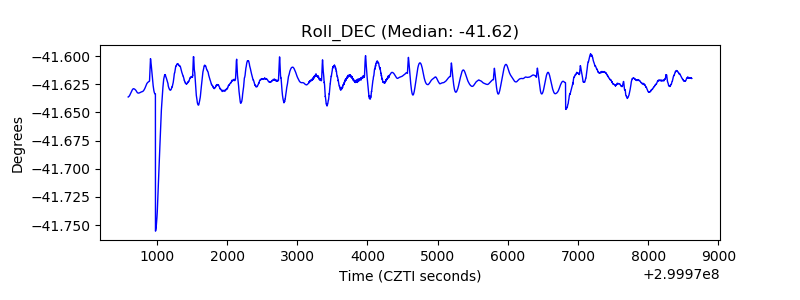 |
| _Roll_RA | 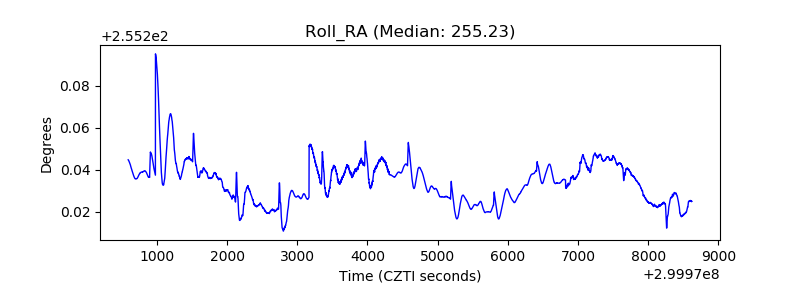 |
| Veto Counter | 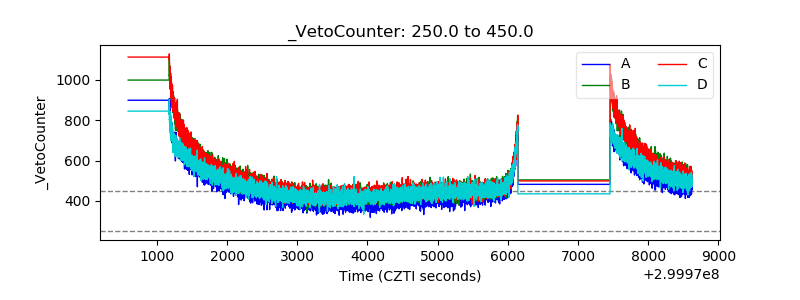 |