| Param | Original file | Final file |
|---|---|---|
| Filename | modeM0/AS1A05_205T01_9000003012_20368cztM0_level2.evt | modeM0/AS1A05_205T01_9000003012_20368cztM0_level2_quad_clean.evt |
| Size (bytes) | 493,747,200 | 78,609,600 |
| Size | 470.9 MB | 75.0 MB |
| Events in quadrant A | 3,243,714 | 486,488 |
| Events in quadrant B | 3,402,679 | 494,066 |
| Events in quadrant C | 3,276,344 | 476,796 |
| Events in quadrant D | 4,576,677 | 457,004 |
| Mode M9 | |||
|---|---|---|---|
| Quadrant | BADHDUFLAG | Total packets | Discarded packets |
| A | 0 | 12 | 0 |
| B | 0 | 13 | 0 |
| C | 0 | 13 | 0 |
| D | 0 | 13 | 0 |
| Mode SS | |||
|---|---|---|---|
| Quadrant | BADHDUFLAG | Total packets | Discarded packets |
| A | 0 | 136 | 0 |
| B | 0 | 136 | 0 |
| C | 0 | 136 | 0 |
| D | 0 | 136 | 0 |
| Mode M0 | |||
|---|---|---|---|
| Quadrant | BADHDUFLAG | Total packets | Discarded packets |
| A | 0 | 13836 | 2 |
| B | 0 | 14059 | 2 |
| C | 0 | 13737 | 2 |
| D | 0 | 18061 | 2 |
| Quadrant | Total seconds | Saturated seconds | Saturation percentage |
|---|---|---|---|
| A | 6681 | 64 | 0.957940% |
| B | 6681 | 93 | 1.392007% |
| C | 6681 | 104 | 1.556653% |
| D | 6681 | 352 | 5.268672% |
Noise dominated data is calculated using 1-second bins in cleaned event files. If a bin has >2000 counts, and if more than 50% of those come from <1% of pixels, then it is considered to be noise-dominated and hence unusable.
| Quadrant | # 1 sec bins | Bins with >0 counts | Bins with >2000 counts | High rate bins dominated by noise | Noise dominated (total time) | Noise dominated (detector-on time) | Marked lightcurve |
|---|---|---|---|---|---|---|---|
| A | 7571 | 6682 | 2 | 2 | 0.03% | 0.03% | 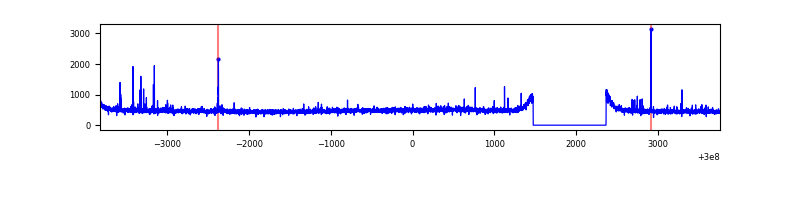 |
| B | 7571 | 6682 | 7 | 7 | 0.09% | 0.10% | 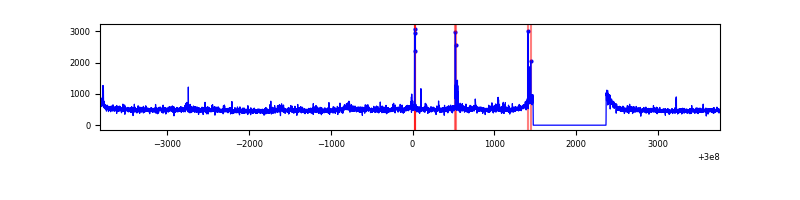 |
| C | 7571 | 6682 | 0 | 0 | 0.00% | 0.00% | 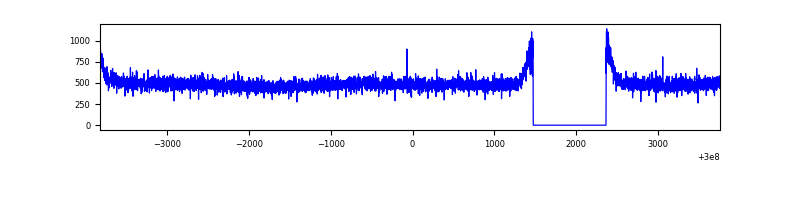 |
| D | 7571 | 6682 | 246 | 246 | 3.25% | 3.68% | 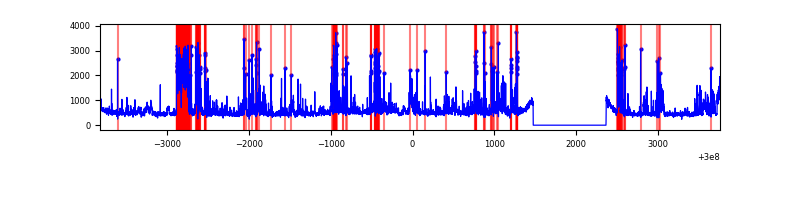 |
Top three noisy pixels from each quadrant. If the there are fewer than three noisy pixels in the level2.evt file, extra rows are filled as -1
| Pixel properties | Quadrant properties | ||||||
|---|---|---|---|---|---|---|---|
| Quadrant | DetID | PixID | Counts | Sigma | Mean | Median | Sigma |
| A | 12 | 96 | 51594 | 303.56 | 827 | 810 | 167.3 |
| A | 3 | 1 | 7609 | 40.64 | 827 | 810 | 167.3 |
| A | 0 | 226 | 7070 | 37.42 | 827 | 810 | 167.3 |
| B | 0 | 198 | 69902 | 437.06 | 829 | 807 | 158.1 |
| B | 4 | 80 | 23862 | 145.83 | 829 | 807 | 158.1 |
| B | 0 | 197 | 22587 | 137.77 | 829 | 807 | 158.1 |
| C | 14 | 238 | 125606 | 669.06 | 802 | 809 | 186.5 |
| C | 1 | 16 | 11136 | 55.37 | 802 | 809 | 186.5 |
| C | 10 | 91 | 7137 | 33.93 | 802 | 809 | 186.5 |
| D | 1 | 52 | 1427753 | 7353.52 | 796 | 774 | 194.1 |
| D | 2 | 120 | 46643 | 236.37 | 796 | 774 | 194.1 |
| D | 2 | 184 | 39555 | 199.85 | 796 | 774 | 194.1 |
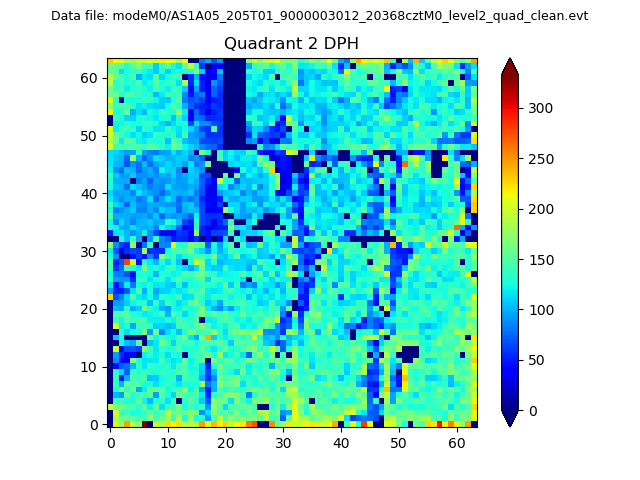
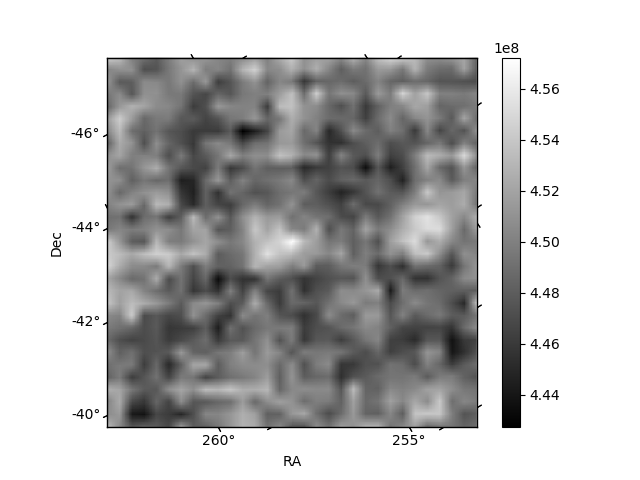
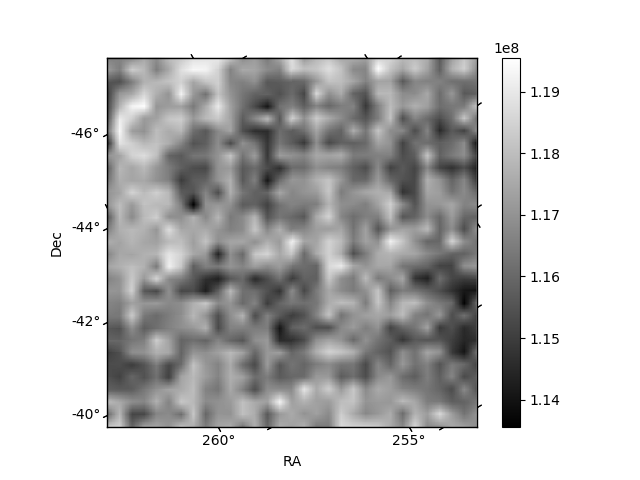
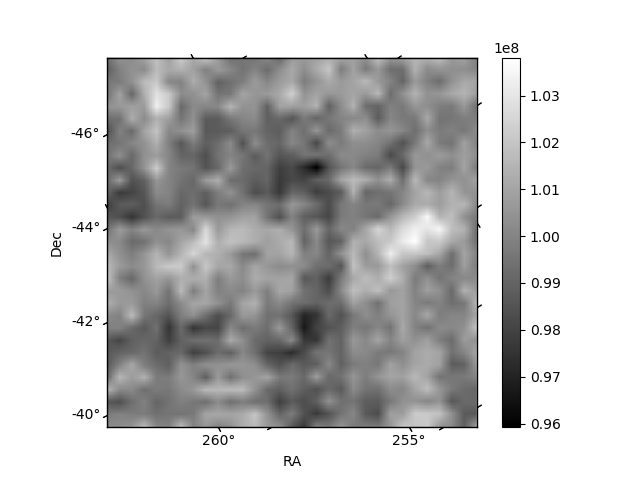
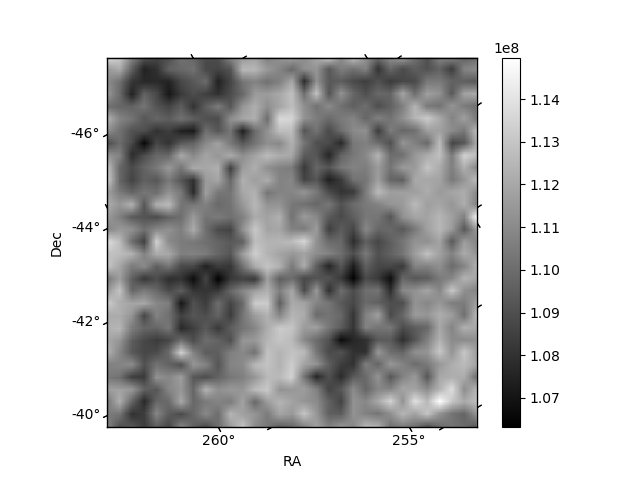
Histogram calculated using DETX and DETY for each event in the final _common_clean file
| Quadrant A | 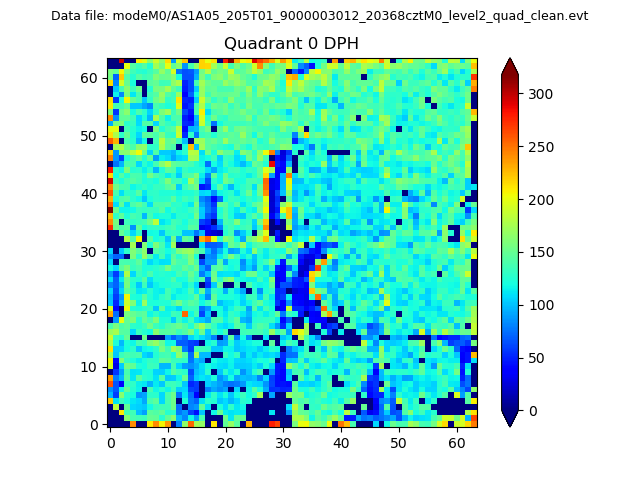 |
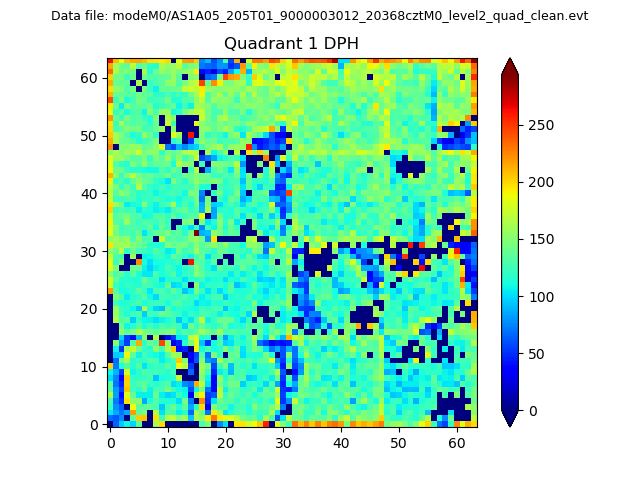 |
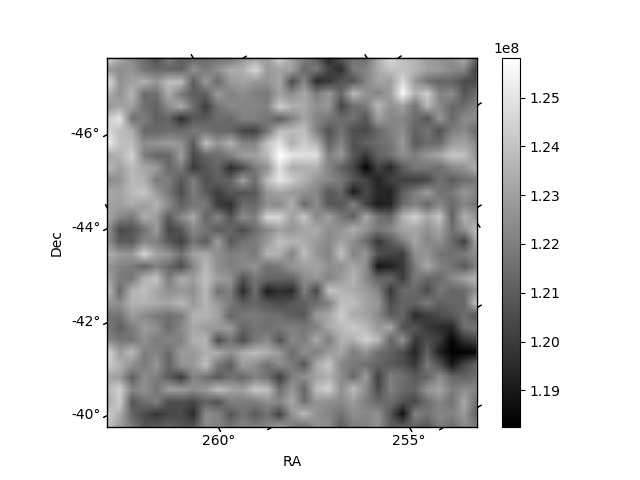
Quadrant B |
|---|---|---|---|
| Quadrant D | 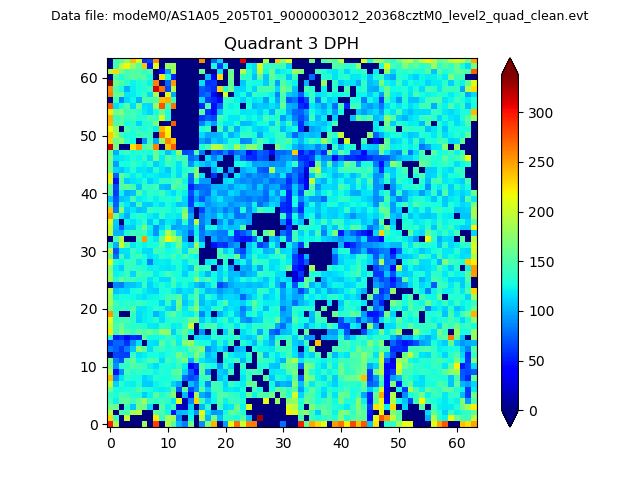 |
 |
Quadrant C |
| Plot type | Count rate plots | Images |
|---|---|---|
| Comparison with Poisson distribution Blue bars denote a histogram of data divided into 1 sec bins. Red curve is a Poisson curve with rate = median count rate of data. |
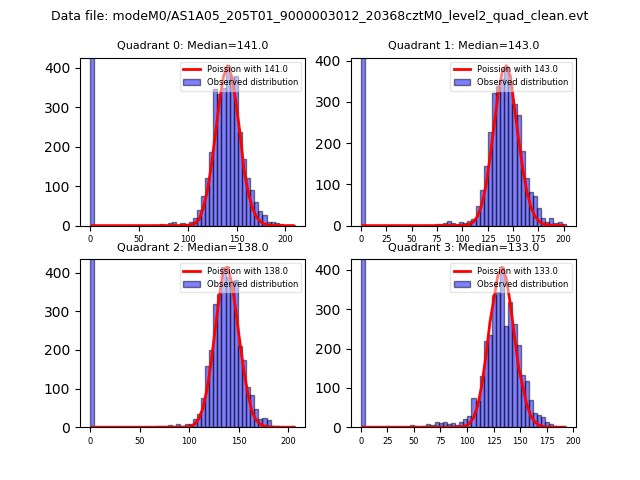 |
 |
| Quadrant-wise count rates Data is divided into 100 sec bins |
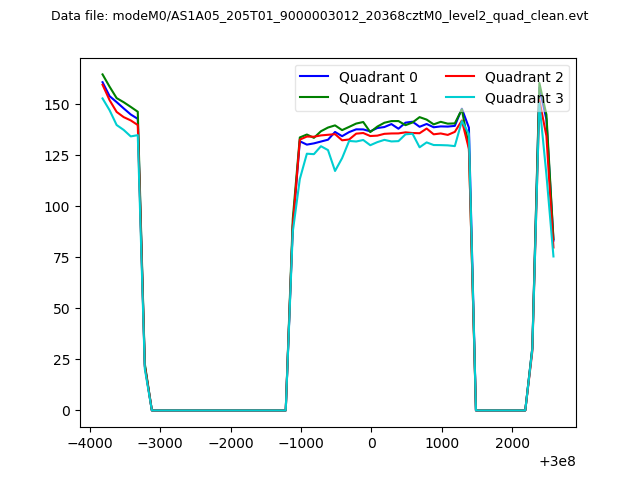 |
|
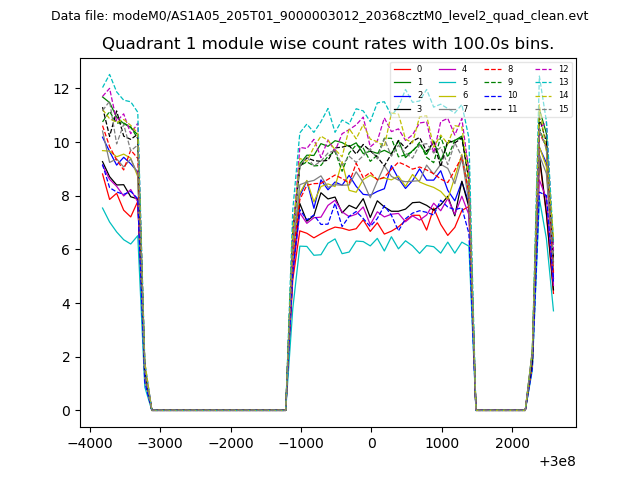
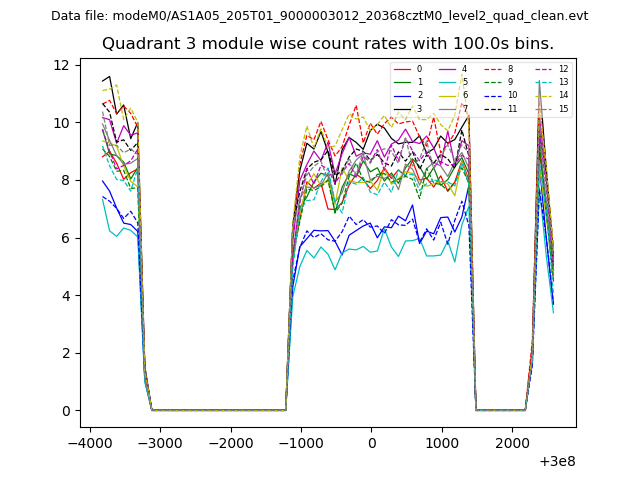
| Module-wise count rates for Quadrant A Data is divided into 100 sec bins |
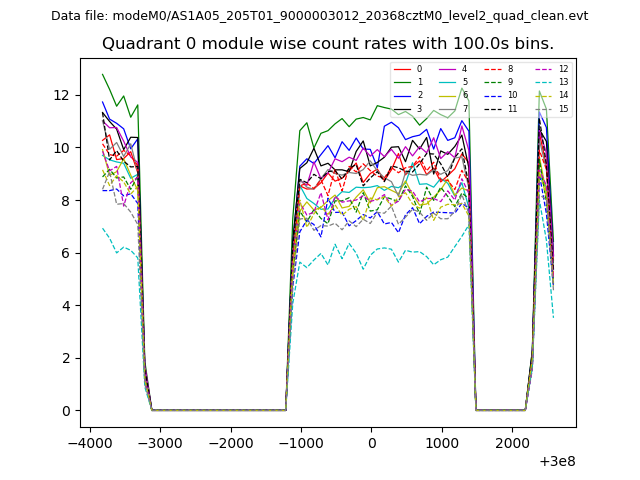 |
 |
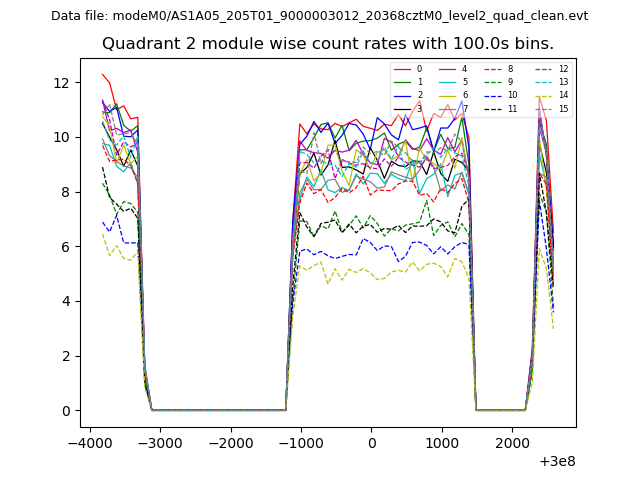
| Module-wise count rates for Quadrant B Data is divided into 100 sec bins |
 |
 |
| Module-wise count rates for Quadrant C Data is divided into 100 sec bins |
 |
 |
| Module-wise count rates for Quadrant D Data is divided into 100 sec bins |
 |
 |
| Parameter | Plot |
|---|---|
| CZT HV Monitor | 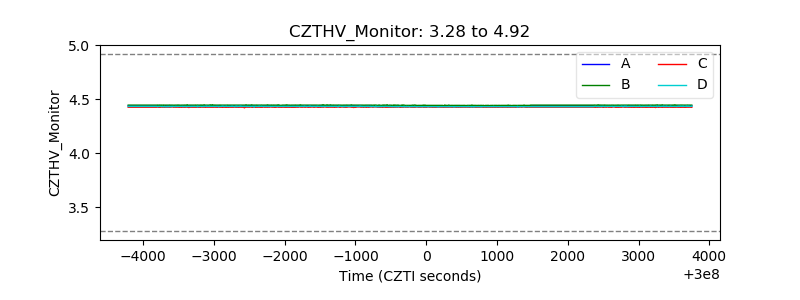 |
| D_VDD | 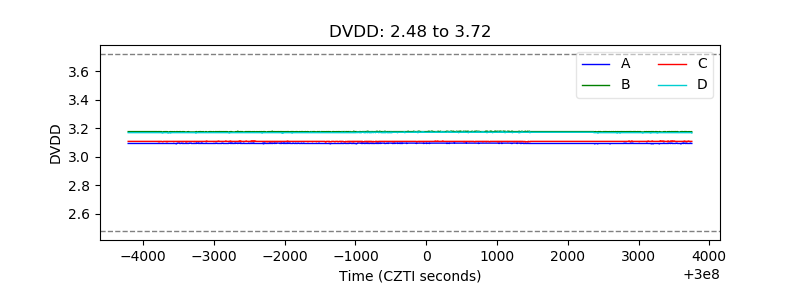 |
| Temperature 1 | 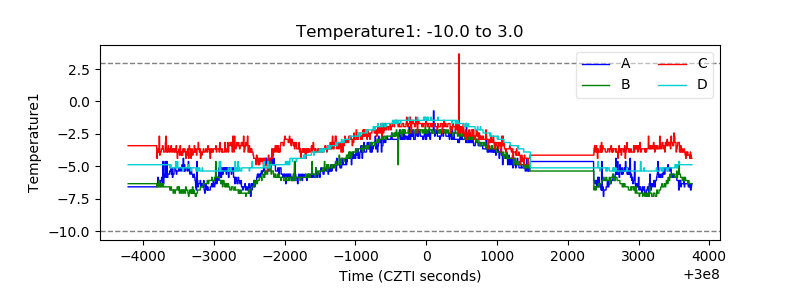 |
| Veto HV Monitor | 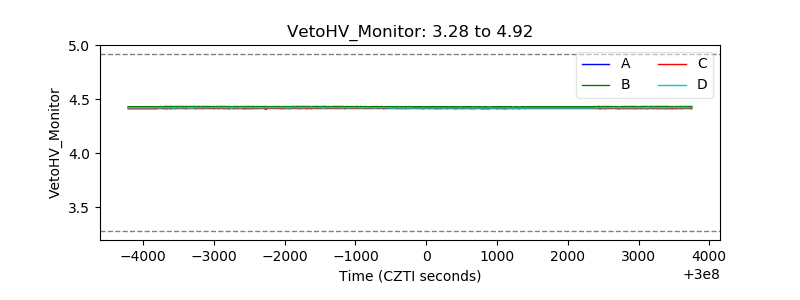 |
| Veto LLD | 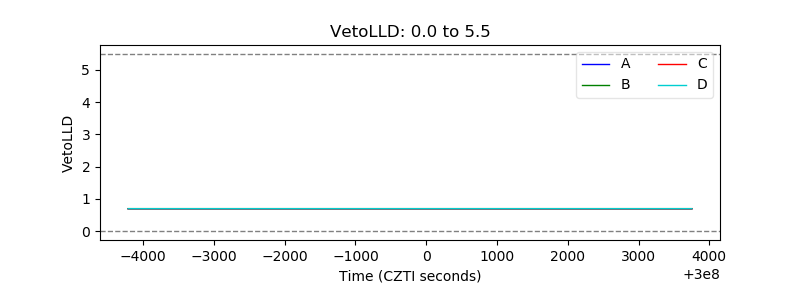 |
| Alpha Counter | 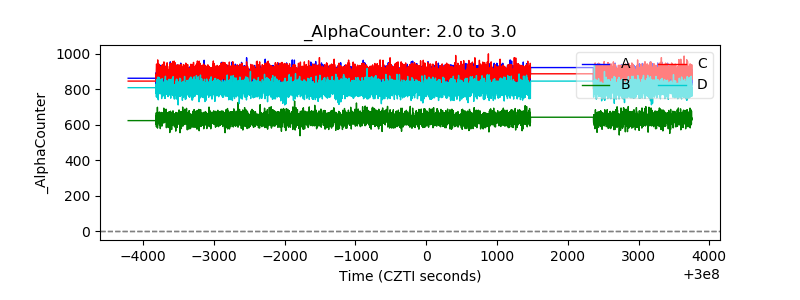 |
| _CPM_Rate | 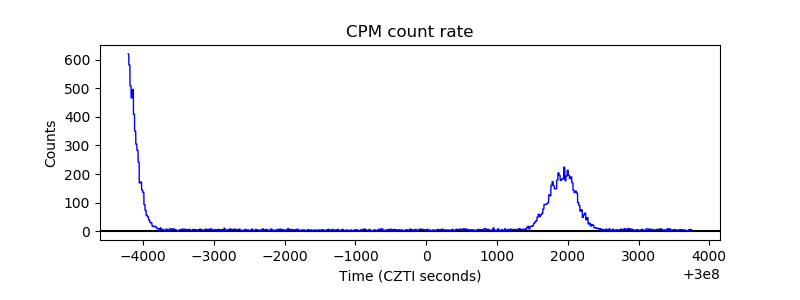 |
| CZT Counter | 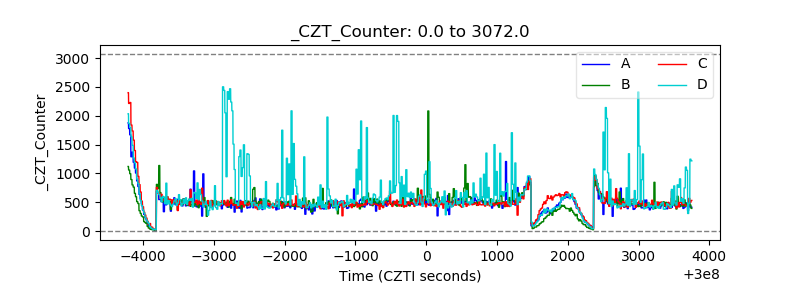 |
| +2.5 Volts monitor |  |
| +5 Volts monitor |  |
| _ROLL_ROT | 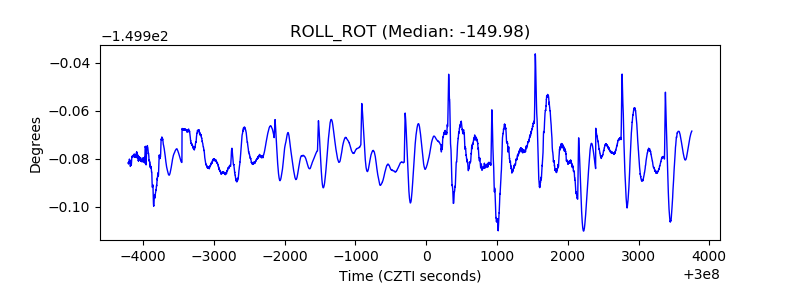 |
| _Roll_DEC | 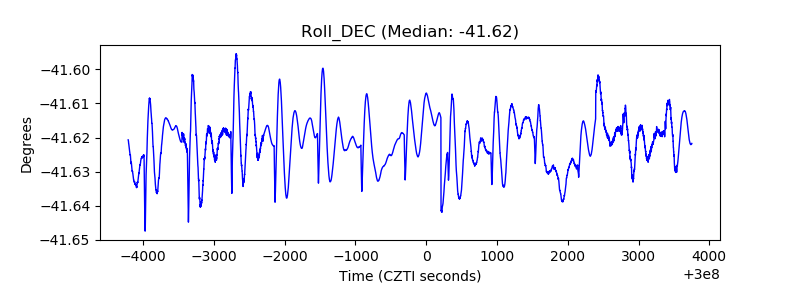 |
| _Roll_RA | 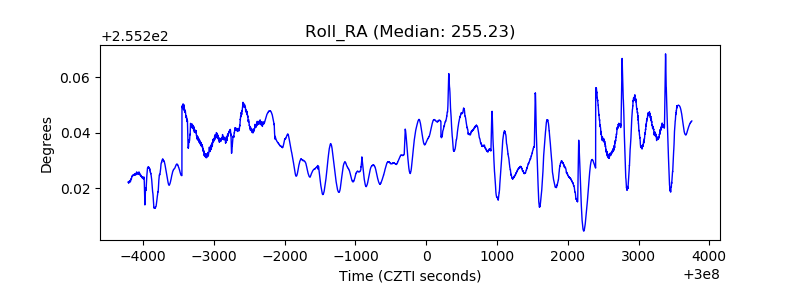 |
| Veto Counter | 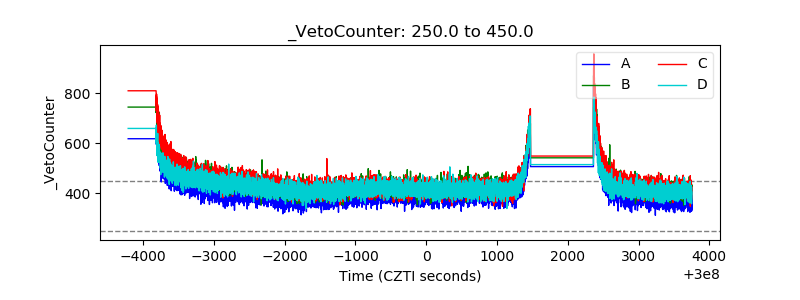 |