| Param | Original file | Final file |
|---|---|---|
| Filename | modeM0/AS1A05_205T01_9000003012_20369cztM0_level2.evt | modeM0/AS1A05_205T01_9000003012_20369cztM0_level2_quad_clean.evt |
| Size (bytes) | 539,331,840 | 88,922,880 |
| Size | 514.3 MB | 84.8 MB |
| Events in quadrant A | 3,649,173 | 552,623 |
| Events in quadrant B | 3,983,725 | 554,806 |
| Events in quadrant C | 3,708,413 | 537,164 |
| Events in quadrant D | 4,481,967 | 524,648 |
| Mode M9 | |||
|---|---|---|---|
| Quadrant | BADHDUFLAG | Total packets | Discarded packets |
| A | 0 | 14 | 0 |
| B | 0 | 14 | 0 |
| C | 0 | 14 | 0 |
| D | 0 | 14 | 0 |
| Mode SS | |||
|---|---|---|---|
| Quadrant | BADHDUFLAG | Total packets | Discarded packets |
| A | 0 | 154 | 0 |
| B | 0 | 154 | 0 |
| C | 0 | 154 | 0 |
| D | 0 | 154 | 0 |
| Mode M0 | |||
|---|---|---|---|
| Quadrant | BADHDUFLAG | Total packets | Discarded packets |
| A | 0 | 15771 | 2 |
| B | 0 | 16533 | 2 |
| C | 0 | 15708 | 2 |
| D | 0 | 18437 | 2 |
| Quadrant | Total seconds | Saturated seconds | Saturation percentage |
|---|---|---|---|
| A | 7520 | 153 | 2.034574% |
| B | 7521 | 250 | 3.324026% |
| C | 7520 | 230 | 3.058511% |
| D | 7520 | 203 | 2.699468% |
Noise dominated data is calculated using 1-second bins in cleaned event files. If a bin has >2000 counts, and if more than 50% of those come from <1% of pixels, then it is considered to be noise-dominated and hence unusable.
| Quadrant | # 1 sec bins | Bins with >0 counts | Bins with >2000 counts | High rate bins dominated by noise | Noise dominated (total time) | Noise dominated (detector-on time) | Marked lightcurve |
|---|---|---|---|---|---|---|---|
| A | 8880 | 7522 | 2 | 2 | 0.02% | 0.03% | 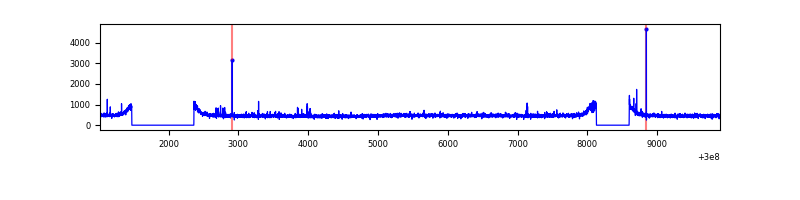 |
| B | 8881 | 7523 | 42 | 42 | 0.47% | 0.56% | 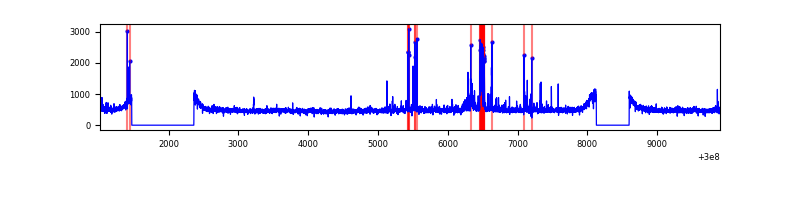 |
| C | 8880 | 7522 | 0 | 0 | 0.00% | 0.00% | 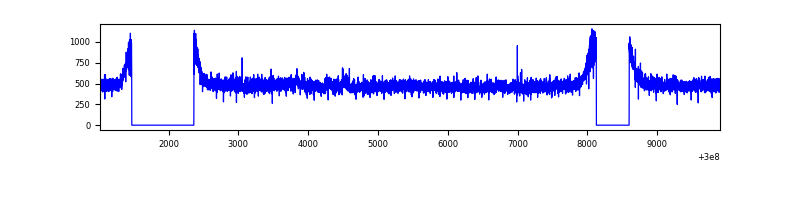 |
| D | 8880 | 7522 | 65 | 65 | 0.73% | 0.86% | 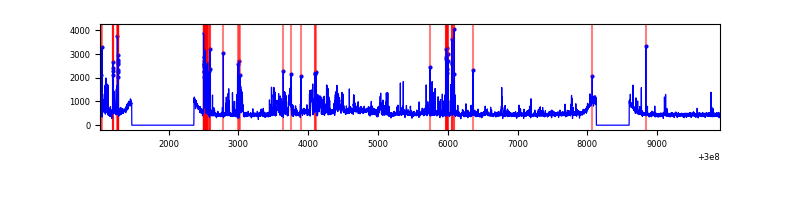 |
Top three noisy pixels from each quadrant. If the there are fewer than three noisy pixels in the level2.evt file, extra rows are filled as -1
| Pixel properties | Quadrant properties | ||||||
|---|---|---|---|---|---|---|---|
| Quadrant | DetID | PixID | Counts | Sigma | Mean | Median | Sigma |
| A | 12 | 96 | 42739 | 221.71 | 936 | 916 | 188.6 |
| A | 0 | 226 | 8140 | 38.3 | 936 | 916 | 188.6 |
| A | 3 | 137 | 7677 | 35.84 | 936 | 916 | 188.6 |
| B | 10 | 247 | 114258 | 627.69 | 934 | 911 | 180.6 |
| B | 7 | 220 | 66095 | 360.98 | 934 | 911 | 180.6 |
| B | 0 | 197 | 65986 | 360.37 | 934 | 911 | 180.6 |
| C | 14 | 238 | 139527 | 650.69 | 904 | 909 | 213.0 |
| C | 10 | 91 | 34114 | 155.87 | 904 | 909 | 213.0 |
| C | 3 | 233 | 8297 | 34.68 | 904 | 909 | 213.0 |
| D | 1 | 52 | 985592 | 4374.22 | 912 | 883 | 225.1 |
| D | 2 | 234 | 34411 | 148.94 | 912 | 883 | 225.1 |
| D | 2 | 120 | 24612 | 105.41 | 912 | 883 | 225.1 |
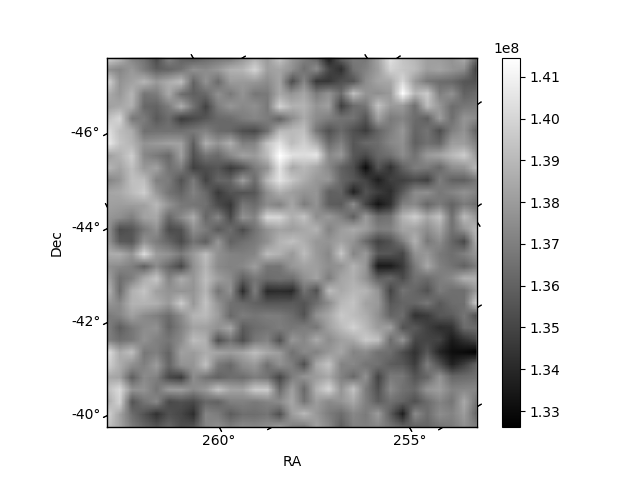
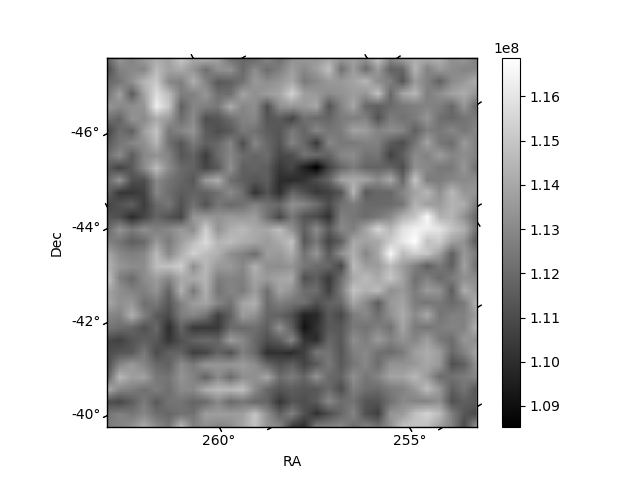
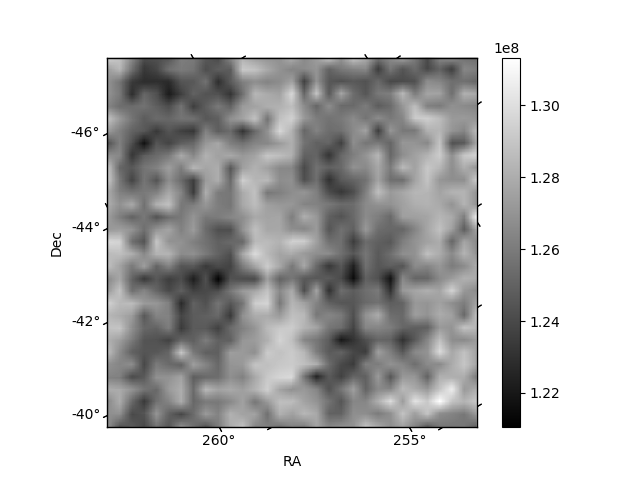
Histogram calculated using DETX and DETY for each event in the final _common_clean file
| Quadrant A | 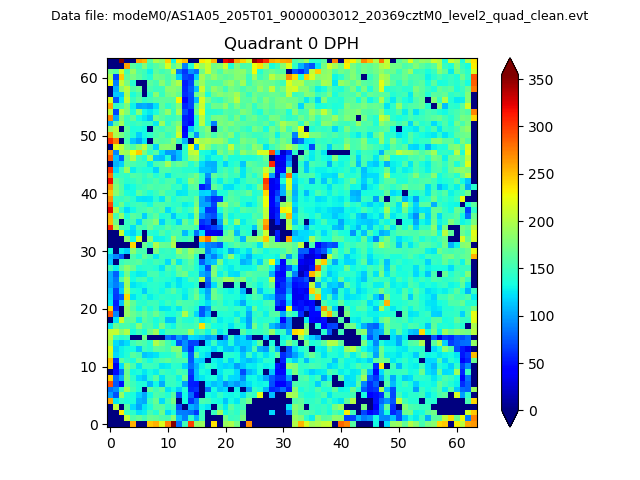 |
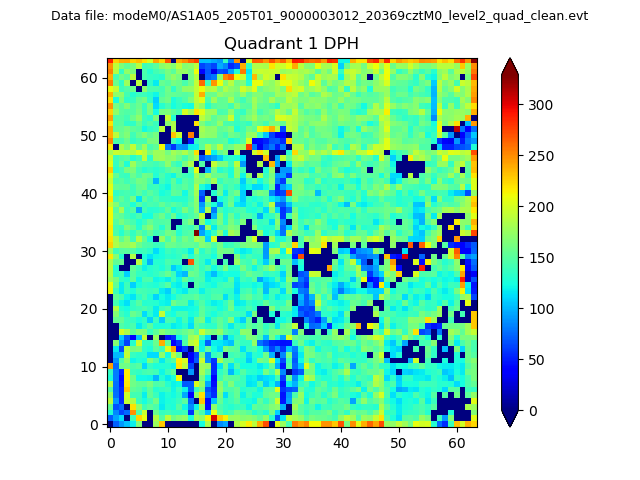 |
Quadrant B |
|---|---|---|---|
| Quadrant D | 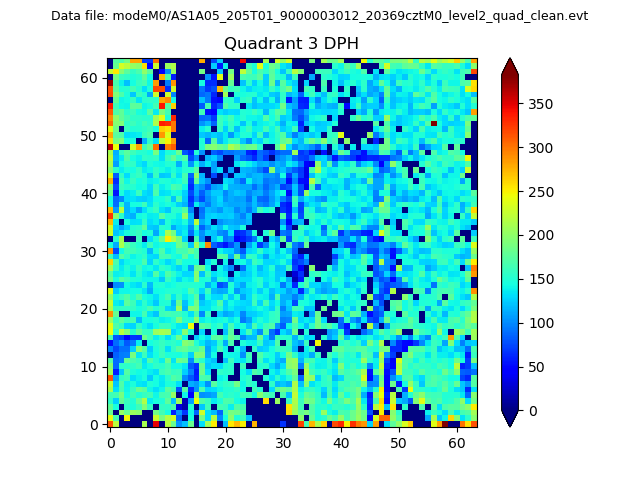 |
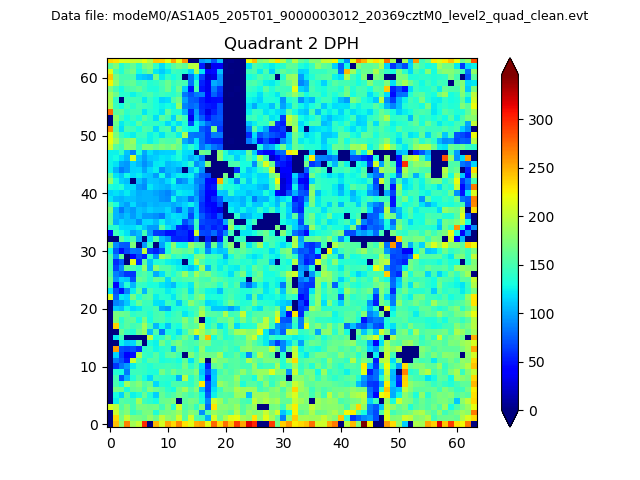 |
Quadrant C |
| Plot type | Count rate plots | Images |
|---|---|---|
| Comparison with Poisson distribution Blue bars denote a histogram of data divided into 1 sec bins. Red curve is a Poisson curve with rate = median count rate of data. |
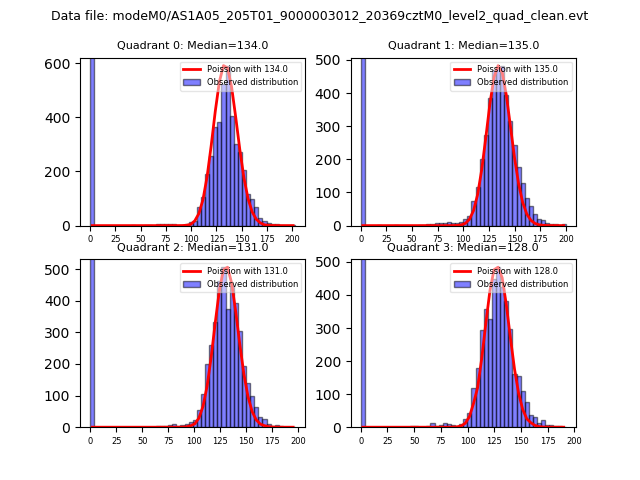 |
 |
| Quadrant-wise count rates Data is divided into 100 sec bins |
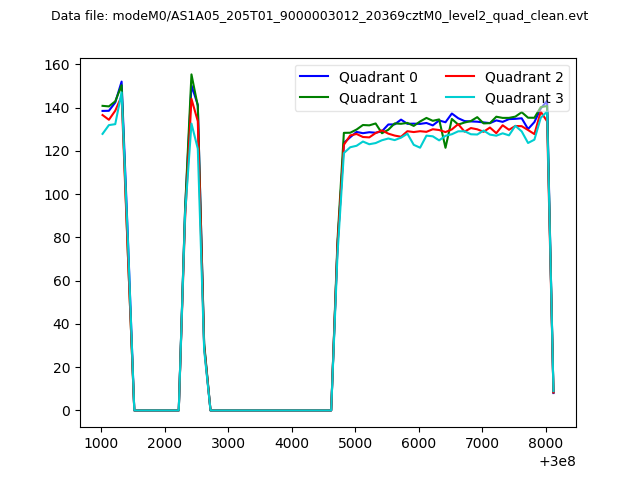 |
|
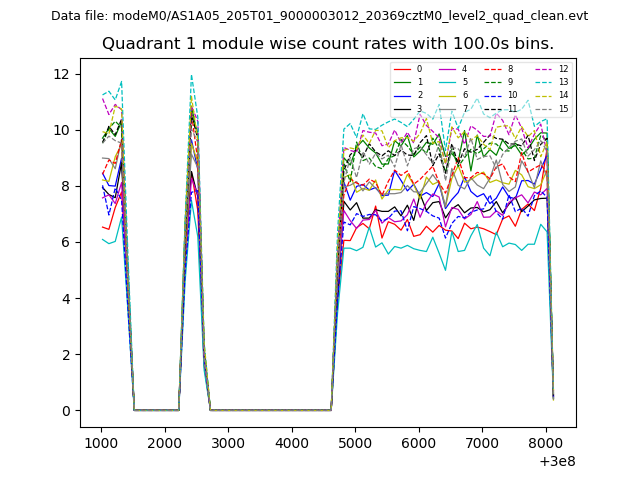
| Module-wise count rates for Quadrant A Data is divided into 100 sec bins |
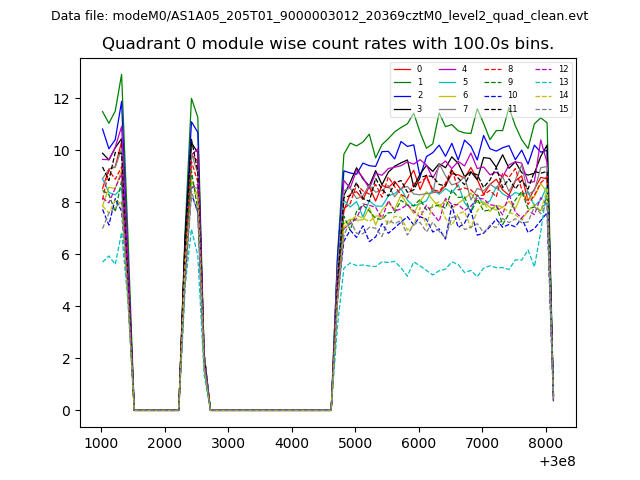 |
 |
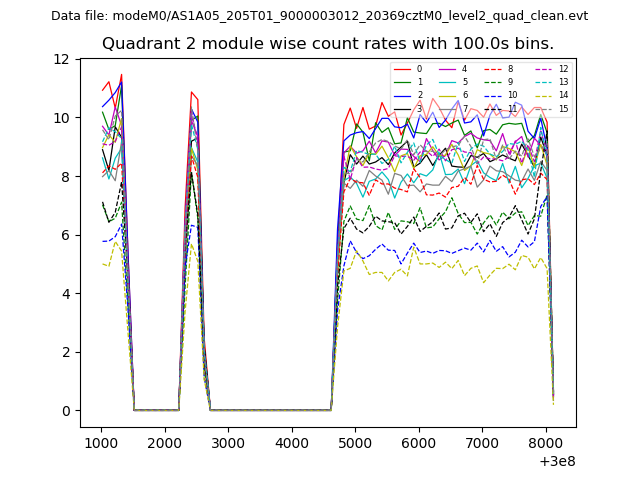
| Module-wise count rates for Quadrant B Data is divided into 100 sec bins |
 |
 |
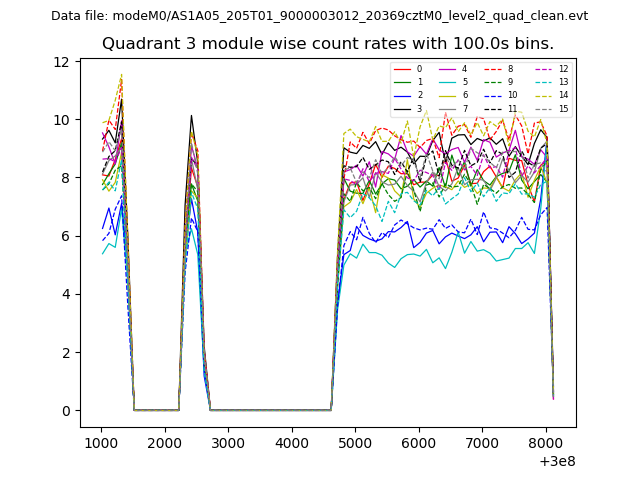
| Module-wise count rates for Quadrant C Data is divided into 100 sec bins |
 |
 |
| Module-wise count rates for Quadrant D Data is divided into 100 sec bins |
 |
 |
| Parameter | Plot |
|---|---|
| CZT HV Monitor | 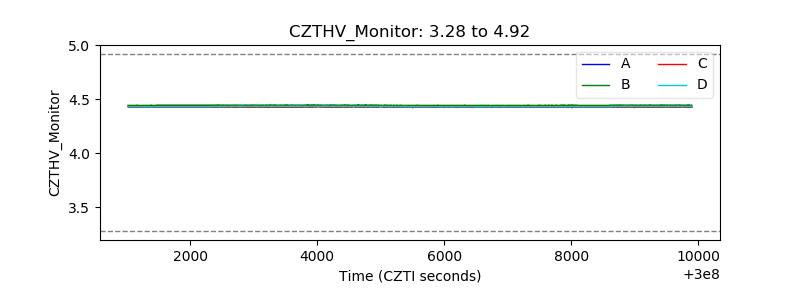 |
| D_VDD | 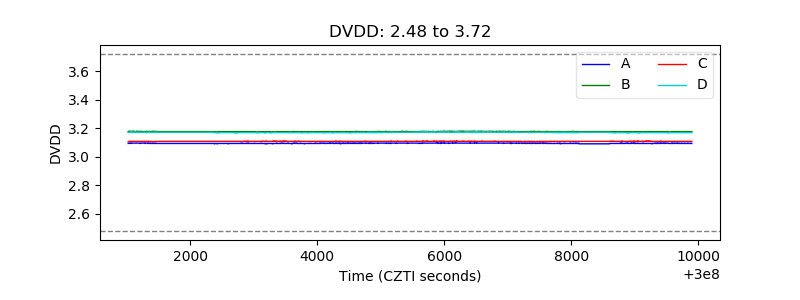 |
| Temperature 1 | 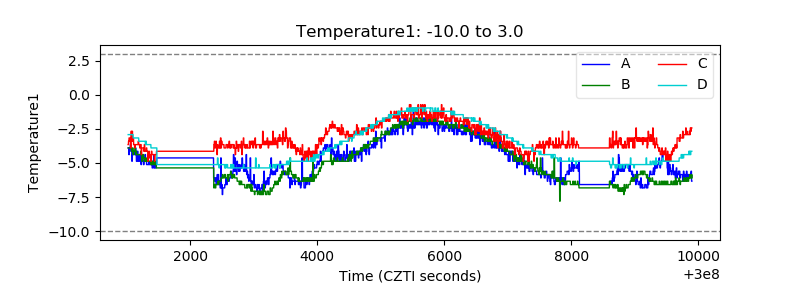 |
| Veto HV Monitor | 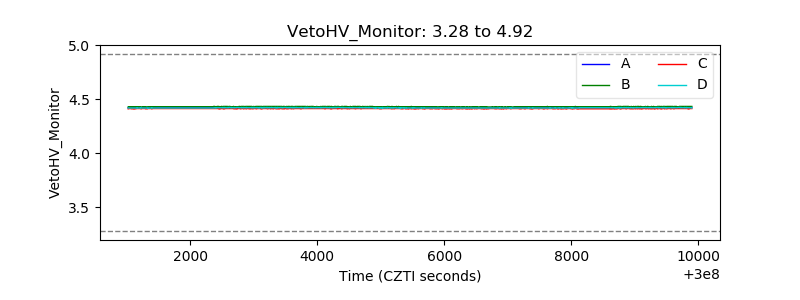 |
| Veto LLD | 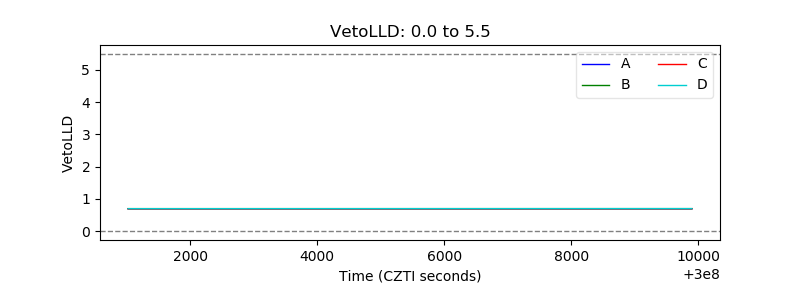 |
| Alpha Counter |  |
| _CPM_Rate | 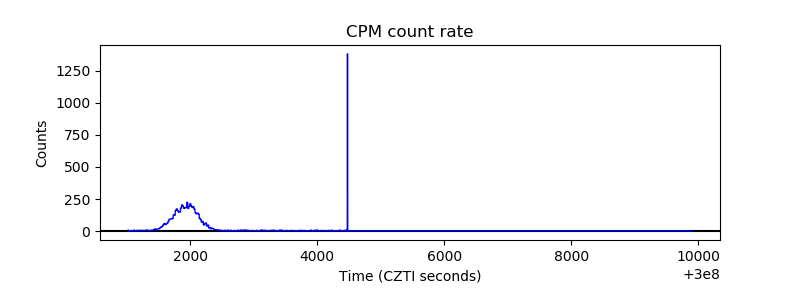 |
| CZT Counter | 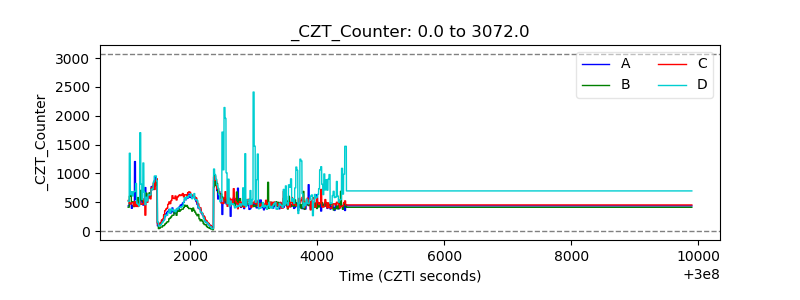 |
| +2.5 Volts monitor |  |
| +5 Volts monitor |  |
| _ROLL_ROT | 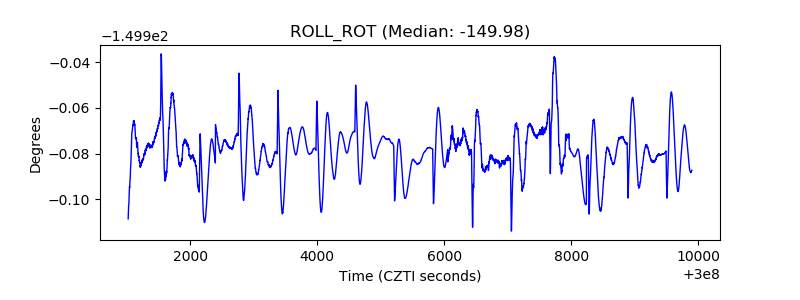 |
| _Roll_DEC | 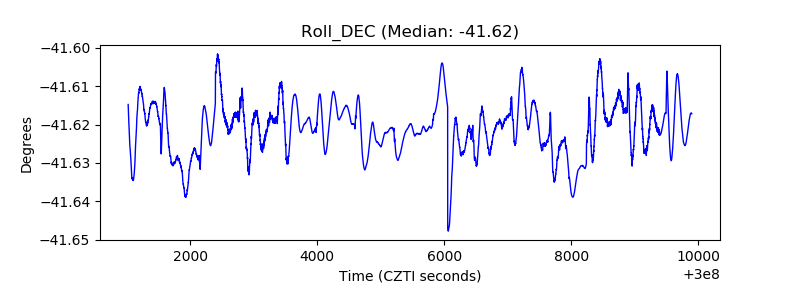 |
| _Roll_RA |  |
| Veto Counter | 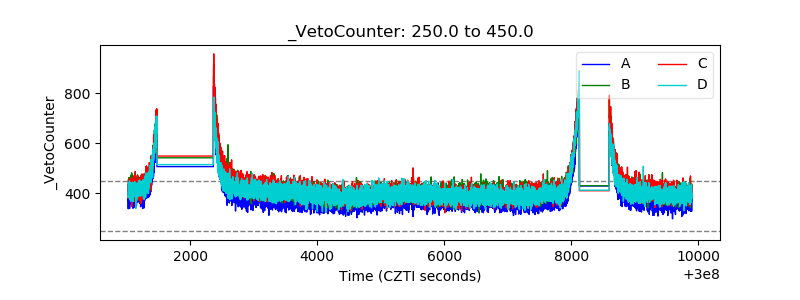 |