| Param | Original file | Final file |
|---|---|---|
| Filename | modeM0/AS1A05_205T01_9000003012_20370cztM0_level2.evt | modeM0/AS1A05_205T01_9000003012_20370cztM0_level2_quad_clean.evt |
| Size (bytes) | 555,661,440 | 81,472,320 |
| Size | 529.9 MB | 77.7 MB |
| Events in quadrant A | 3,788,476 | 489,396 |
| Events in quadrant B | 4,242,442 | 491,934 |
| Events in quadrant C | 3,814,102 | 478,221 |
| Events in quadrant D | 4,453,271 | 464,938 |
| Mode M9 | |||
|---|---|---|---|
| Quadrant | BADHDUFLAG | Total packets | Discarded packets |
| A | 0 | 5 | 0 |
| B | 0 | 5 | 0 |
| C | 0 | 5 | 0 |
| D | 0 | 5 | 0 |
| Mode SS | |||
|---|---|---|---|
| Quadrant | BADHDUFLAG | Total packets | Discarded packets |
| A | 0 | 160 | 0 |
| B | 0 | 160 | 0 |
| C | 0 | 160 | 0 |
| D | 0 | 160 | 0 |
| Mode M0 | |||
|---|---|---|---|
| Quadrant | BADHDUFLAG | Total packets | Discarded packets |
| A | 0 | 16415 | 3 |
| B | 0 | 17430 | 3 |
| C | 0 | 16372 | 3 |
| D | 0 | 18575 | 3 |
| Quadrant | Total seconds | Saturated seconds | Saturation percentage |
|---|---|---|---|
| A | 7794 | 325 | 4.169874% |
| B | 7795 | 433 | 5.554843% |
| C | 7795 | 384 | 4.926235% |
| D | 7795 | 346 | 4.438743% |
Noise dominated data is calculated using 1-second bins in cleaned event files. If a bin has >2000 counts, and if more than 50% of those come from <1% of pixels, then it is considered to be noise-dominated and hence unusable.
| Quadrant | # 1 sec bins | Bins with >0 counts | Bins with >2000 counts | High rate bins dominated by noise | Noise dominated (total time) | Noise dominated (detector-on time) | Marked lightcurve |
|---|---|---|---|---|---|---|---|
| A | 8364 | 7797 | 1 | 1 | 0.01% | 0.01% | 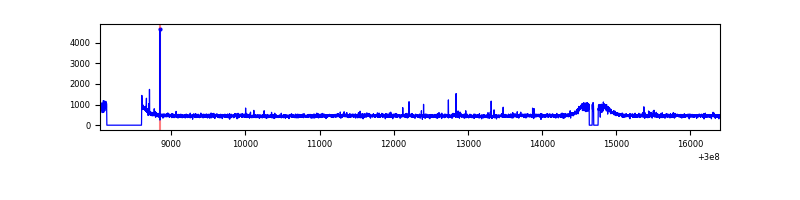 |
| B | 8365 | 7797 | 58 | 58 | 0.69% | 0.74% | 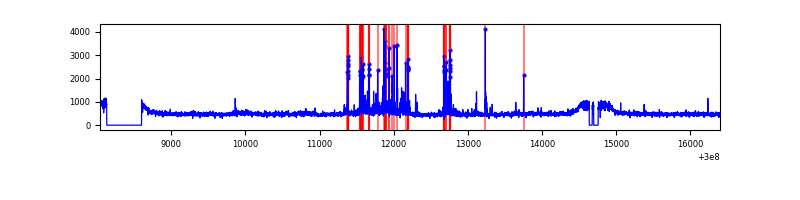 |
| C | 8365 | 7798 | 0 | 0 | 0.00% | 0.00% | 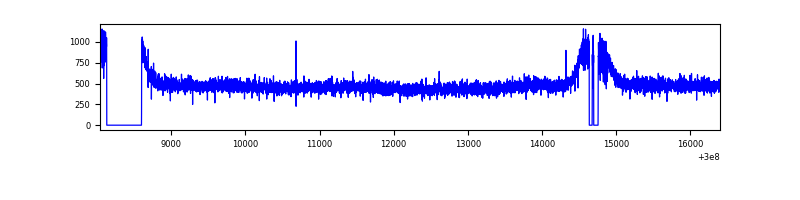 |
| D | 8365 | 7798 | 55 | 55 | 0.66% | 0.71% | 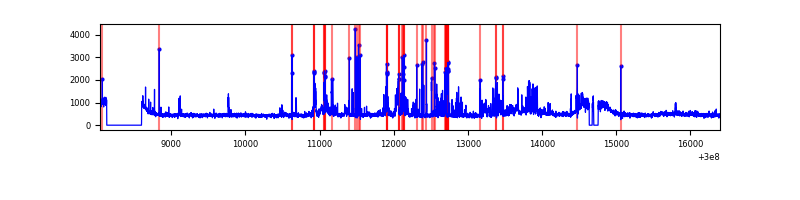 |
Top three noisy pixels from each quadrant. If the there are fewer than three noisy pixels in the level2.evt file, extra rows are filled as -1
| Pixel properties | Quadrant properties | ||||||
|---|---|---|---|---|---|---|---|
| Quadrant | DetID | PixID | Counts | Sigma | Mean | Median | Sigma |
| A | 12 | 96 | 20049 | 96.13 | 974 | 953 | 198.7 |
| A | 6 | 16 | 9217 | 41.6 | 974 | 953 | 198.7 |
| A | 3 | 137 | 8522 | 38.1 | 974 | 953 | 198.7 |
| B | 7 | 220 | 264370 | 1401.96 | 968 | 940 | 187.9 |
| B | 0 | 198 | 59256 | 310.35 | 968 | 940 | 187.9 |
| B | 4 | 80 | 35606 | 184.49 | 968 | 940 | 187.9 |
| C | 14 | 238 | 143317 | 637.98 | 941 | 945 | 223.2 |
| C | 13 | 61 | 6482 | 24.81 | 941 | 945 | 223.2 |
| C | 3 | 233 | 4481 | 15.85 | 941 | 945 | 223.2 |
| D | 1 | 52 | 712606 | 3052.88 | 953 | 923 | 233.1 |
| D | 7 | 238 | 116900 | 497.5 | 953 | 923 | 233.1 |
| D | 2 | 234 | 34654 | 144.69 | 953 | 923 | 233.1 |
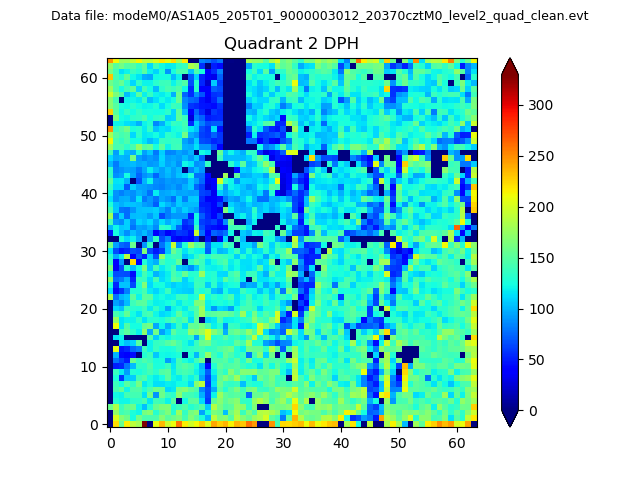
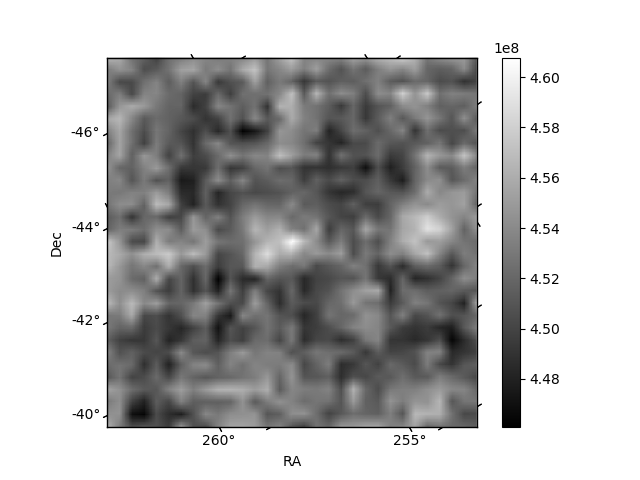
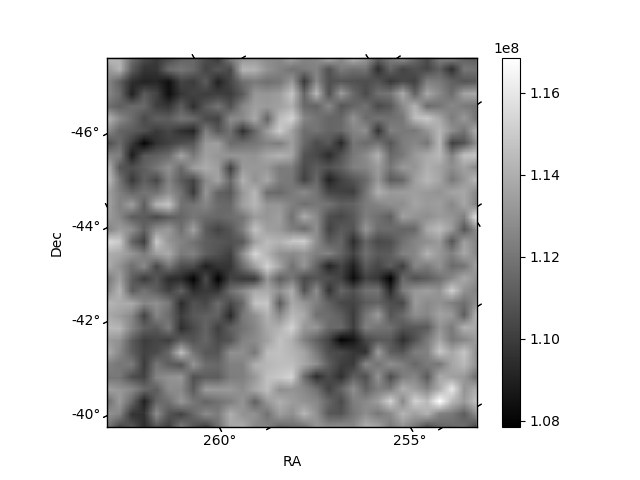
Histogram calculated using DETX and DETY for each event in the final _common_clean file
| Quadrant A | 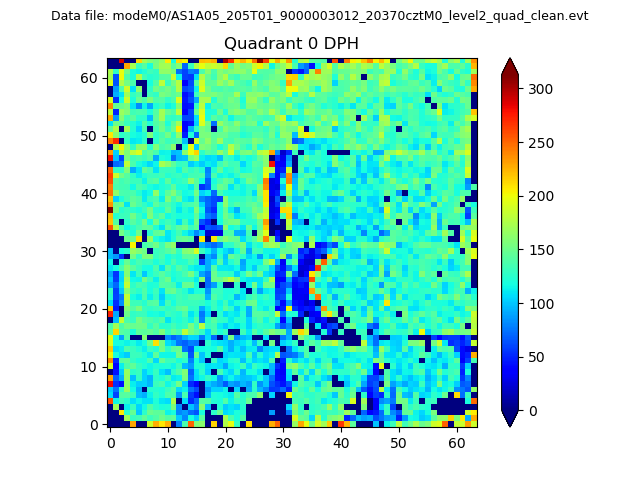 |
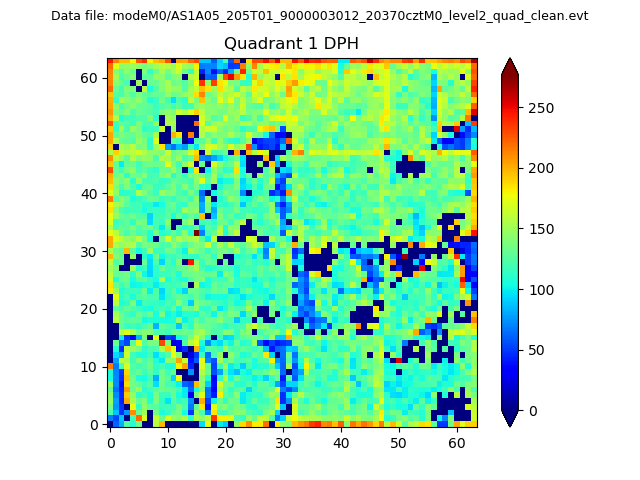 |
Quadrant B |
|---|---|---|---|
| Quadrant D | 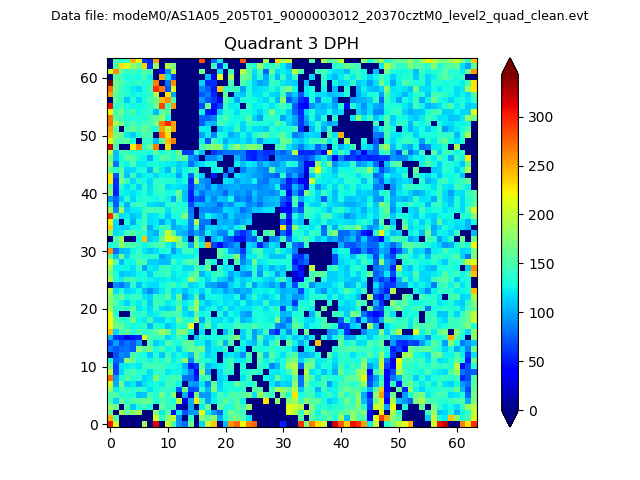 |
 |
Quadrant C |
| Plot type | Count rate plots | Images |
|---|---|---|
| Comparison with Poisson distribution Blue bars denote a histogram of data divided into 1 sec bins. Red curve is a Poisson curve with rate = median count rate of data. |
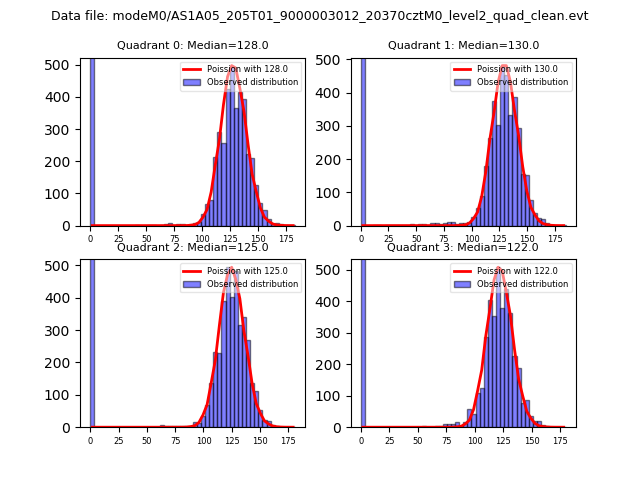 |
 |
| Quadrant-wise count rates Data is divided into 100 sec bins |
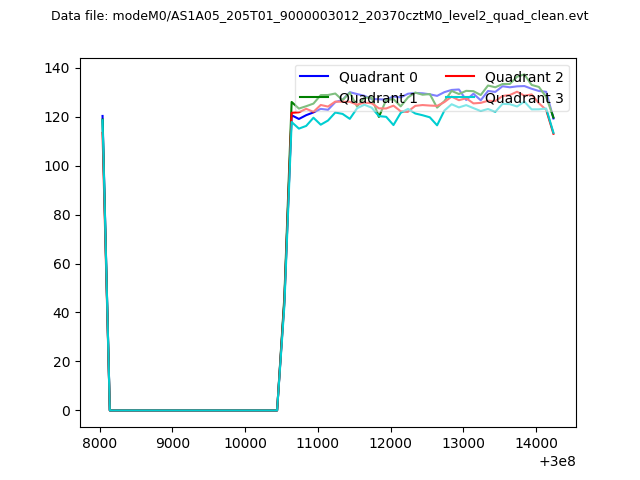 |
|
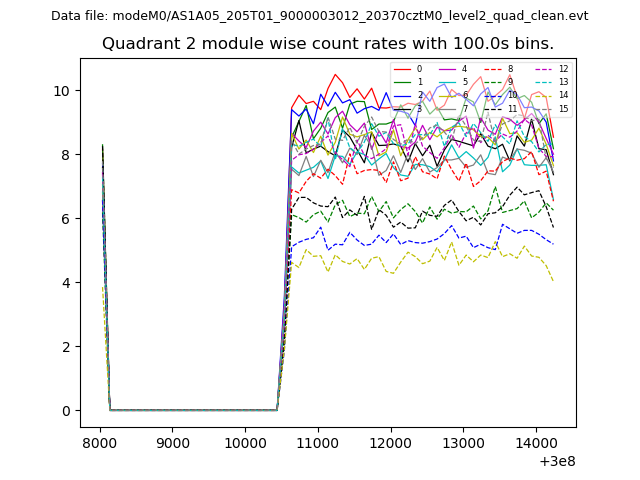
| Module-wise count rates for Quadrant A Data is divided into 100 sec bins |
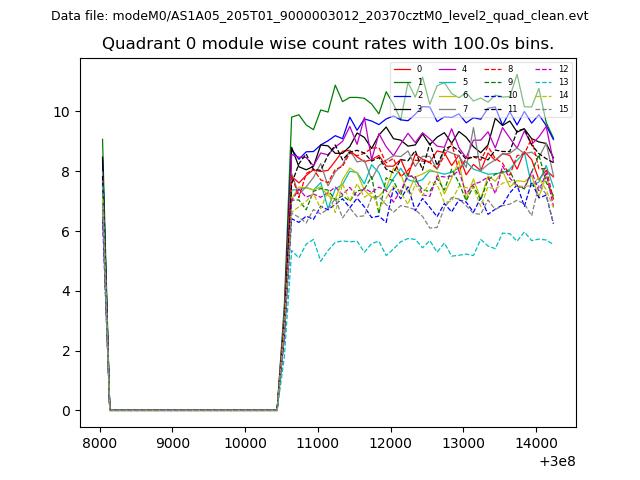 |
 |
| Module-wise count rates for Quadrant B Data is divided into 100 sec bins |
 |
 |
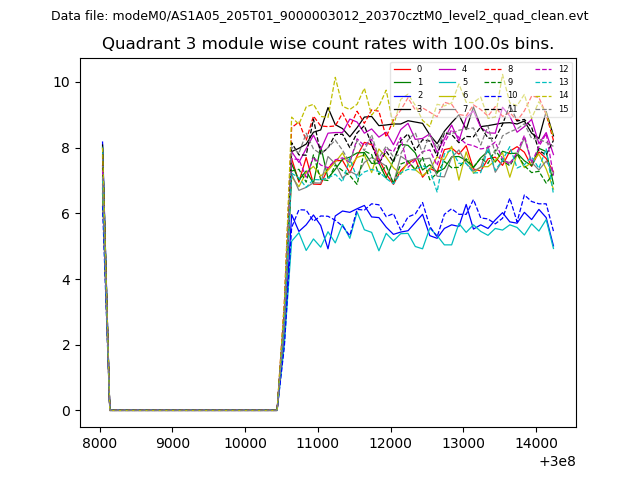
| Module-wise count rates for Quadrant C Data is divided into 100 sec bins |
 |
 |
| Module-wise count rates for Quadrant D Data is divided into 100 sec bins |
 |
 |
| Parameter | Plot |
|---|---|
| CZT HV Monitor |  |
| D_VDD | 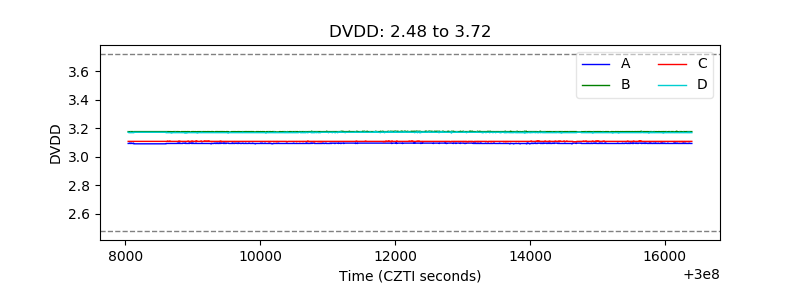 |
| Temperature 1 | 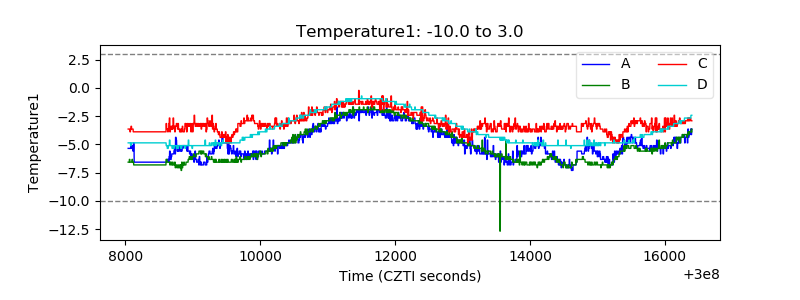 |
| Veto HV Monitor | 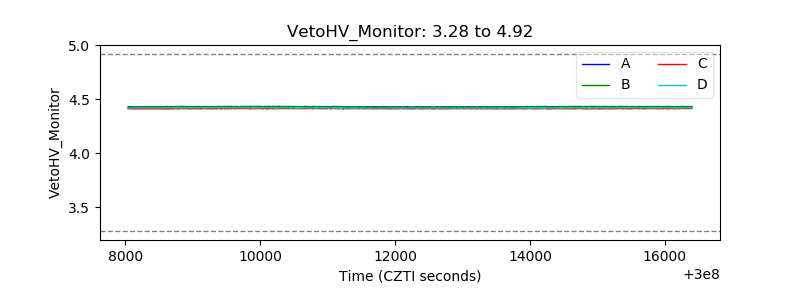 |
| Veto LLD |  |
| Alpha Counter | 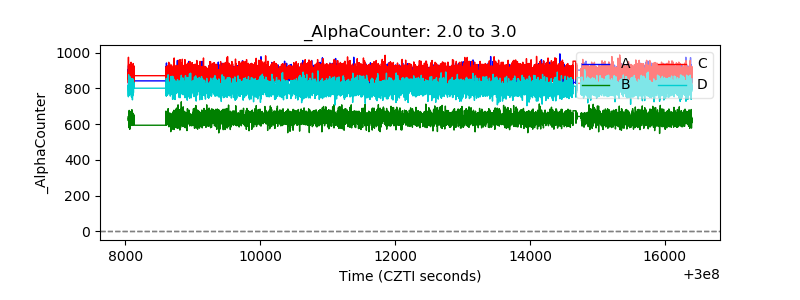 |
| _CPM_Rate | 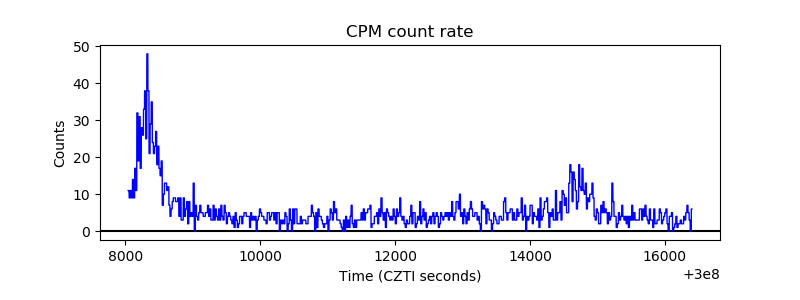 |
| CZT Counter | 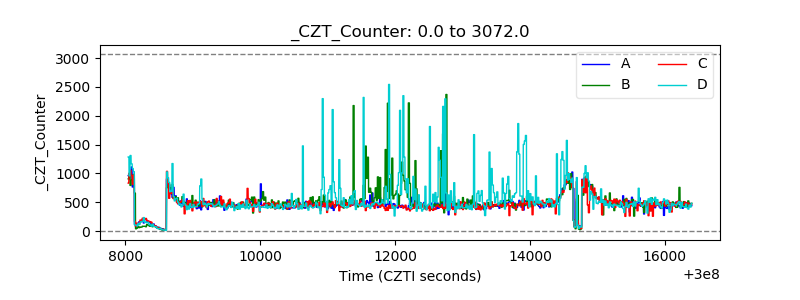 |
| +2.5 Volts monitor |  |
| +5 Volts monitor |  |
| _ROLL_ROT |  |
| _Roll_DEC | 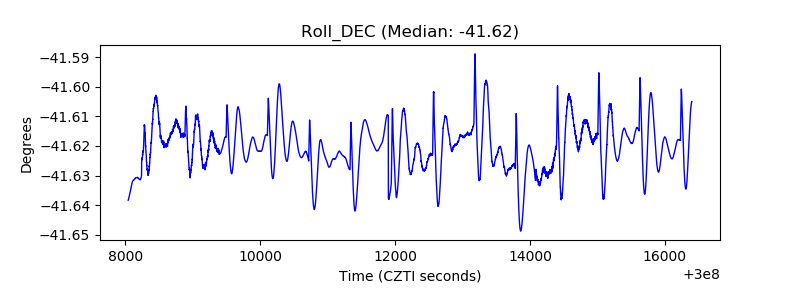 |
| _Roll_RA | 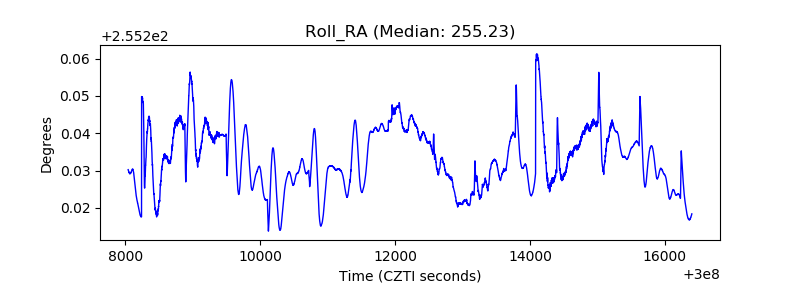 |
| Veto Counter |  |