| Param | Original file | Final file |
|---|---|---|
| Filename | modeM0/AS1A05_205T01_9000003012_20374cztM0_level2.evt | modeM0/AS1A05_205T01_9000003012_20374cztM0_level2_quad_clean.evt |
| Size (bytes) | 1,210,023,360 | 248,529,600 |
| Size | 1.1 GB | 237.0 MB |
| Events in quadrant A | 8,607,467 | 1,603,607 |
| Events in quadrant B | 9,280,732 | 1,613,369 |
| Events in quadrant C | 8,393,206 | 1,554,616 |
| Events in quadrant D | 9,147,001 | 1,516,063 |
| Mode M9 | |||
|---|---|---|---|
| Quadrant | BADHDUFLAG | Total packets | Discarded packets |
| A | 0 | 20 | 0 |
| B | 0 | 20 | 0 |
| C | 0 | 20 | 0 |
| D | 0 | 20 | 0 |
| Mode SS | |||
|---|---|---|---|
| Quadrant | BADHDUFLAG | Total packets | Discarded packets |
| A | 0 | 366 | 0 |
| B | 0 | 366 | 0 |
| C | 0 | 366 | 0 |
| D | 0 | 366 | 0 |
| Mode M0 | |||
|---|---|---|---|
| Quadrant | BADHDUFLAG | Total packets | Discarded packets |
| A | 0 | 37350 | 4 |
| B | 0 | 39062 | 3 |
| C | 0 | 36698 | 3 |
| D | 0 | 39341 | 3 |
| Quadrant | Total seconds | Saturated seconds | Saturation percentage |
|---|---|---|---|
| A | 17991 | 229 | 1.272859% |
| B | 17992 | 302 | 1.678524% |
| C | 17992 | 257 | 1.428413% |
| D | 17992 | 312 | 1.734104% |
Noise dominated data is calculated using 1-second bins in cleaned event files. If a bin has >2000 counts, and if more than 50% of those come from <1% of pixels, then it is considered to be noise-dominated and hence unusable.
| Quadrant | # 1 sec bins | Bins with >0 counts | Bins with >2000 counts | High rate bins dominated by noise | Noise dominated (total time) | Noise dominated (detector-on time) | Marked lightcurve |
|---|---|---|---|---|---|---|---|
| A | 19996 | 17991 | 51 | 51 | 0.26% | 0.28% | 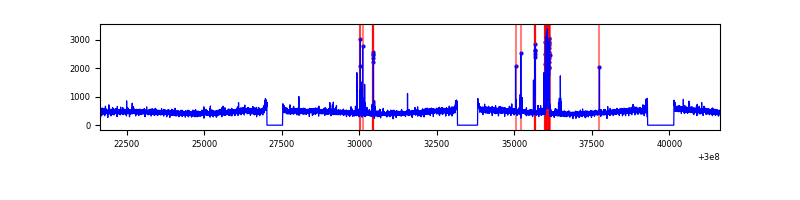 |
| B | 19997 | 17992 | 63 | 63 | 0.32% | 0.35% | 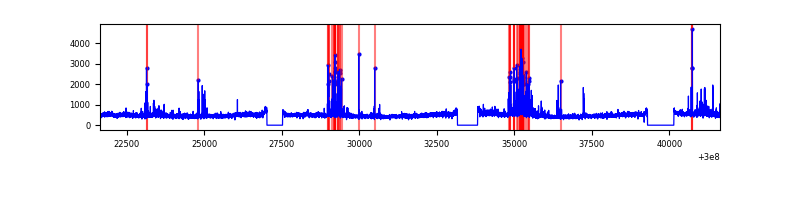 |
| C | 19997 | 17993 | 0 | 0 | 0.00% | 0.00% | 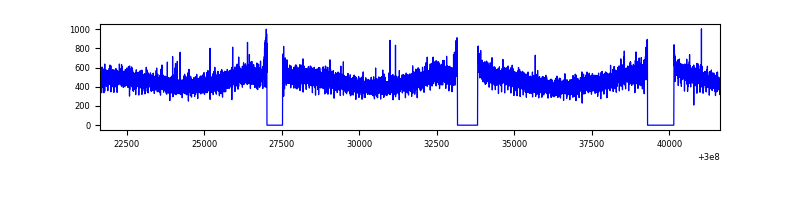 |
| D | 19997 | 17992 | 152 | 152 | 0.76% | 0.84% | 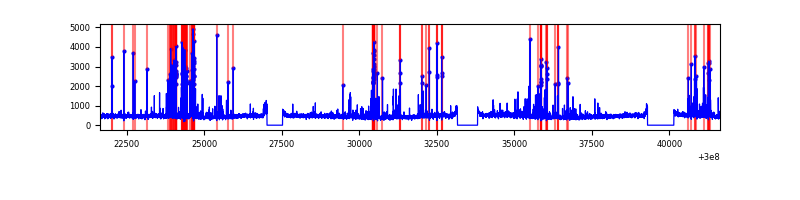 |
Top three noisy pixels from each quadrant. If the there are fewer than three noisy pixels in the level2.evt file, extra rows are filled as -1
| Pixel properties | Quadrant properties | ||||||
|---|---|---|---|---|---|---|---|
| Quadrant | DetID | PixID | Counts | Sigma | Mean | Median | Sigma |
| A | 5 | 16 | 279368 | 638.16 | 2157 | 2110 | 434.5 |
| A | 0 | 226 | 18640 | 38.05 | 2157 | 2110 | 434.5 |
| A | 3 | 137 | 17843 | 36.21 | 2157 | 2110 | 434.5 |
| B | 7 | 220 | 389816 | 937.63 | 2149 | 2094 | 413.5 |
| B | 0 | 197 | 108186 | 256.56 | 2149 | 2094 | 413.5 |
| B | 0 | 198 | 105762 | 250.7 | 2149 | 2094 | 413.5 |
| C | 14 | 238 | 323614 | 665.92 | 2060 | 2075 | 482.9 |
| C | 13 | 61 | 14430 | 25.59 | 2060 | 2075 | 482.9 |
| C | 8 | 128 | 11981 | 20.52 | 2060 | 2075 | 482.9 |
| D | 1 | 52 | 553907 | 1088.0 | 2089 | 2028 | 507.2 |
| D | 13 | 138 | 242519 | 474.12 | 2089 | 2028 | 507.2 |
| D | 13 | 153 | 150476 | 292.66 | 2089 | 2028 | 507.2 |
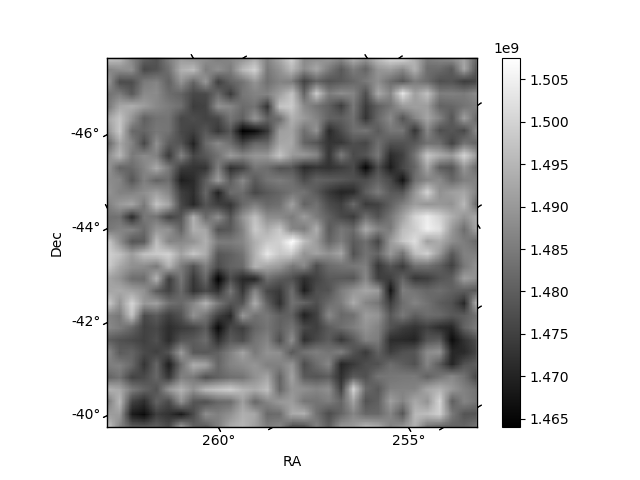
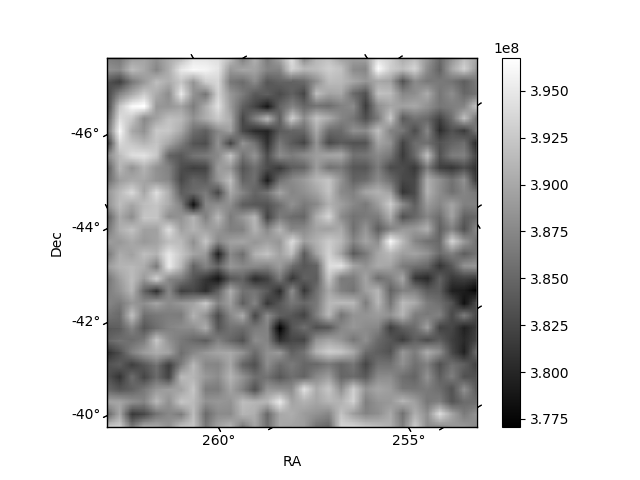
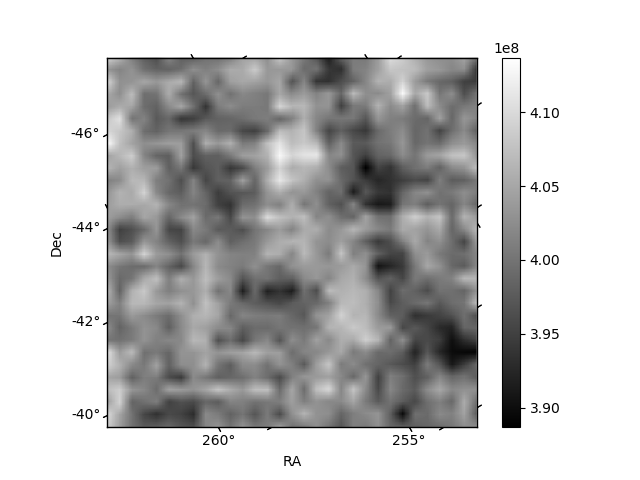
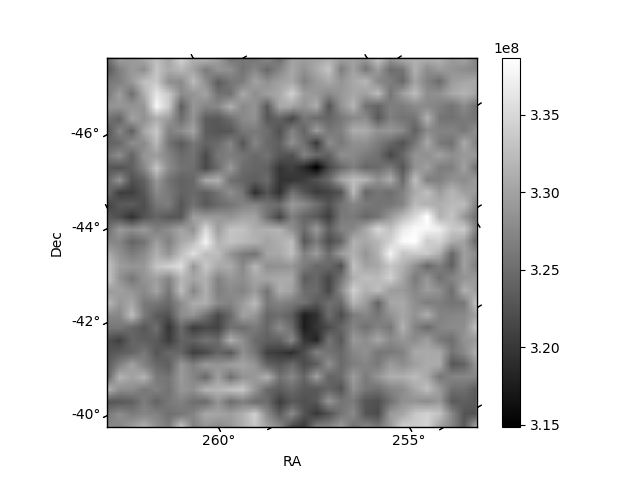
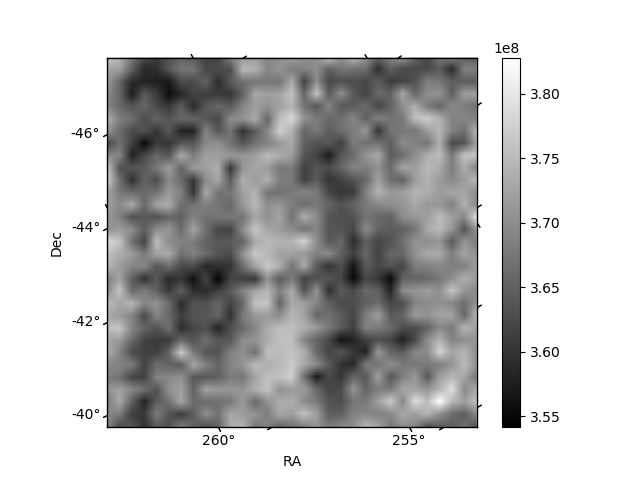
Histogram calculated using DETX and DETY for each event in the final _common_clean file
| Quadrant A | 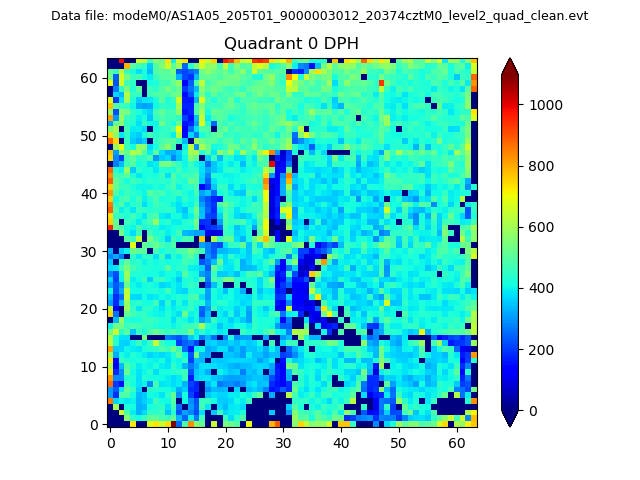 |
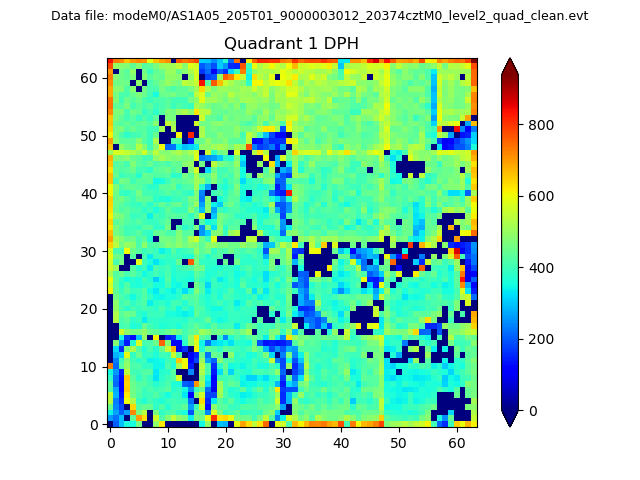 |
Quadrant B |
|---|---|---|---|
| Quadrant D | 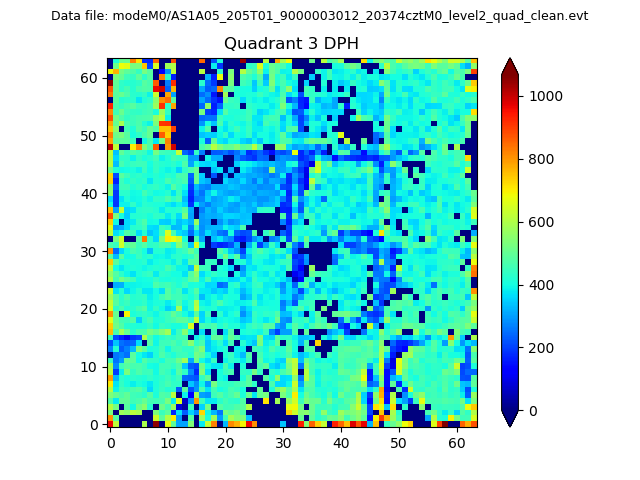 |
 |
Quadrant C |
| Plot type | Count rate plots | Images |
|---|---|---|
| Comparison with Poisson distribution Blue bars denote a histogram of data divided into 1 sec bins. Red curve is a Poisson curve with rate = median count rate of data. |
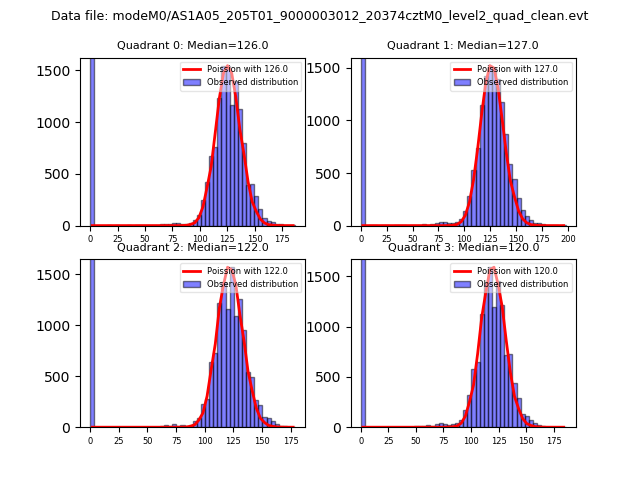 |
 |
| Quadrant-wise count rates Data is divided into 100 sec bins |
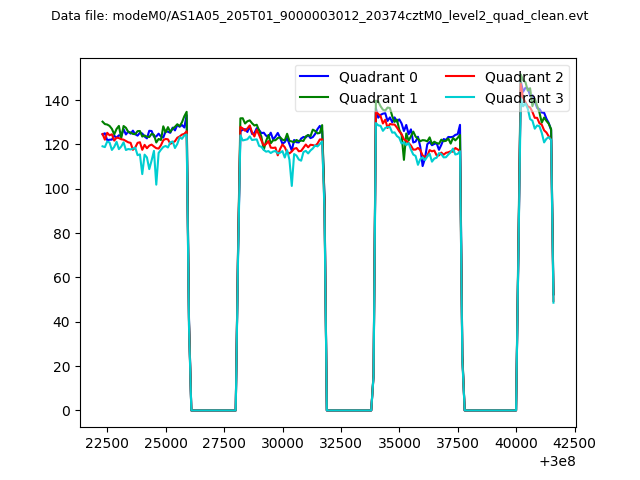 |
|
| Module-wise count rates for Quadrant A Data is divided into 100 sec bins |
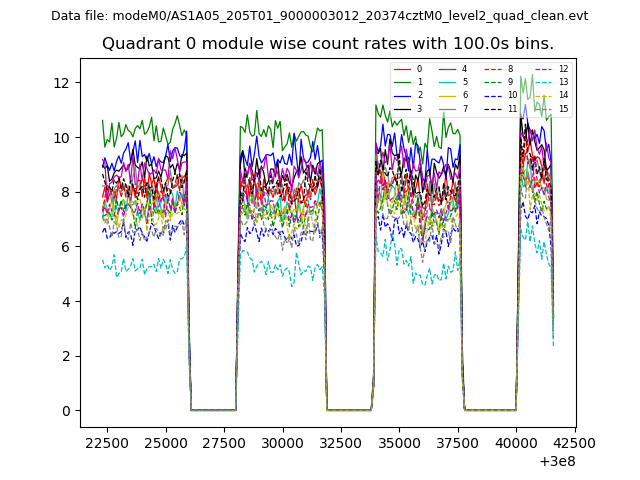 |
 |
| Module-wise count rates for Quadrant B Data is divided into 100 sec bins |
 |
 |
| Module-wise count rates for Quadrant C Data is divided into 100 sec bins |
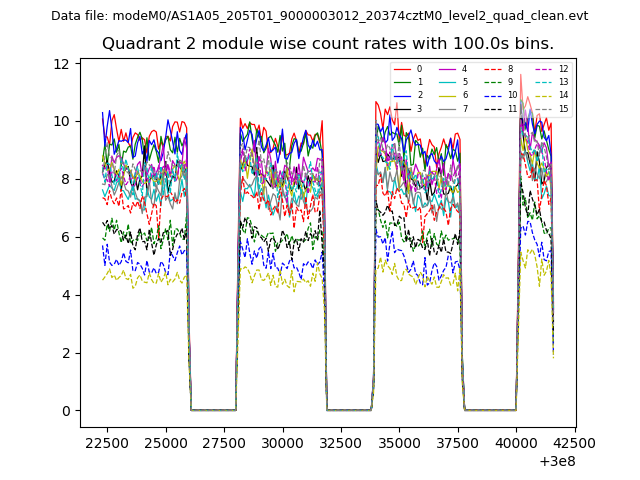 |
 |
| Module-wise count rates for Quadrant D Data is divided into 100 sec bins |
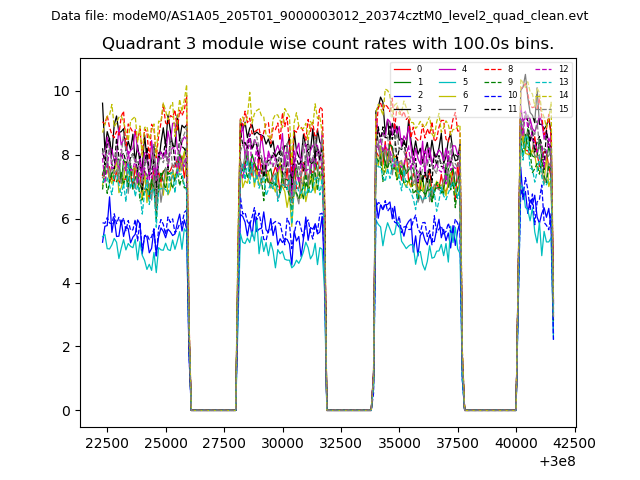 |
 |
| Parameter | Plot |
|---|---|
| CZT HV Monitor | 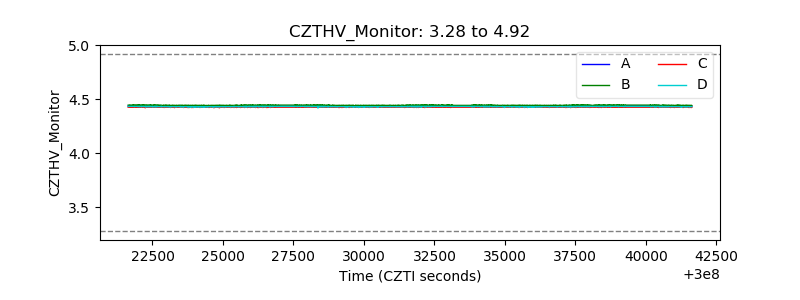 |
| D_VDD | 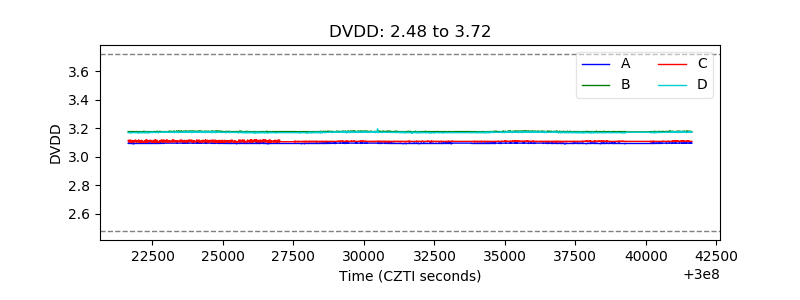 |
| Temperature 1 | 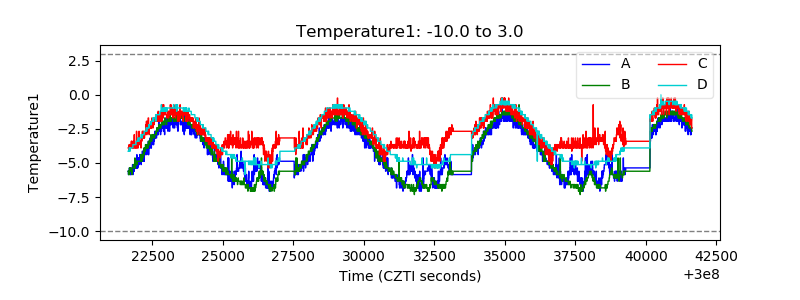 |
| Veto HV Monitor | 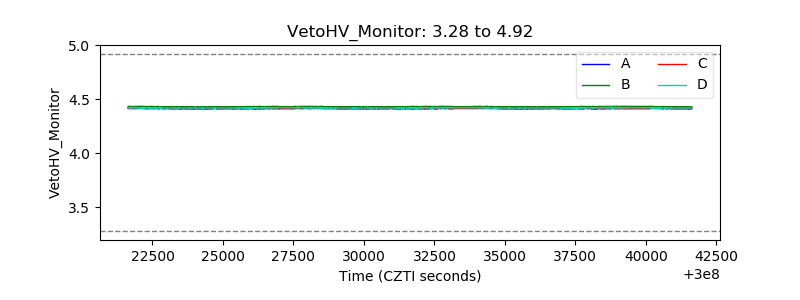 |
| Veto LLD | 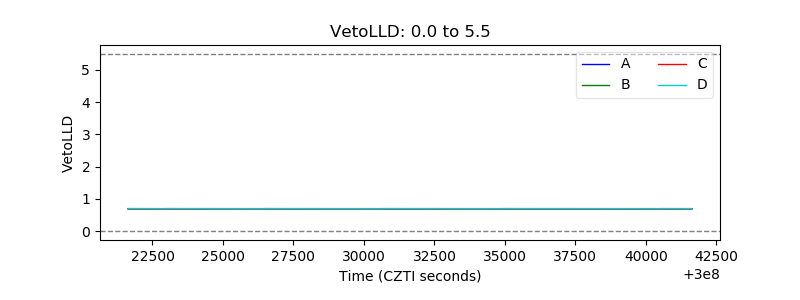 |
| Alpha Counter | 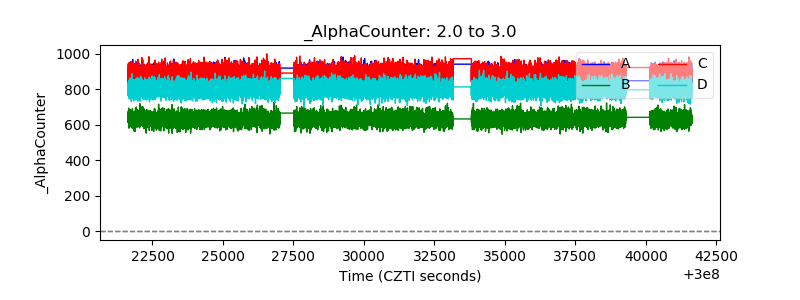 |
| _CPM_Rate | 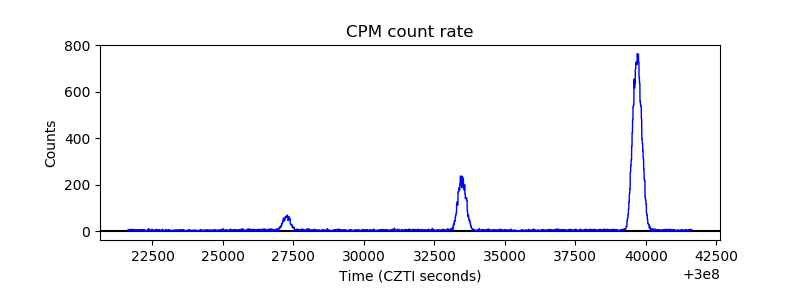 |
| CZT Counter | 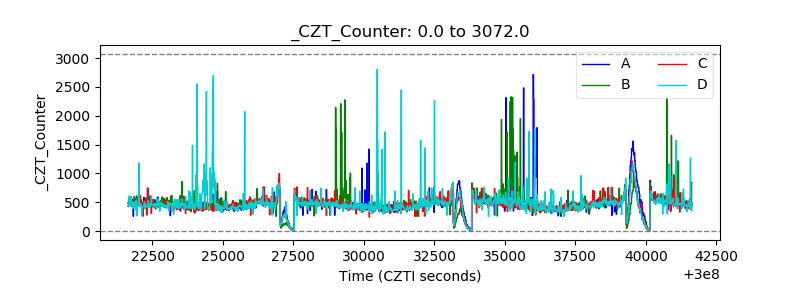 |
| +2.5 Volts monitor |  |
| +5 Volts monitor |  |
| _ROLL_ROT | 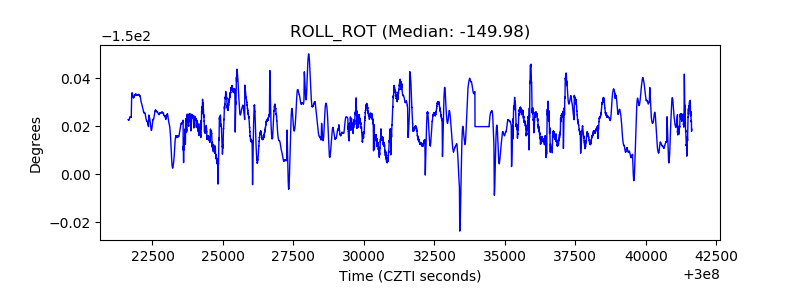 |
| _Roll_DEC | 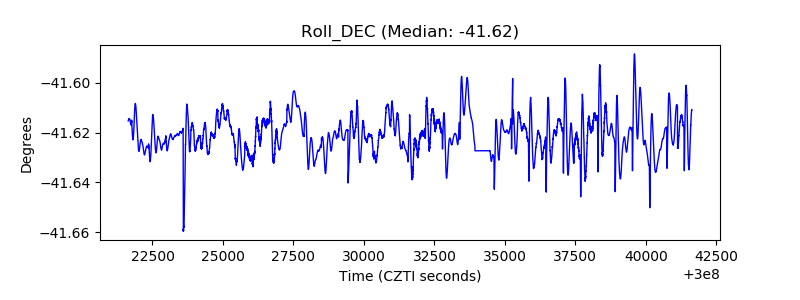 |
| _Roll_RA | 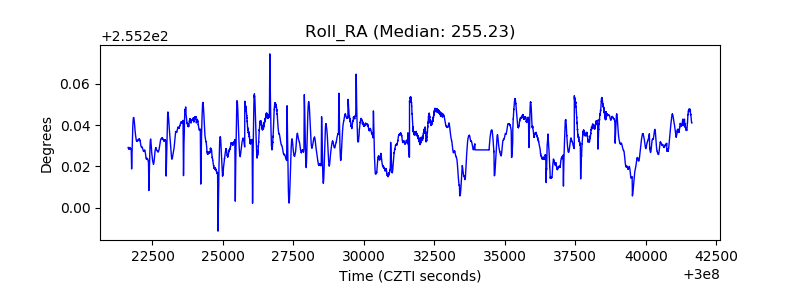 |
| Veto Counter | 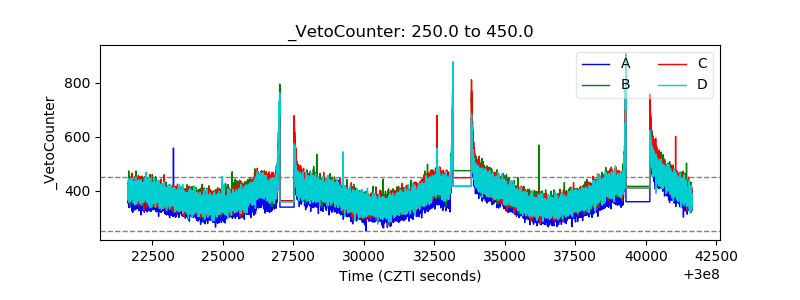 |