| Param | Original file | Final file |
|---|---|---|
| Filename | modeM0/AS1A05_205T01_9000003012_20375cztM0_level2.evt | modeM0/AS1A05_205T01_9000003012_20375cztM0_level2_quad_clean.evt |
| Size (bytes) | 510,730,560 | 99,489,600 |
| Size | 487.1 MB | 94.9 MB |
| Events in quadrant A | 3,218,558 | 655,686 |
| Events in quadrant B | 3,715,907 | 654,536 |
| Events in quadrant C | 3,191,426 | 625,976 |
| Events in quadrant D | 4,883,043 | 605,801 |
| Mode M9 | |||
|---|---|---|---|
| Quadrant | BADHDUFLAG | Total packets | Discarded packets |
| A | 0 | 15 | 0 |
| B | 0 | 16 | 0 |
| C | 0 | 16 | 0 |
| D | 0 | 16 | 0 |
| Mode SS | |||
|---|---|---|---|
| Quadrant | BADHDUFLAG | Total packets | Discarded packets |
| A | 0 | 138 | 0 |
| B | 0 | 138 | 0 |
| C | 0 | 138 | 0 |
| D | 0 | 138 | 0 |
| Mode M0 | |||
|---|---|---|---|
| Quadrant | BADHDUFLAG | Total packets | Discarded packets |
| A | 0 | 14033 | 2 |
| B | 0 | 15567 | 2 |
| C | 0 | 13912 | 2 |
| D | 0 | 19003 | 2 |
| Quadrant | Total seconds | Saturated seconds | Saturation percentage |
|---|---|---|---|
| A | 6755 | 53 | 0.784604% |
| B | 6755 | 107 | 1.584012% |
| C | 6755 | 67 | 0.991858% |
| D | 6755 | 167 | 2.472243% |
Noise dominated data is calculated using 1-second bins in cleaned event files. If a bin has >2000 counts, and if more than 50% of those come from <1% of pixels, then it is considered to be noise-dominated and hence unusable.
| Quadrant | # 1 sec bins | Bins with >0 counts | Bins with >2000 counts | High rate bins dominated by noise | Noise dominated (total time) | Noise dominated (detector-on time) | Marked lightcurve |
|---|---|---|---|---|---|---|---|
| A | 7775 | 6755 | 2 | 2 | 0.03% | 0.03% | 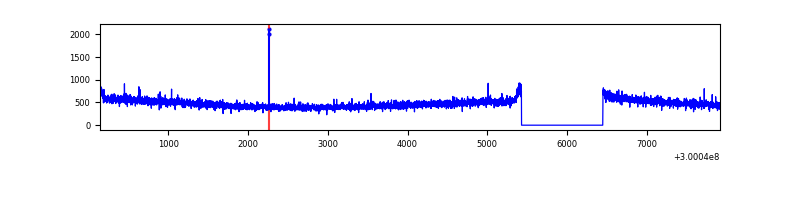 |
| B | 7775 | 6755 | 27 | 27 | 0.35% | 0.40% | 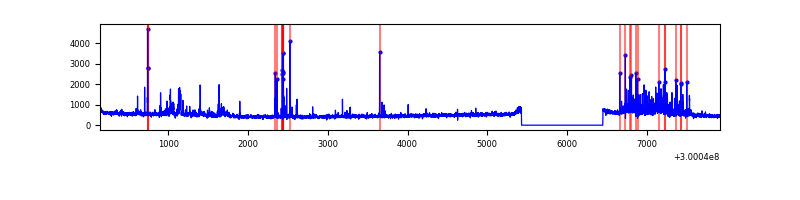 |
| C | 7775 | 6756 | 0 | 0 | 0.00% | 0.00% | 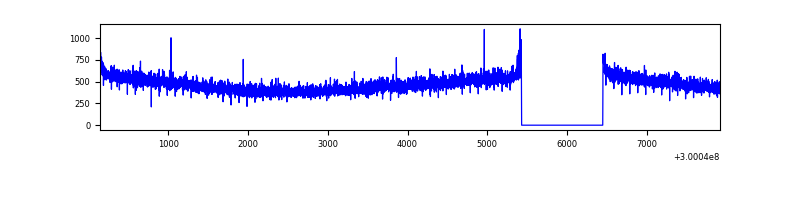 |
| D | 7775 | 6756 | 213 | 213 | 2.74% | 3.15% | 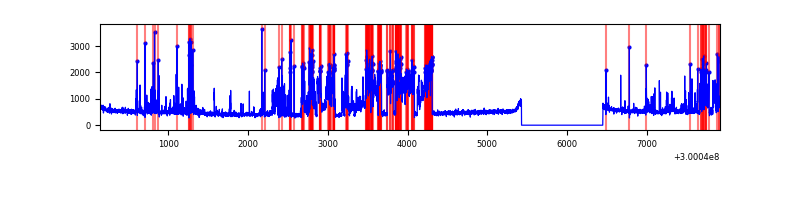 |
Top three noisy pixels from each quadrant. If the there are fewer than three noisy pixels in the level2.evt file, extra rows are filled as -1
| Pixel properties | Quadrant properties | ||||||
|---|---|---|---|---|---|---|---|
| Quadrant | DetID | PixID | Counts | Sigma | Mean | Median | Sigma |
| A | 5 | 16 | 10007 | 54.87 | 832 | 816 | 167.5 |
| A | 0 | 226 | 7464 | 39.69 | 832 | 816 | 167.5 |
| A | 13 | 254 | 6825 | 35.87 | 832 | 816 | 167.5 |
| B | 7 | 220 | 222765 | 1391.2 | 827 | 806 | 159.5 |
| B | 0 | 197 | 69277 | 429.16 | 827 | 806 | 159.5 |
| B | 0 | 190 | 44359 | 272.98 | 827 | 806 | 159.5 |
| C | 14 | 238 | 123654 | 668.95 | 785 | 790 | 183.7 |
| C | 3 | 233 | 6192 | 29.41 | 785 | 790 | 183.7 |
| C | 13 | 61 | 5537 | 25.85 | 785 | 790 | 183.7 |
| D | 1 | 52 | 1624650 | 8296.19 | 795 | 771 | 195.7 |
| D | 13 | 153 | 130036 | 660.4 | 795 | 771 | 195.7 |
| D | 2 | 234 | 32116 | 160.14 | 795 | 771 | 195.7 |
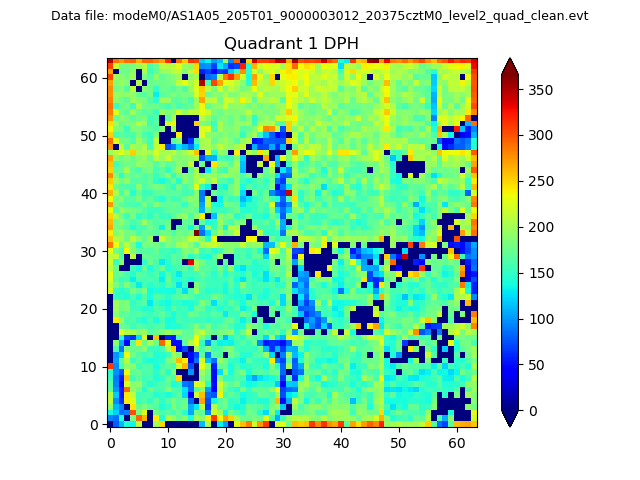
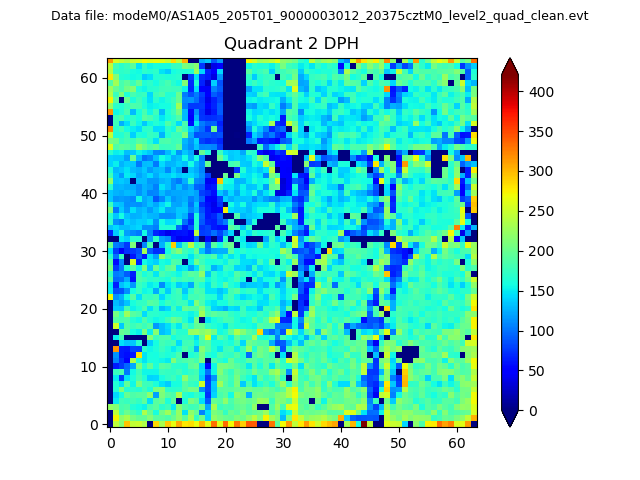
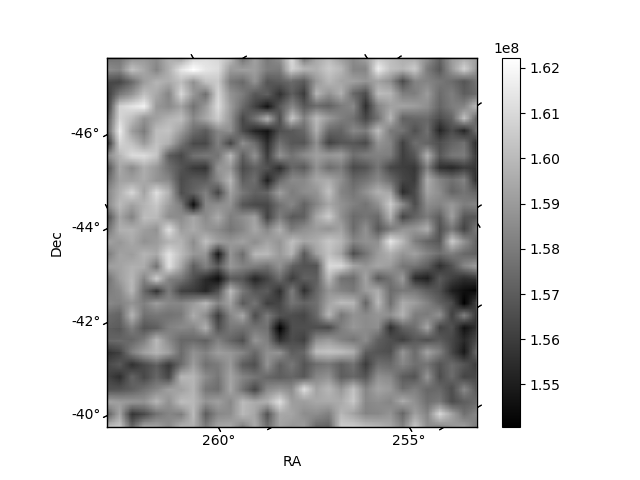
Histogram calculated using DETX and DETY for each event in the final _common_clean file
| Quadrant A |  |
 |
Quadrant B |
|---|---|---|---|
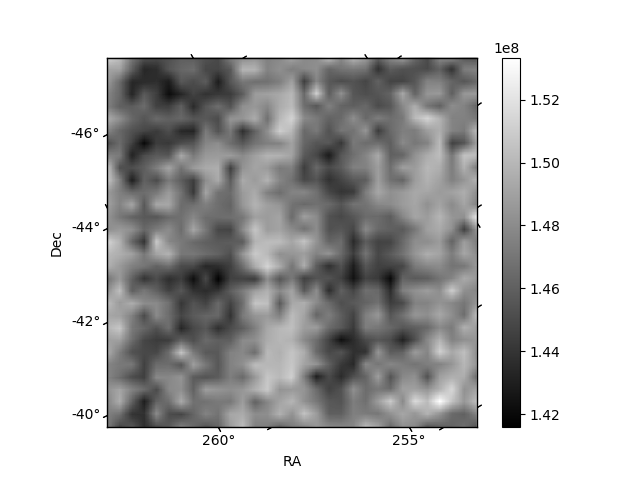
| Quadrant D | 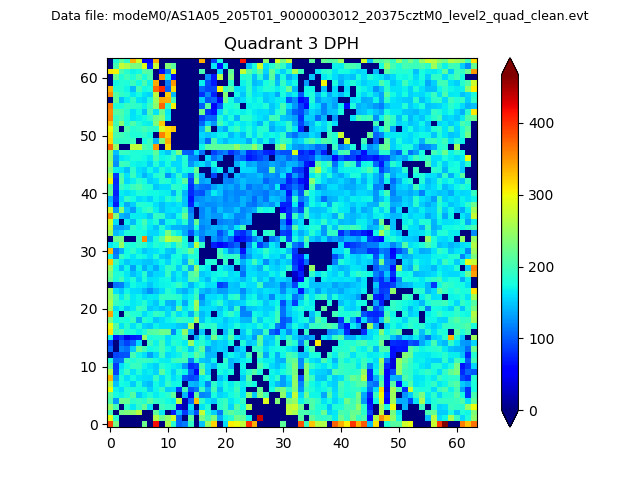 |
 |
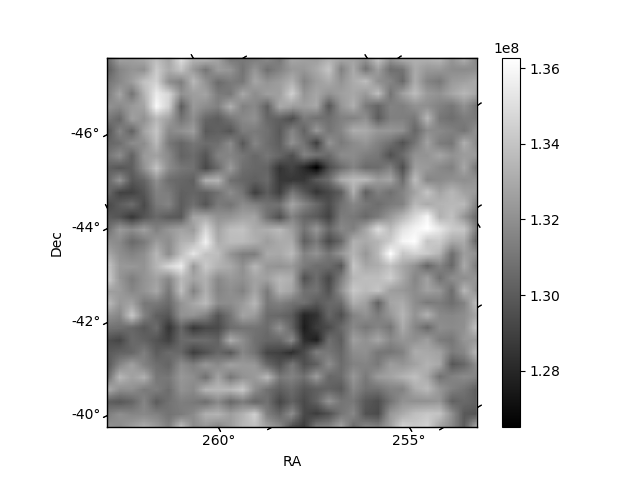
Quadrant C |
| Plot type | Count rate plots | Images |
|---|---|---|
| Comparison with Poisson distribution Blue bars denote a histogram of data divided into 1 sec bins. Red curve is a Poisson curve with rate = median count rate of data. |
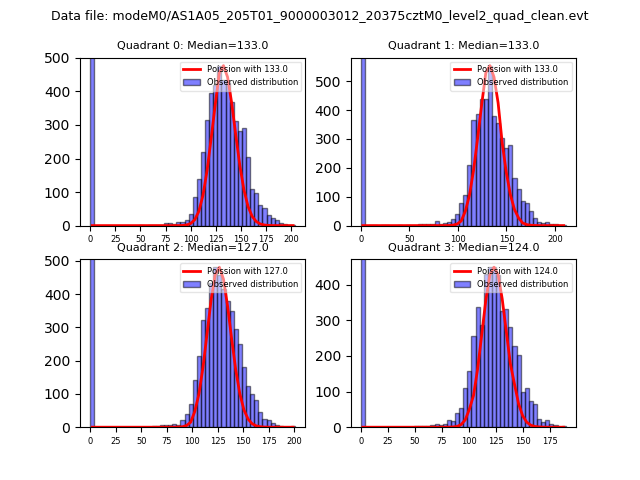 |
 |
| Quadrant-wise count rates Data is divided into 100 sec bins |
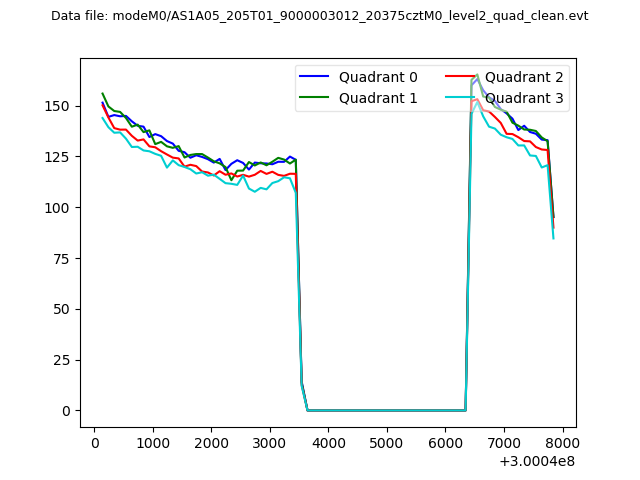 |
|
| Module-wise count rates for Quadrant A Data is divided into 100 sec bins |
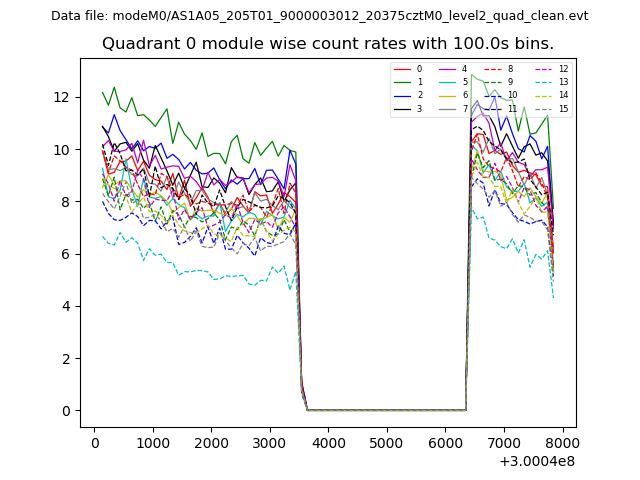 |
 |
| Module-wise count rates for Quadrant B Data is divided into 100 sec bins |
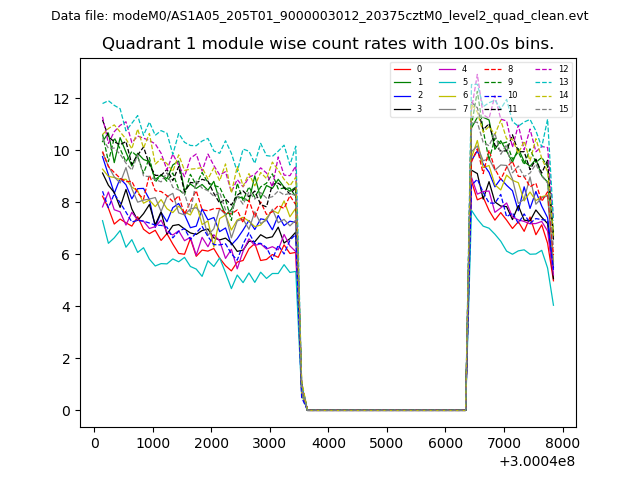 |
 |
| Module-wise count rates for Quadrant C Data is divided into 100 sec bins |
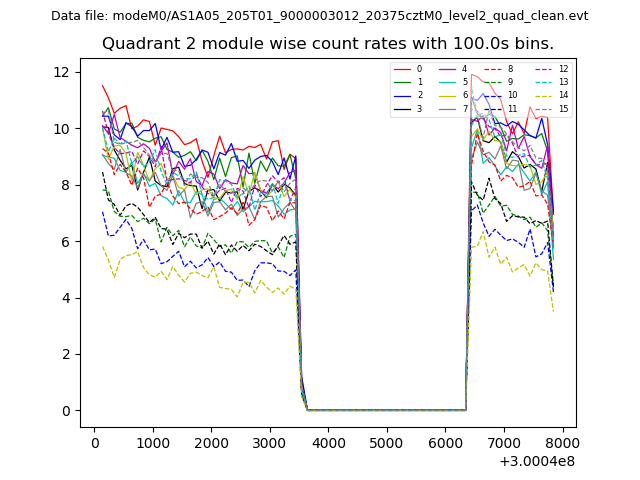 |
 |
| Module-wise count rates for Quadrant D Data is divided into 100 sec bins |
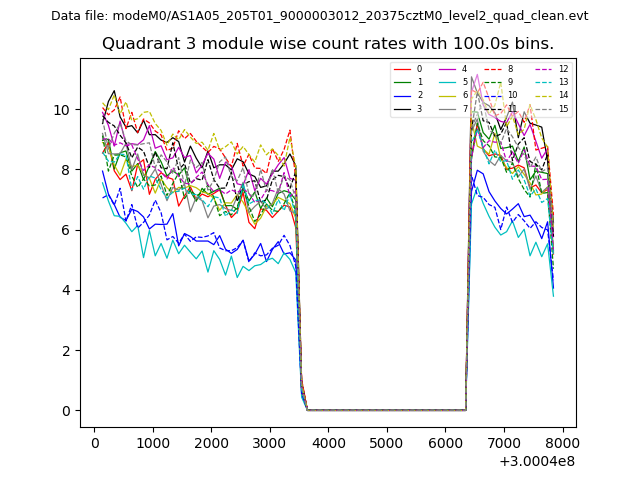 |
 |
| Parameter | Plot |
|---|---|
| CZT HV Monitor | 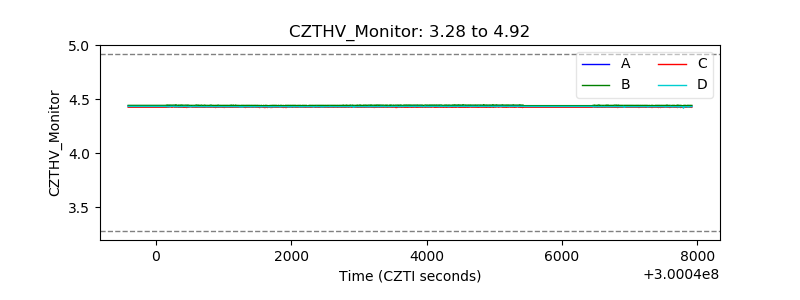 |
| D_VDD | 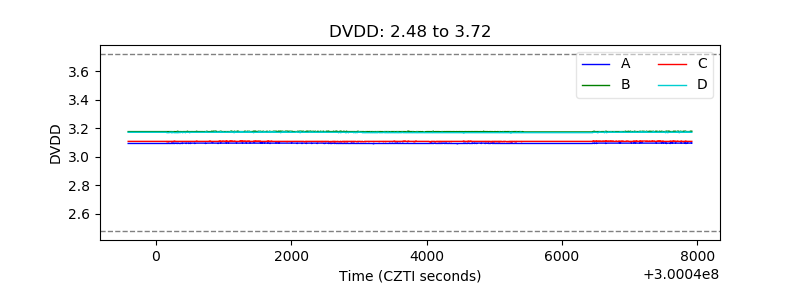 |
| Temperature 1 | 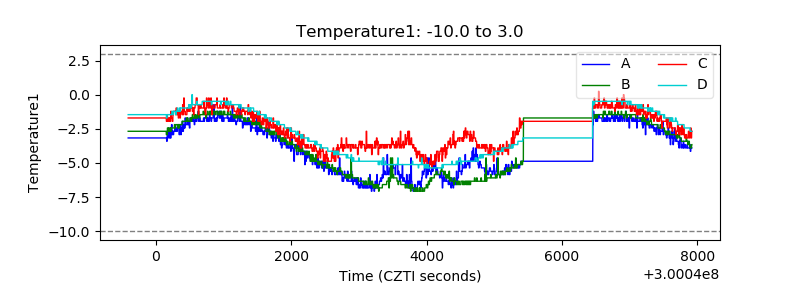 |
| Veto HV Monitor |  |
| Veto LLD | 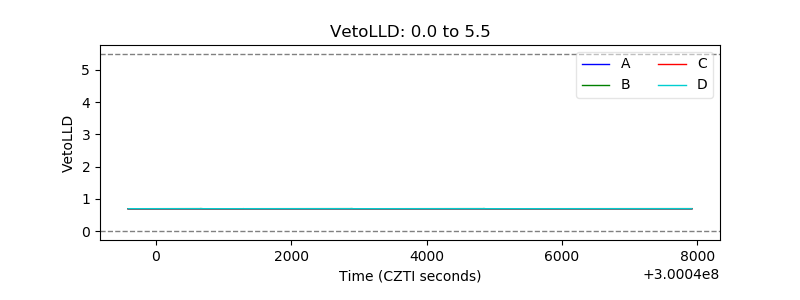 |
| Alpha Counter | 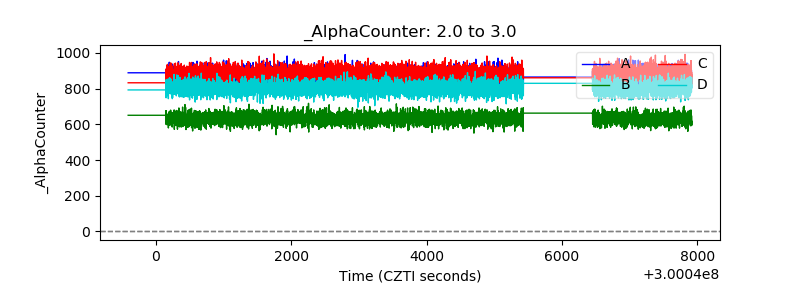 |
| _CPM_Rate | 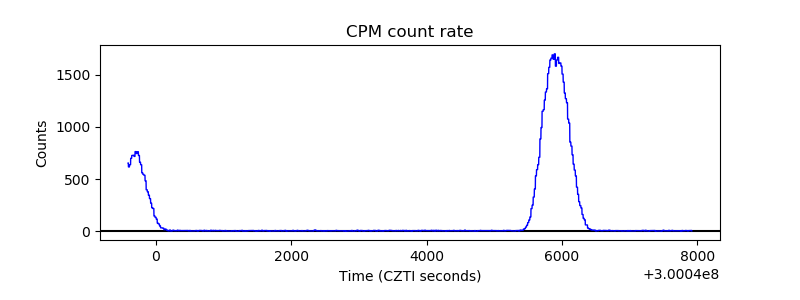 |
| CZT Counter | 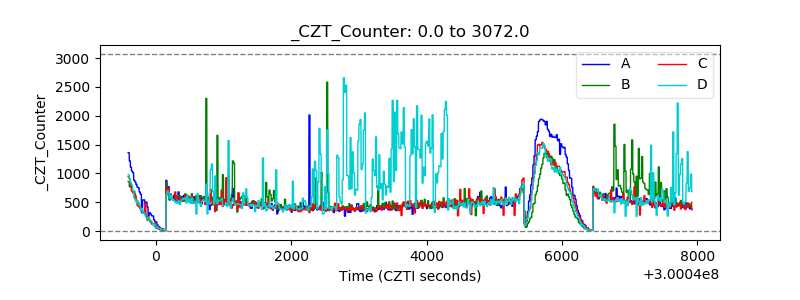 |
| +2.5 Volts monitor |  |
| +5 Volts monitor | 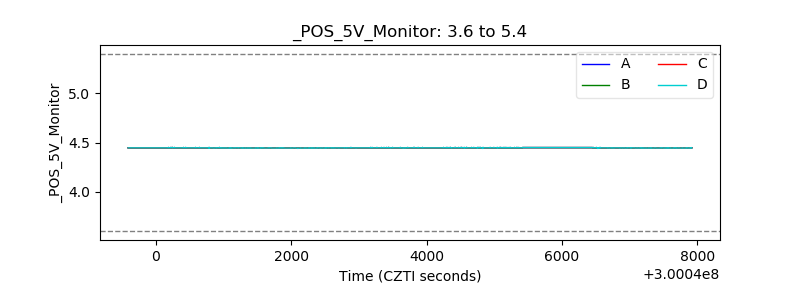 |
| _ROLL_ROT | 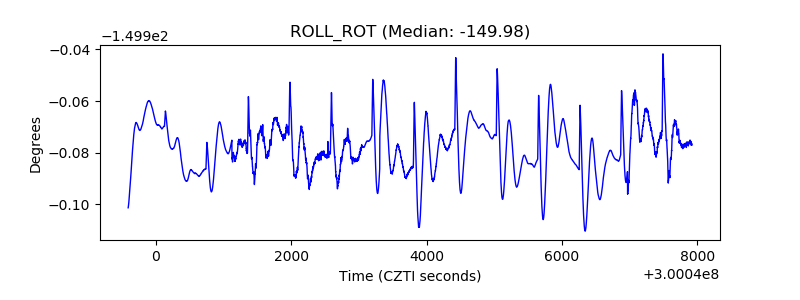 |
| _Roll_DEC | 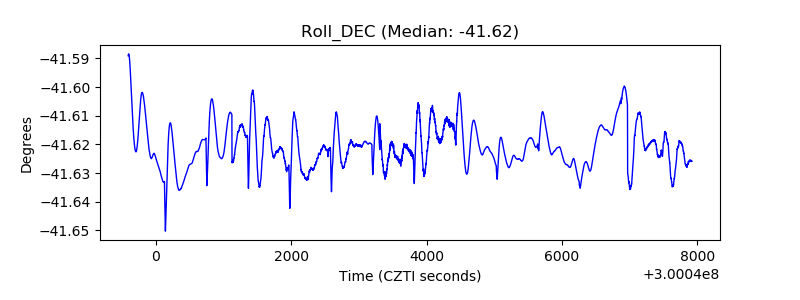 |
| _Roll_RA |  |
| Veto Counter | 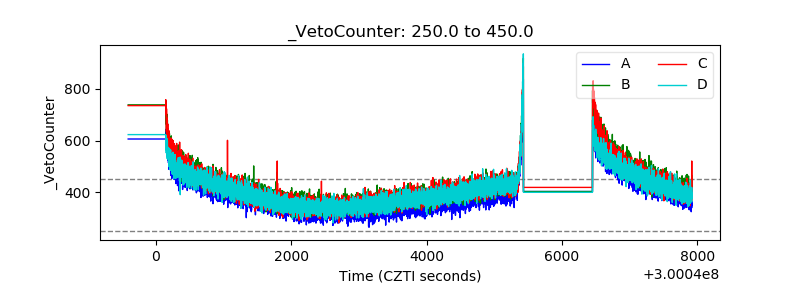 |