| Param | Original file | Final file |
|---|---|---|
| Filename | modeM0/AS1A05_205T01_9000003012_20377cztM0_level2.evt | modeM0/AS1A05_205T01_9000003012_20377cztM0_level2_quad_clean.evt |
| Size (bytes) | 471,228,480 | 94,720,320 |
| Size | 449.4 MB | 90.3 MB |
| Events in quadrant A | 3,117,871 | 622,195 |
| Events in quadrant B | 3,506,038 | 627,684 |
| Events in quadrant C | 3,105,779 | 594,165 |
| Events in quadrant D | 4,100,498 | 571,399 |
| Mode M9 | |||
|---|---|---|---|
| Quadrant | BADHDUFLAG | Total packets | Discarded packets |
| A | 0 | 13 | 0 |
| B | 0 | 14 | 0 |
| C | 0 | 14 | 0 |
| D | 0 | 14 | 0 |
| Mode SS | |||
|---|---|---|---|
| Quadrant | BADHDUFLAG | Total packets | Discarded packets |
| A | 0 | 132 | 0 |
| B | 0 | 132 | 0 |
| C | 0 | 132 | 0 |
| D | 0 | 132 | 0 |
| Mode M0 | |||
|---|---|---|---|
| Quadrant | BADHDUFLAG | Total packets | Discarded packets |
| A | 0 | 13578 | 2 |
| B | 0 | 14752 | 2 |
| C | 0 | 13442 | 2 |
| D | 0 | 16616 | 2 |
| Quadrant | Total seconds | Saturated seconds | Saturation percentage |
|---|---|---|---|
| A | 6494 | 26 | 0.400370% |
| B | 6494 | 55 | 0.846936% |
| C | 6494 | 40 | 0.615953% |
| D | 6494 | 71 | 1.093317% |
Noise dominated data is calculated using 1-second bins in cleaned event files. If a bin has >2000 counts, and if more than 50% of those come from <1% of pixels, then it is considered to be noise-dominated and hence unusable.
| Quadrant | # 1 sec bins | Bins with >0 counts | Bins with >2000 counts | High rate bins dominated by noise | Noise dominated (total time) | Noise dominated (detector-on time) | Marked lightcurve |
|---|---|---|---|---|---|---|---|
| A | 7679 | 6495 | 0 | 0 | 0.00% | 0.00% | 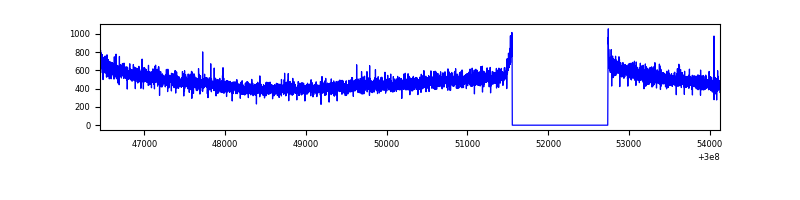 |
| B | 7679 | 6495 | 15 | 15 | 0.20% | 0.23% | 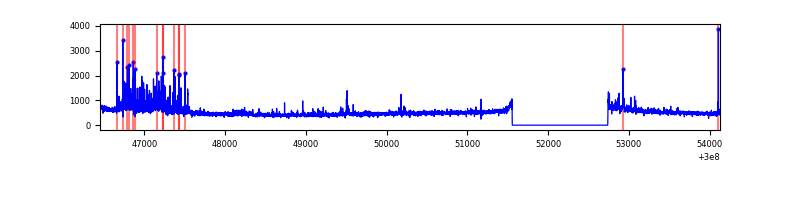 |
| C | 7679 | 6495 | 0 | 0 | 0.00% | 0.00% | 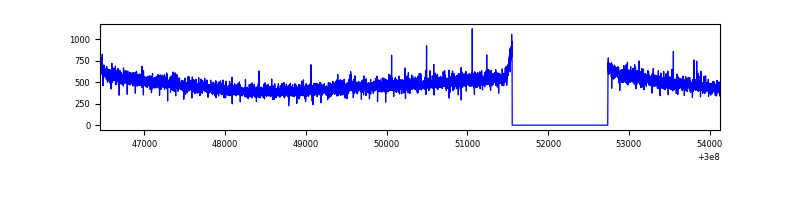 |
| D | 7679 | 6495 | 68 | 68 | 0.89% | 1.05% | 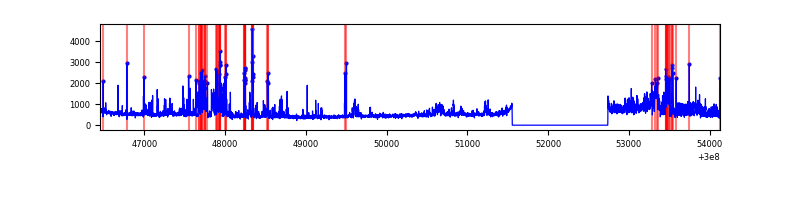 |
Top three noisy pixels from each quadrant. If the there are fewer than three noisy pixels in the level2.evt file, extra rows are filled as -1
| Pixel properties | Quadrant properties | ||||||
|---|---|---|---|---|---|---|---|
| Quadrant | DetID | PixID | Counts | Sigma | Mean | Median | Sigma |
| A | 0 | 226 | 7026 | 38.41 | 809 | 792 | 162.3 |
| A | 13 | 254 | 6851 | 37.33 | 809 | 792 | 162.3 |
| A | 3 | 137 | 6274 | 33.77 | 809 | 792 | 162.3 |
| B | 7 | 220 | 181700 | 1173.64 | 807 | 788 | 154.1 |
| B | 0 | 197 | 38161 | 242.45 | 807 | 788 | 154.1 |
| B | 15 | 36 | 30832 | 194.91 | 807 | 788 | 154.1 |
| C | 14 | 238 | 119516 | 663.31 | 763 | 769 | 179.0 |
| C | 3 | 233 | 8474 | 43.04 | 763 | 769 | 179.0 |
| C | 13 | 61 | 5480 | 26.32 | 763 | 769 | 179.0 |
| D | 1 | 52 | 684611 | 3609.59 | 771 | 748 | 189.5 |
| D | 7 | 238 | 261714 | 1377.44 | 771 | 748 | 189.5 |
| D | 13 | 153 | 119820 | 628.49 | 771 | 748 | 189.5 |
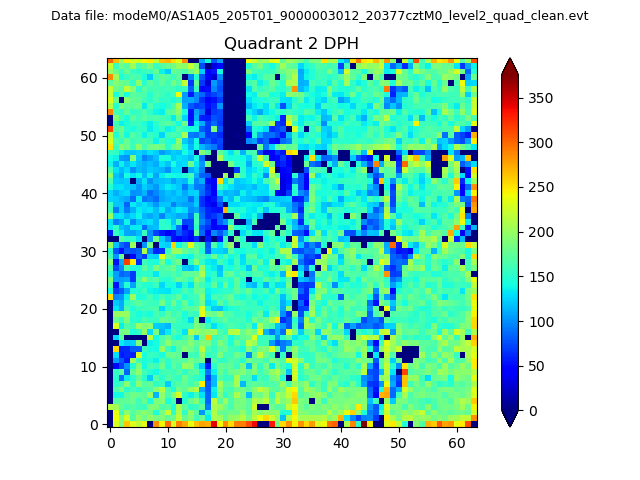
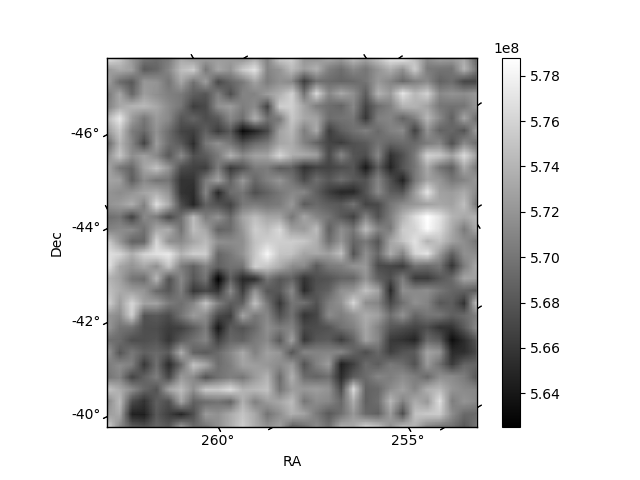
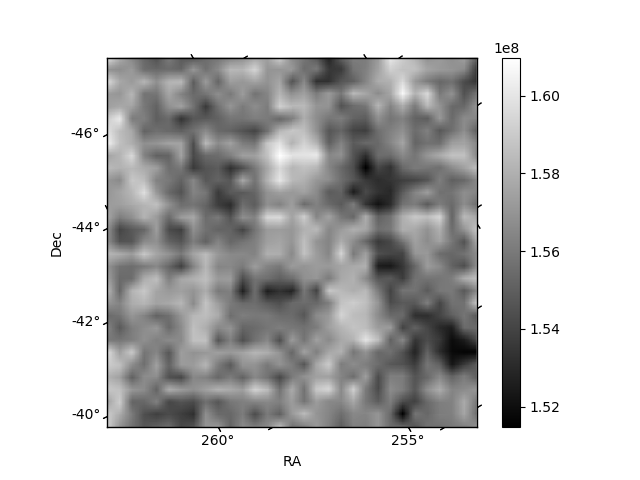
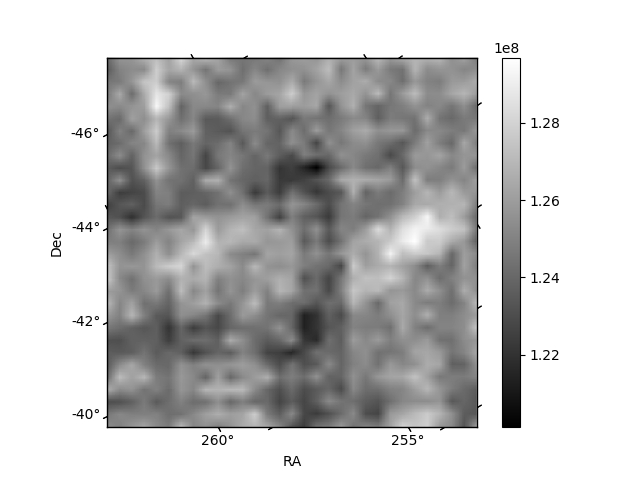
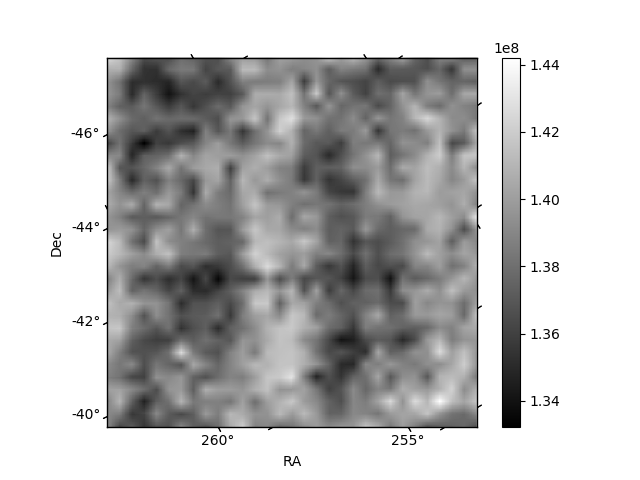
Histogram calculated using DETX and DETY for each event in the final _common_clean file
| Quadrant A | 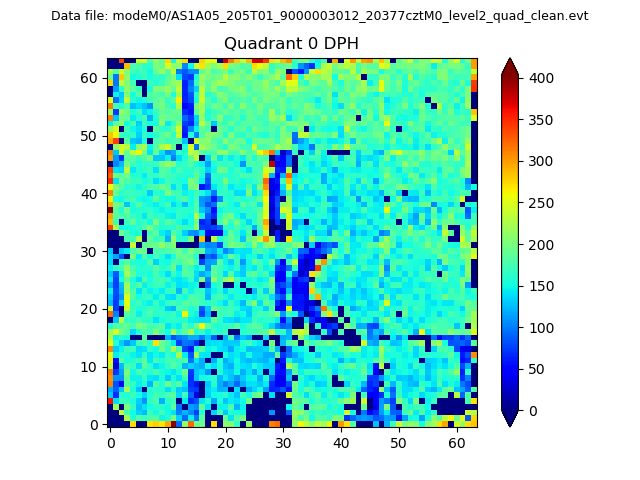 |
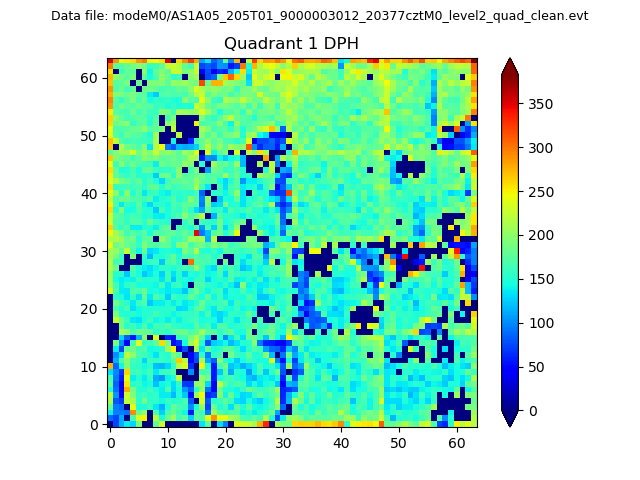 |
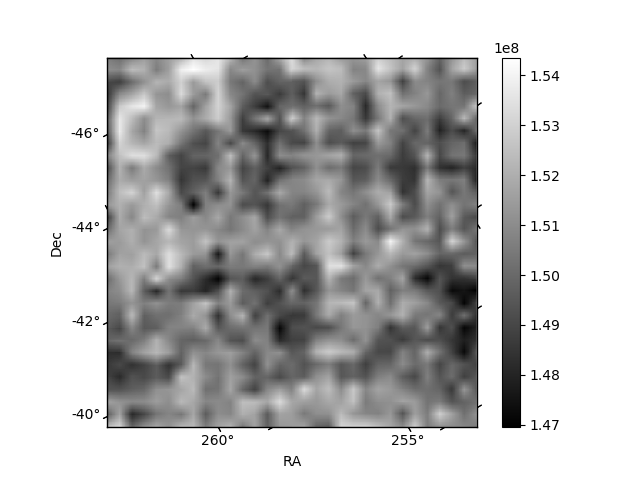
Quadrant B |
|---|---|---|---|
| Quadrant D | 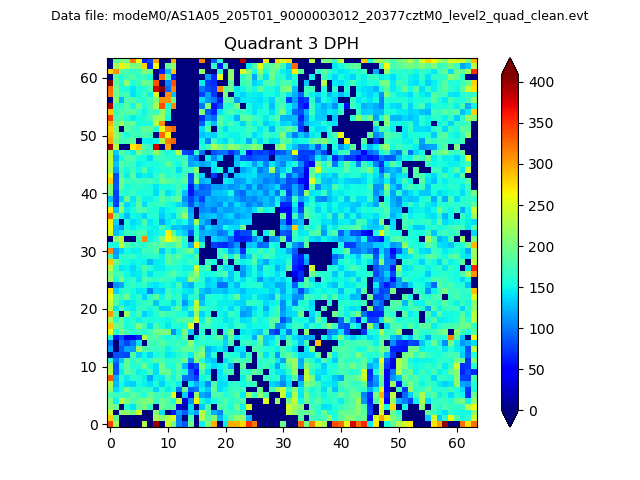 |
 |
Quadrant C |
| Plot type | Count rate plots | Images |
|---|---|---|
| Comparison with Poisson distribution Blue bars denote a histogram of data divided into 1 sec bins. Red curve is a Poisson curve with rate = median count rate of data. |
 |
 |
| Quadrant-wise count rates Data is divided into 100 sec bins |
 |
|
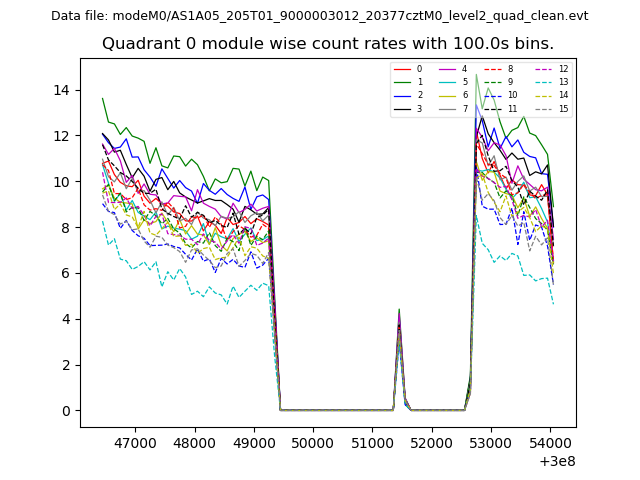
| Module-wise count rates for Quadrant A Data is divided into 100 sec bins |
 |
 |
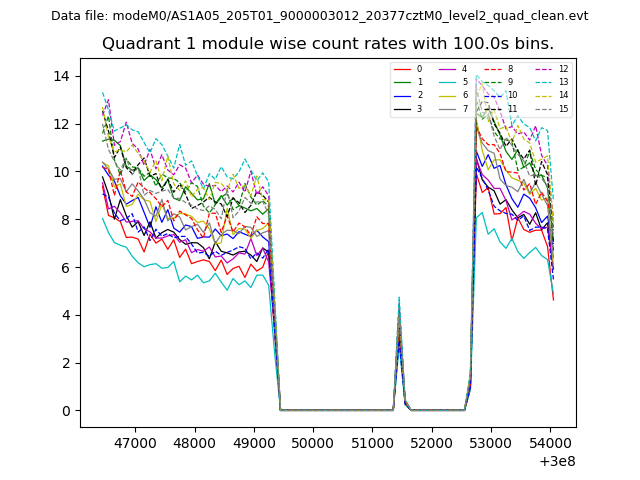
| Module-wise count rates for Quadrant B Data is divided into 100 sec bins |
 |
 |
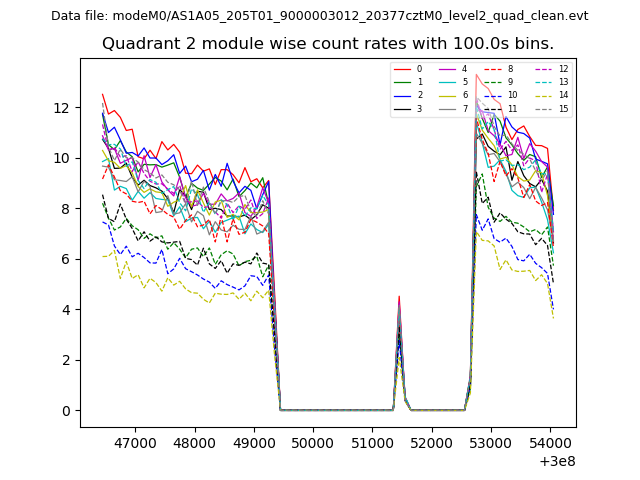
| Module-wise count rates for Quadrant C Data is divided into 100 sec bins |
 |
 |
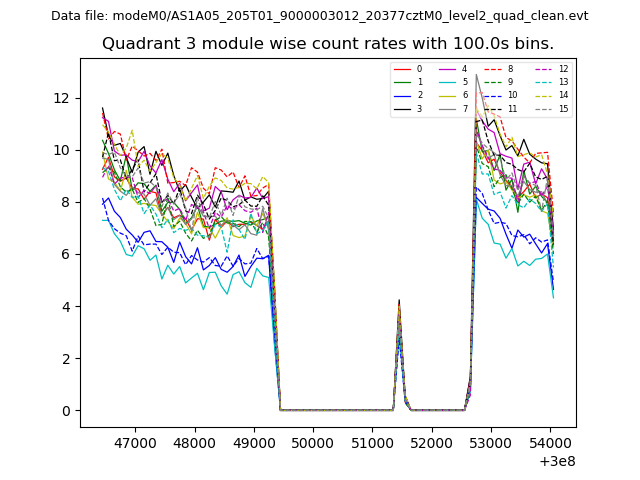
| Module-wise count rates for Quadrant D Data is divided into 100 sec bins |
 |
 |
| Parameter | Plot |
|---|---|
| CZT HV Monitor | 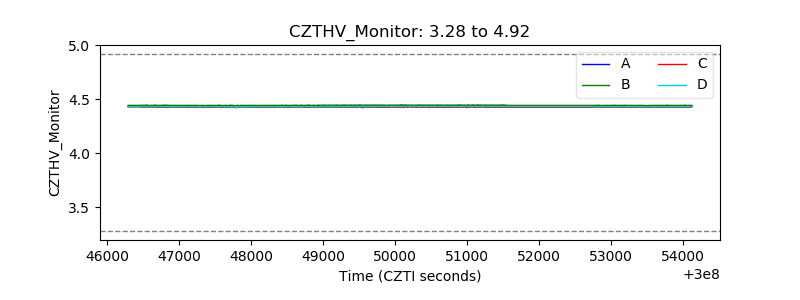 |
| D_VDD | 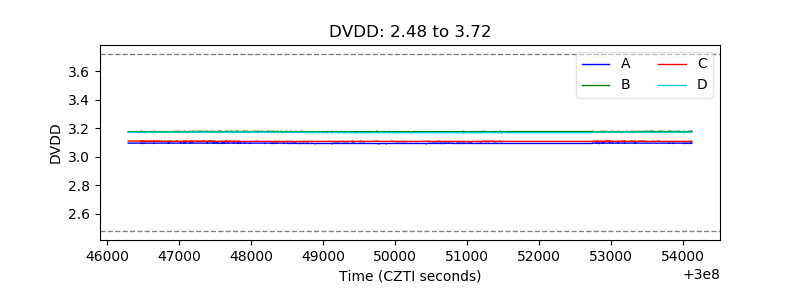 |
| Temperature 1 | 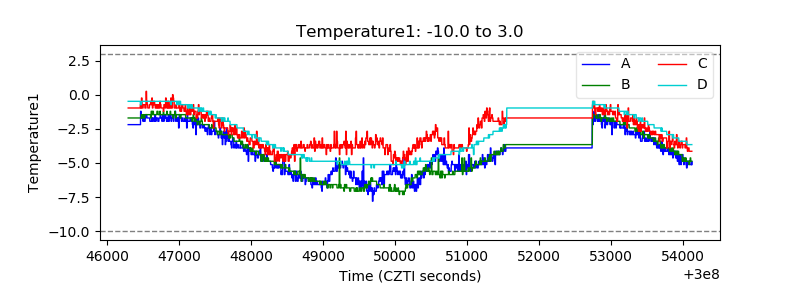 |
| Veto HV Monitor | 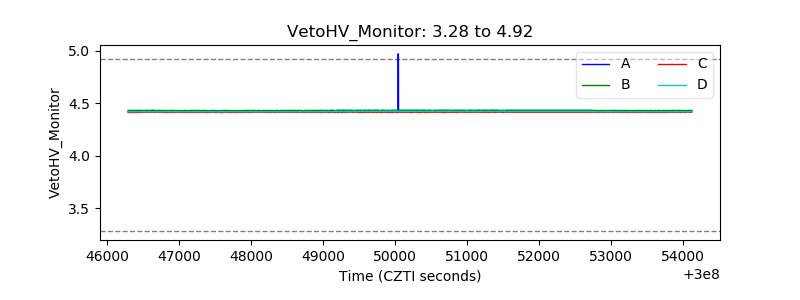 |
| Veto LLD | 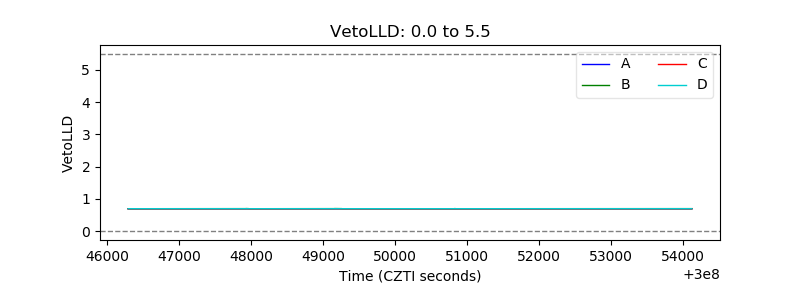 |
| Alpha Counter |  |
| _CPM_Rate |  |
| CZT Counter | 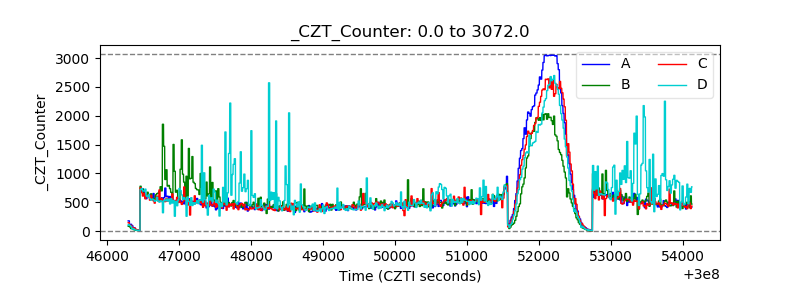 |
| +2.5 Volts monitor |  |
| +5 Volts monitor |  |
| _ROLL_ROT | 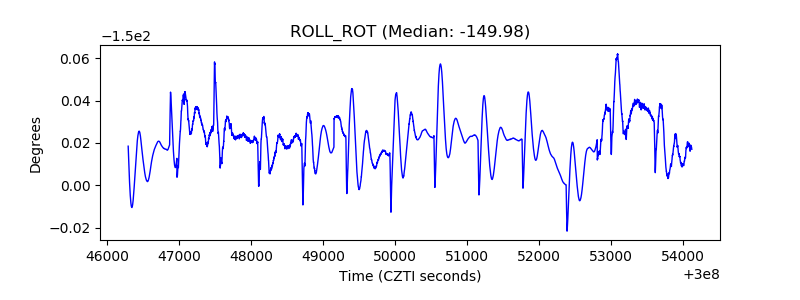 |
| _Roll_DEC | 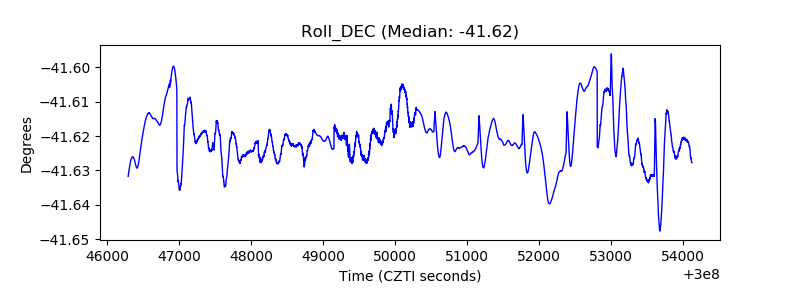 |
| _Roll_RA | 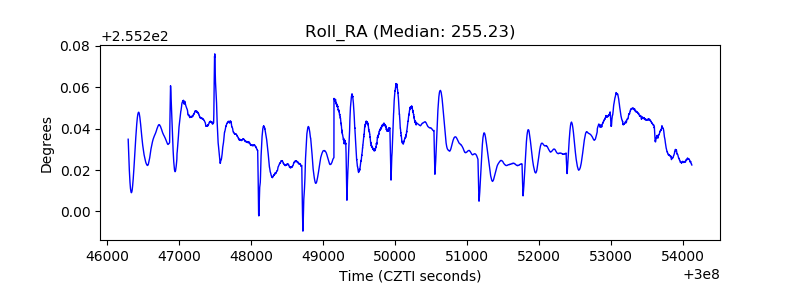 |
| Veto Counter | 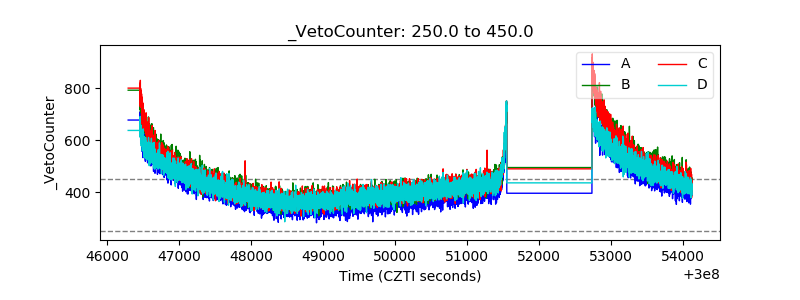 |