| Param | Original file | Final file |
|---|---|---|
| Filename | modeM0/AS1A05_205T01_9000003012_20378cztM0_level2.evt | modeM0/AS1A05_205T01_9000003012_20378cztM0_level2_quad_clean.evt |
| Size (bytes) | 449,579,520 | 94,521,600 |
| Size | 428.8 MB | 90.1 MB |
| Events in quadrant A | 3,088,456 | 620,046 |
| Events in quadrant B | 3,268,992 | 636,805 |
| Events in quadrant C | 3,070,631 | 598,269 |
| Events in quadrant D | 3,764,307 | 572,669 |
| Mode M9 | |||
|---|---|---|---|
| Quadrant | BADHDUFLAG | Total packets | Discarded packets |
| A | 0 | 19 | 0 |
| B | 0 | 20 | 0 |
| C | 0 | 20 | 0 |
| D | 0 | 20 | 0 |
| Mode SS | |||
|---|---|---|---|
| Quadrant | BADHDUFLAG | Total packets | Discarded packets |
| A | 0 | 128 | 0 |
| B | 0 | 128 | 0 |
| C | 0 | 128 | 0 |
| D | 0 | 128 | 0 |
| Mode M0 | |||
|---|---|---|---|
| Quadrant | BADHDUFLAG | Total packets | Discarded packets |
| A | 0 | 13220 | 2 |
| B | 0 | 13649 | 2 |
| C | 0 | 13046 | 2 |
| D | 0 | 15418 | 2 |
| Quadrant | Total seconds | Saturated seconds | Saturation percentage |
|---|---|---|---|
| A | 6223 | 30 | 0.482083% |
| B | 6223 | 52 | 0.835610% |
| C | 6223 | 42 | 0.674916% |
| D | 6223 | 57 | 0.915957% |
Noise dominated data is calculated using 1-second bins in cleaned event files. If a bin has >2000 counts, and if more than 50% of those come from <1% of pixels, then it is considered to be noise-dominated and hence unusable.
| Quadrant | # 1 sec bins | Bins with >0 counts | Bins with >2000 counts | High rate bins dominated by noise | Noise dominated (total time) | Noise dominated (detector-on time) | Marked lightcurve |
|---|---|---|---|---|---|---|---|
| A | 7488 | 6224 | 2 | 2 | 0.03% | 0.03% | 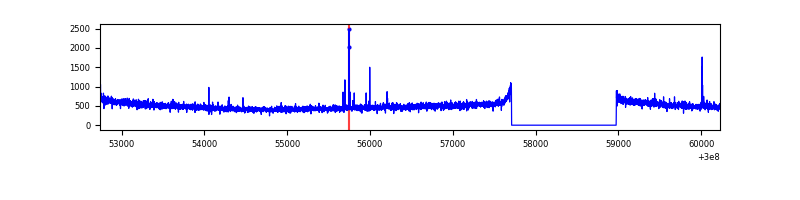 |
| B | 7488 | 6224 | 10 | 10 | 0.13% | 0.16% | 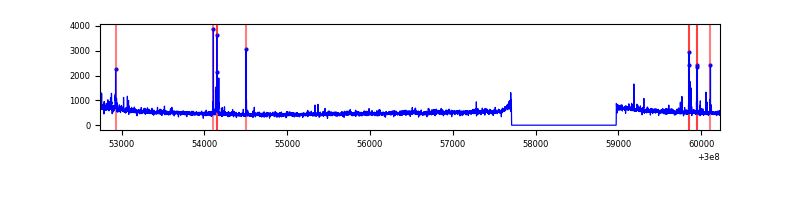 |
| C | 7488 | 6224 | 0 | 0 | 0.00% | 0.00% | 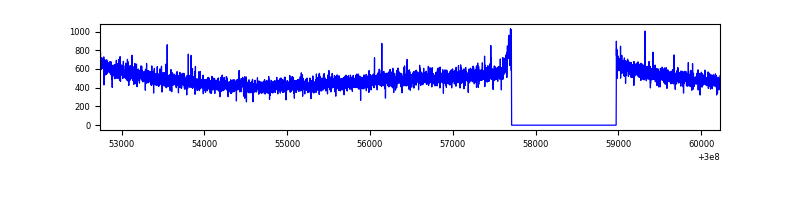 |
| D | 7488 | 6224 | 37 | 37 | 0.49% | 0.59% | 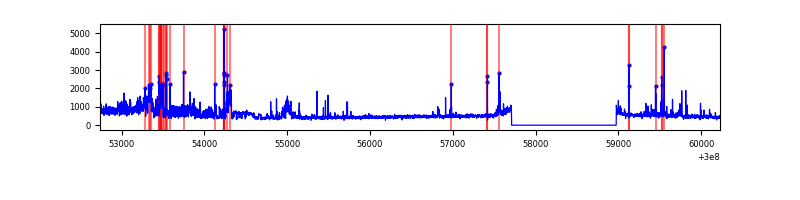 |
Top three noisy pixels from each quadrant. If the there are fewer than three noisy pixels in the level2.evt file, extra rows are filled as -1
| Pixel properties | Quadrant properties | ||||||
|---|---|---|---|---|---|---|---|
| Quadrant | DetID | PixID | Counts | Sigma | Mean | Median | Sigma |
| A | 5 | 16 | 28983 | 175.37 | 793 | 778 | 160.8 |
| A | 13 | 254 | 6990 | 38.62 | 793 | 778 | 160.8 |
| A | 0 | 226 | 6932 | 38.26 | 793 | 778 | 160.8 |
| B | 7 | 220 | 55362 | 363.16 | 798 | 780 | 150.3 |
| B | 15 | 222 | 21639 | 138.78 | 798 | 780 | 150.3 |
| B | 12 | 111 | 17200 | 109.25 | 798 | 780 | 150.3 |
| C | 14 | 238 | 118517 | 667.23 | 755 | 761 | 176.5 |
| C | 3 | 233 | 5864 | 28.91 | 755 | 761 | 176.5 |
| C | 13 | 61 | 5344 | 25.97 | 755 | 761 | 176.5 |
| D | 7 | 238 | 360161 | 1949.32 | 756 | 735 | 184.4 |
| D | 1 | 52 | 337886 | 1828.52 | 756 | 735 | 184.4 |
| D | 13 | 153 | 132903 | 716.8 | 756 | 735 | 184.4 |
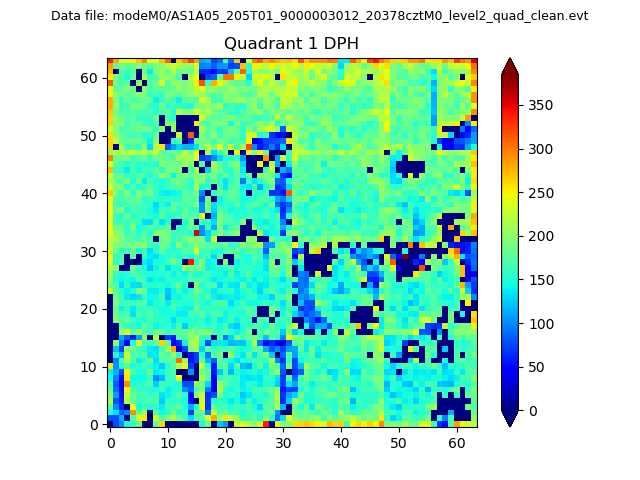
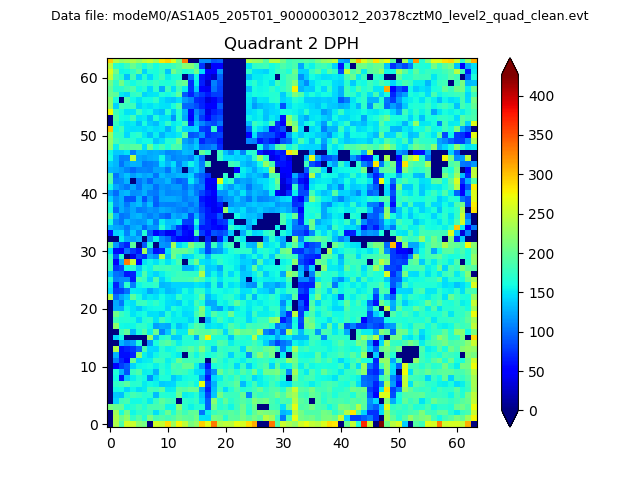
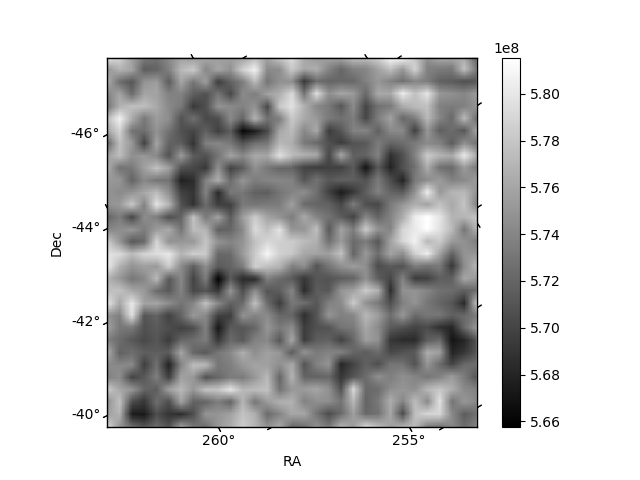
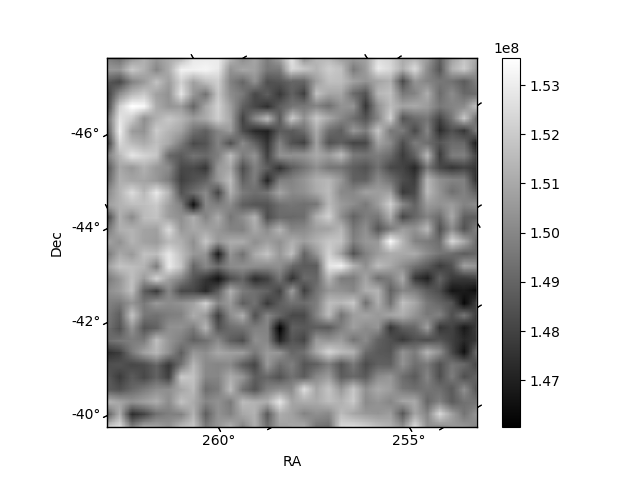
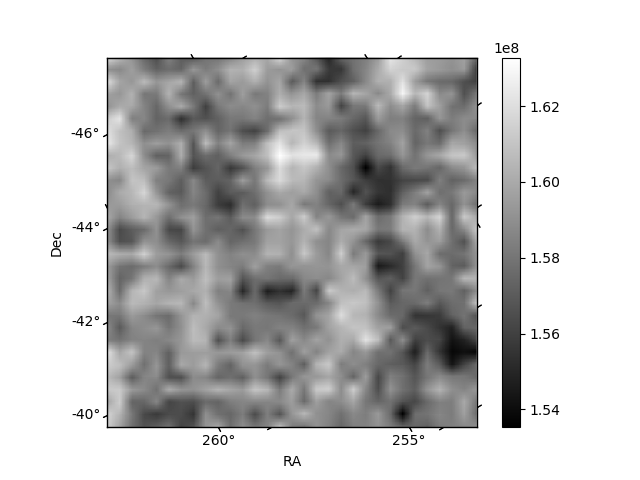
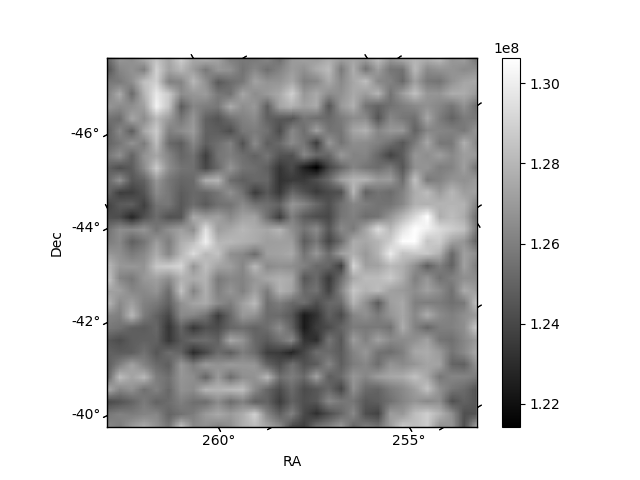
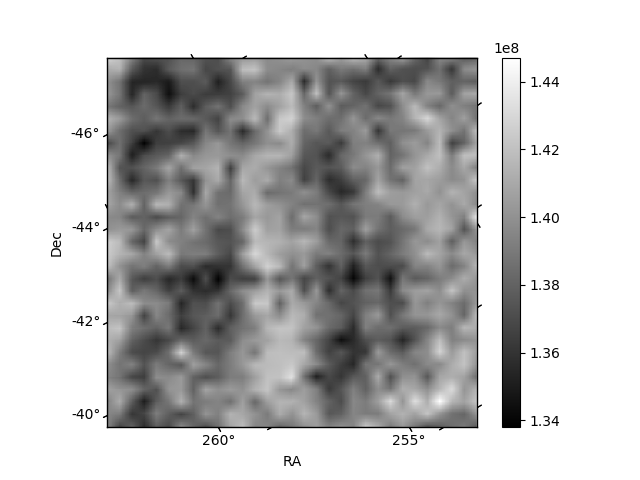
Histogram calculated using DETX and DETY for each event in the final _common_clean file
| Quadrant A |  |
 |
Quadrant B |
|---|---|---|---|
| Quadrant D | 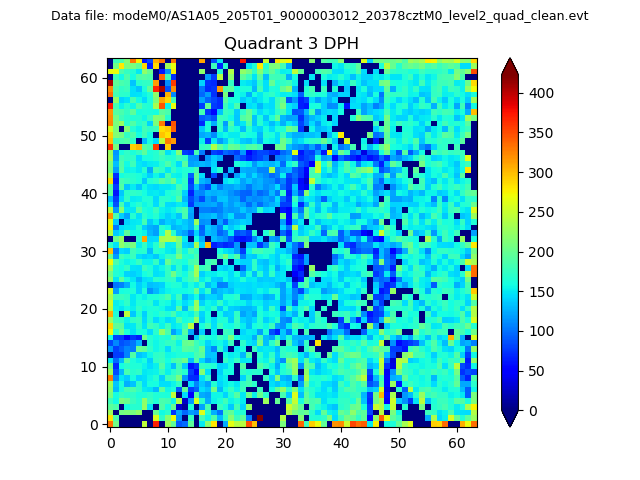 |
 |
Quadrant C |
| Plot type | Count rate plots | Images |
|---|---|---|
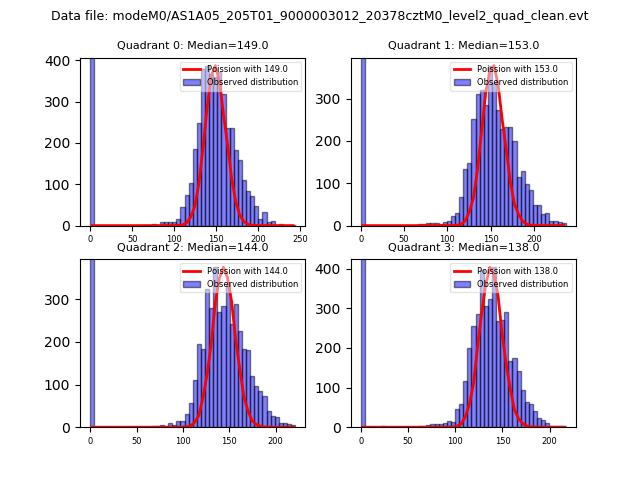
| Comparison with Poisson distribution Blue bars denote a histogram of data divided into 1 sec bins. Red curve is a Poisson curve with rate = median count rate of data. |
 |
 |
| Quadrant-wise count rates Data is divided into 100 sec bins |
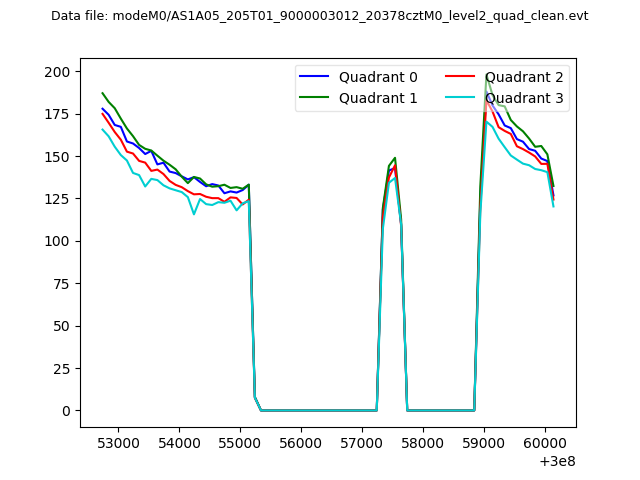 |
|
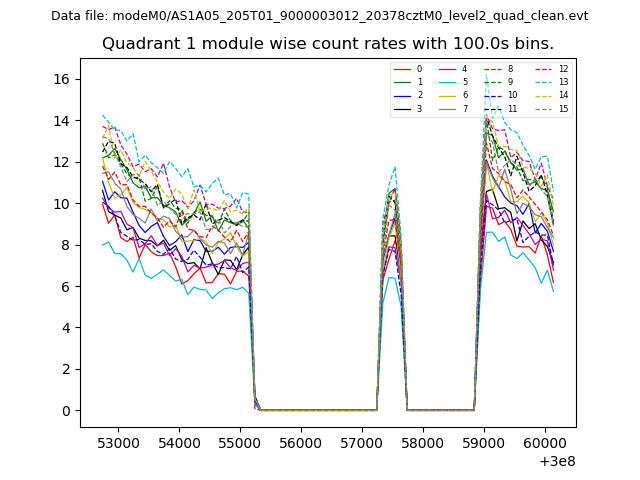
| Module-wise count rates for Quadrant A Data is divided into 100 sec bins |
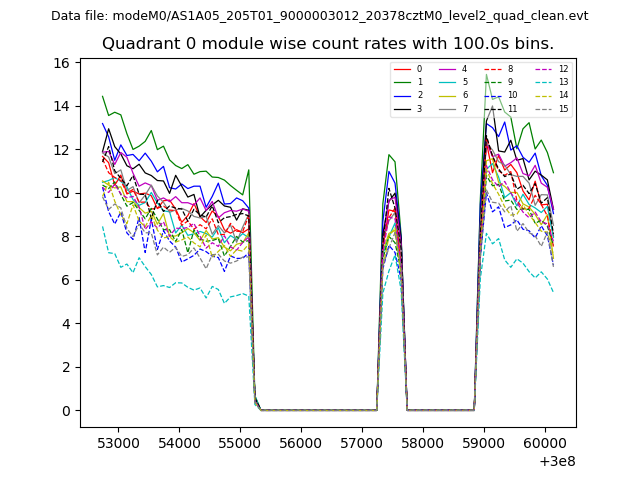 |
 |
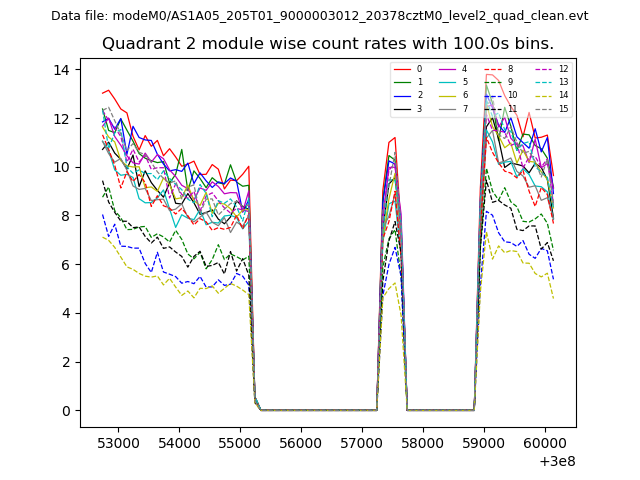
| Module-wise count rates for Quadrant B Data is divided into 100 sec bins |
 |
 |
| Module-wise count rates for Quadrant C Data is divided into 100 sec bins |
 |
 |
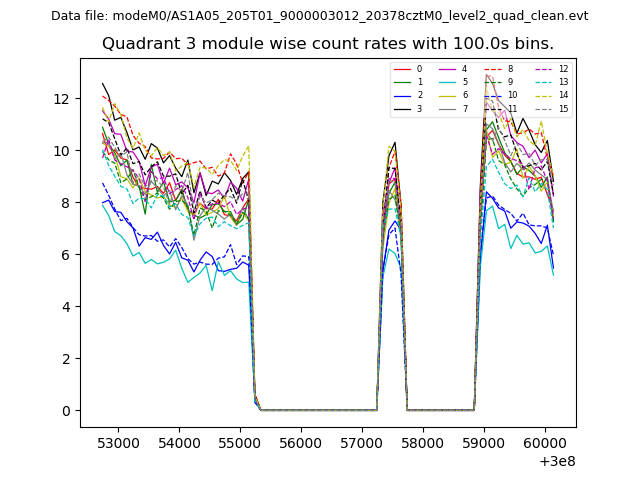
| Module-wise count rates for Quadrant D Data is divided into 100 sec bins |
 |
 |
| Parameter | Plot |
|---|---|
| CZT HV Monitor | 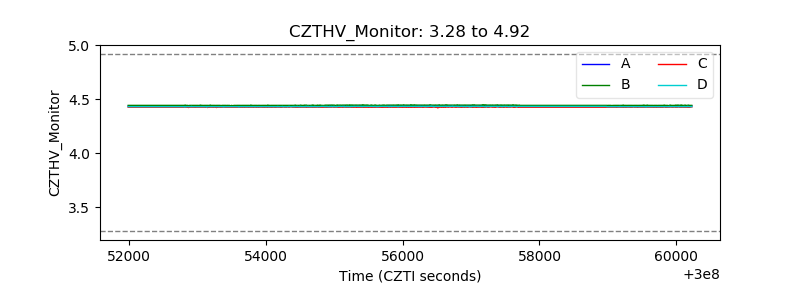 |
| D_VDD | 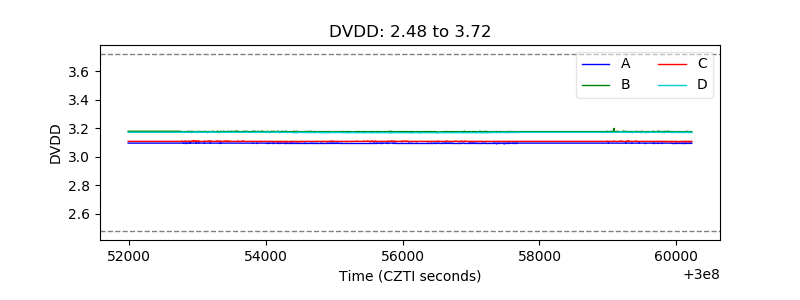 |
| Temperature 1 | 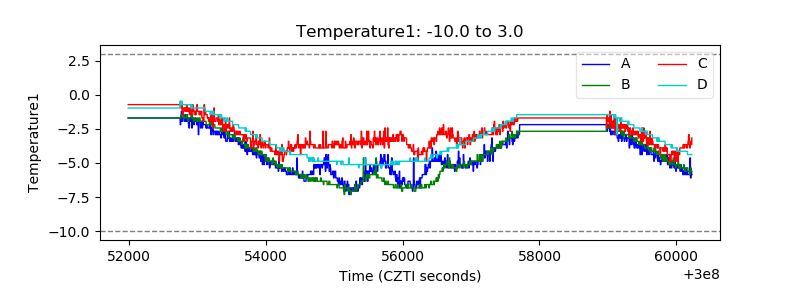 |
| Veto HV Monitor |  |
| Veto LLD | 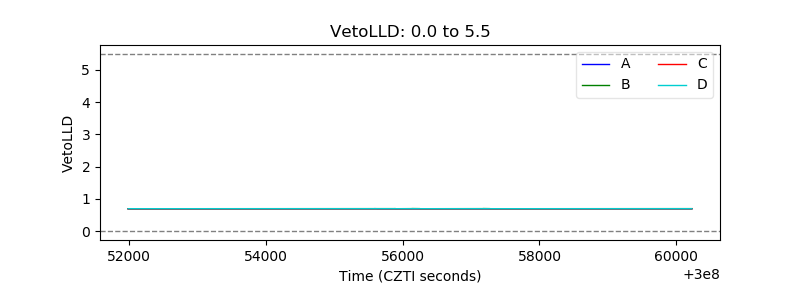 |
| Alpha Counter | 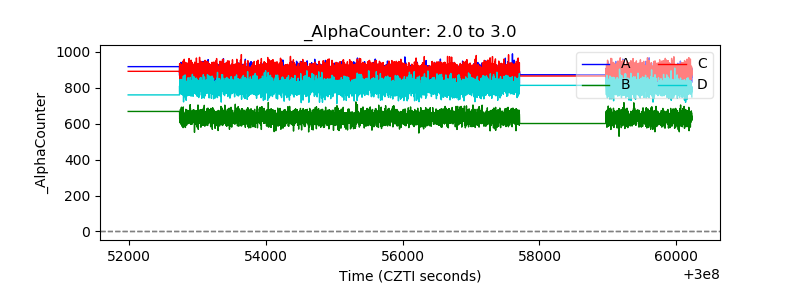 |
| _CPM_Rate | 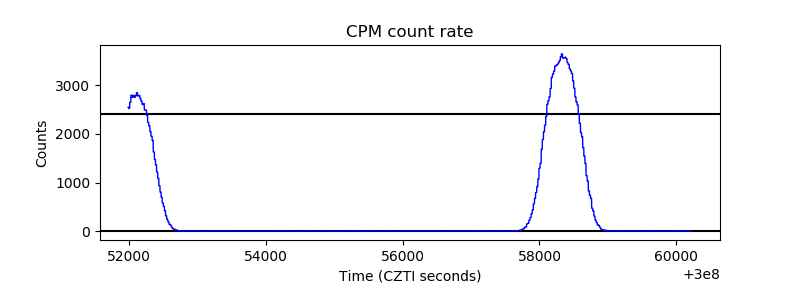 |
| CZT Counter | 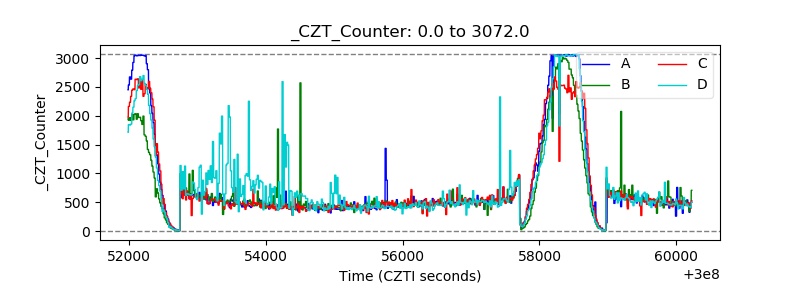 |
| +2.5 Volts monitor |  |
| +5 Volts monitor |  |
| _ROLL_ROT | 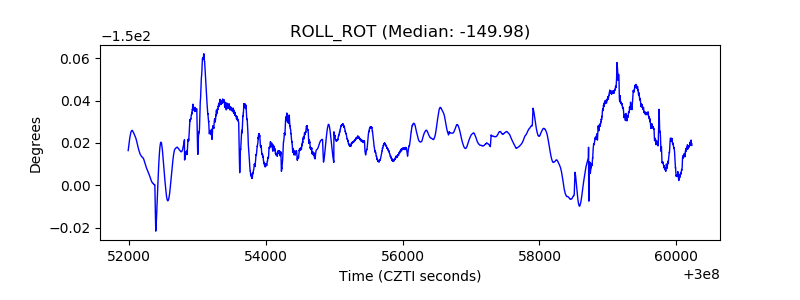 |
| _Roll_DEC | 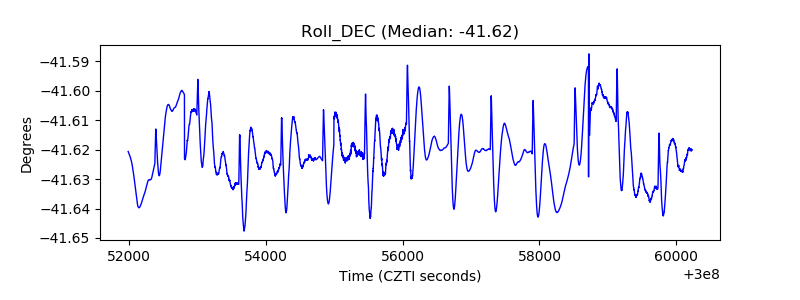 |
| _Roll_RA | 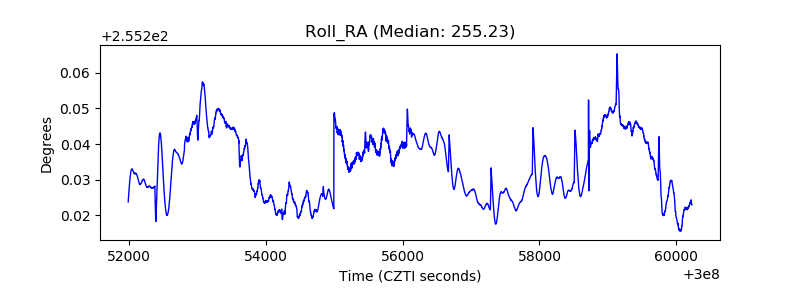 |
| Veto Counter | 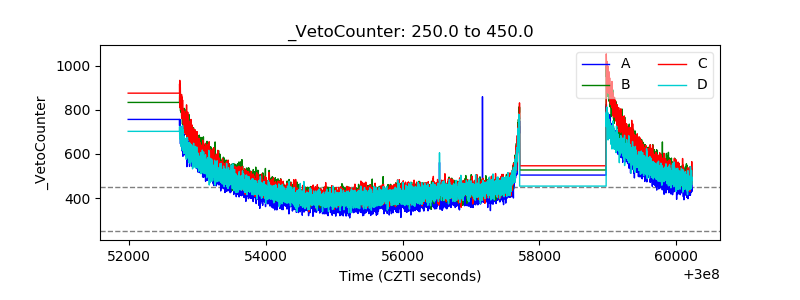 |