| Param | Original file | Final file |
|---|---|---|
| Filename | modeM0/AS1A05_205T01_9000003012_20379cztM0_level2.evt | modeM0/AS1A05_205T01_9000003012_20379cztM0_level2_quad_clean.evt |
| Size (bytes) | 428,457,600 | 94,893,120 |
| Size | 408.6 MB | 90.5 MB |
| Events in quadrant A | 3,057,394 | 619,470 |
| Events in quadrant B | 3,247,509 | 642,940 |
| Events in quadrant C | 3,091,676 | 607,779 |
| Events in quadrant D | 3,166,761 | 579,591 |
| Mode M9 | |||
|---|---|---|---|
| Quadrant | BADHDUFLAG | Total packets | Discarded packets |
| A | 0 | 17 | 0 |
| B | 0 | 18 | 0 |
| C | 0 | 18 | 0 |
| D | 0 | 18 | 0 |
| Mode SS | |||
|---|---|---|---|
| Quadrant | BADHDUFLAG | Total packets | Discarded packets |
| A | 0 | 124 | 0 |
| B | 0 | 122 | 0 |
| C | 0 | 122 | 0 |
| D | 0 | 122 | 0 |
| Mode M0 | |||
|---|---|---|---|
| Quadrant | BADHDUFLAG | Total packets | Discarded packets |
| A | 0 | 12903 | 2 |
| B | 0 | 13367 | 2 |
| C | 0 | 12867 | 2 |
| D | 0 | 13451 | 2 |
| Quadrant | Total seconds | Saturated seconds | Saturation percentage |
|---|---|---|---|
| A | 6074 | 16 | 0.263418% |
| B | 6074 | 54 | 0.889035% |
| C | 6073 | 42 | 0.691586% |
| D | 6073 | 35 | 0.576321% |
Noise dominated data is calculated using 1-second bins in cleaned event files. If a bin has >2000 counts, and if more than 50% of those come from <1% of pixels, then it is considered to be noise-dominated and hence unusable.
| Quadrant | # 1 sec bins | Bins with >0 counts | Bins with >2000 counts | High rate bins dominated by noise | Noise dominated (total time) | Noise dominated (detector-on time) | Marked lightcurve |
|---|---|---|---|---|---|---|---|
| A | 7414 | 6075 | 1 | 1 | 0.01% | 0.02% | 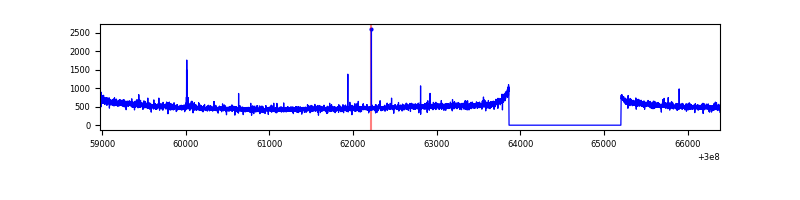 |
| B | 7414 | 6075 | 13 | 13 | 0.18% | 0.21% | 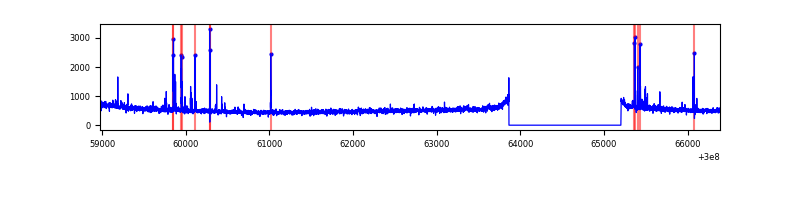 |
| C | 7413 | 6074 | 0 | 0 | 0.00% | 0.00% | 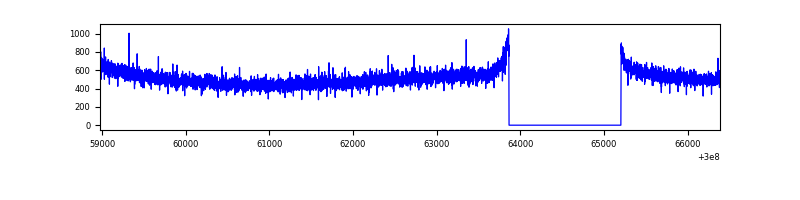 |
| D | 7413 | 6074 | 13 | 13 | 0.18% | 0.21% | 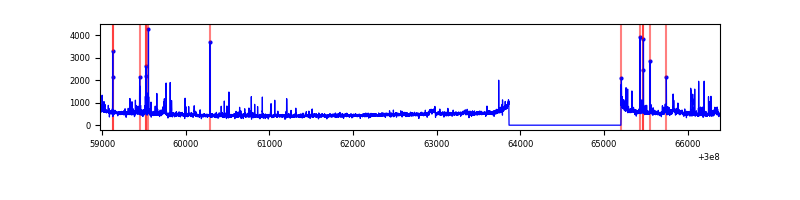 |
Top three noisy pixels from each quadrant. If the there are fewer than three noisy pixels in the level2.evt file, extra rows are filled as -1
| Pixel properties | Quadrant properties | ||||||
|---|---|---|---|---|---|---|---|
| Quadrant | DetID | PixID | Counts | Sigma | Mean | Median | Sigma |
| A | 5 | 16 | 16399 | 98.97 | 788 | 774 | 157.9 |
| A | 0 | 226 | 6900 | 38.8 | 788 | 774 | 157.9 |
| A | 13 | 254 | 6630 | 37.09 | 788 | 774 | 157.9 |
| B | 7 | 220 | 50456 | 334.01 | 799 | 782 | 148.7 |
| B | 15 | 222 | 20362 | 131.65 | 799 | 782 | 148.7 |
| B | 12 | 111 | 17390 | 111.67 | 799 | 782 | 148.7 |
| C | 14 | 238 | 120744 | 684.47 | 758 | 764 | 175.3 |
| C | 3 | 233 | 8748 | 45.55 | 758 | 764 | 175.3 |
| C | 1 | 16 | 6762 | 34.22 | 758 | 764 | 175.3 |
| D | 1 | 52 | 134261 | 730.26 | 756 | 736 | 182.8 |
| D | 13 | 153 | 65286 | 353.03 | 756 | 736 | 182.8 |
| D | 2 | 234 | 31736 | 169.54 | 756 | 736 | 182.8 |
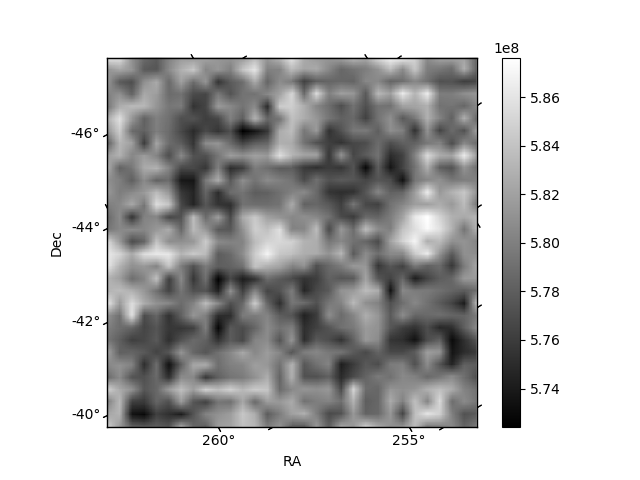
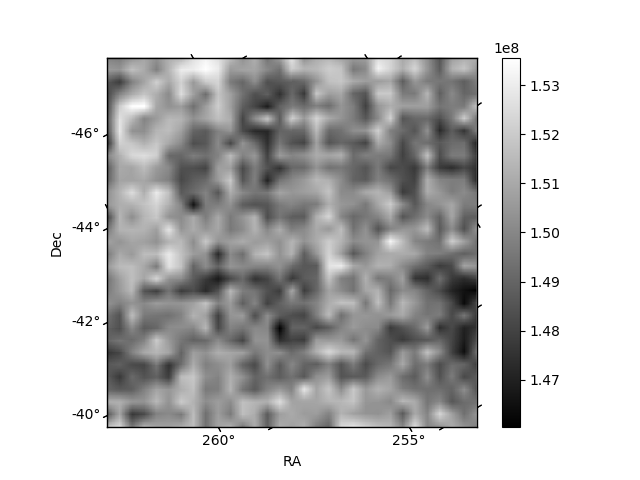
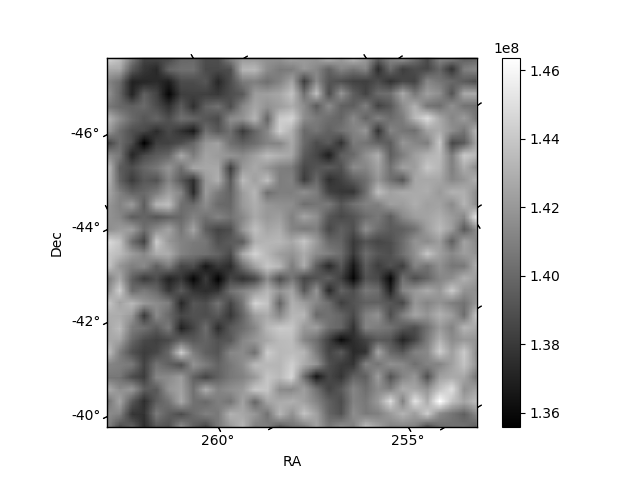
Histogram calculated using DETX and DETY for each event in the final _common_clean file
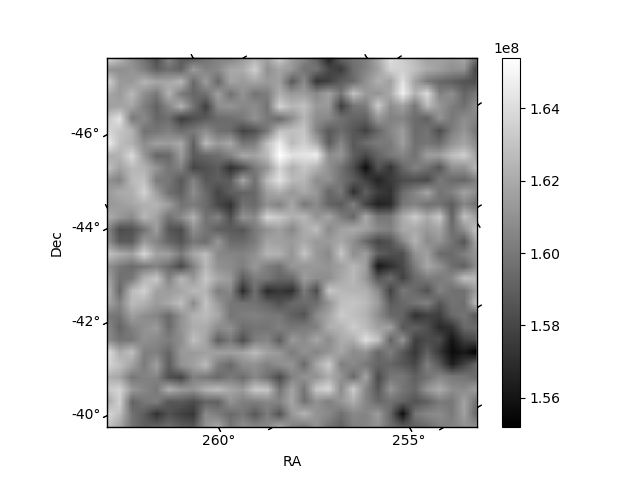
| Quadrant A | 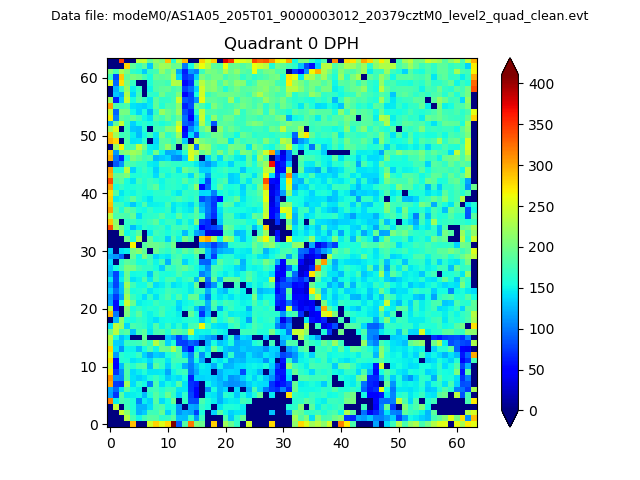 |
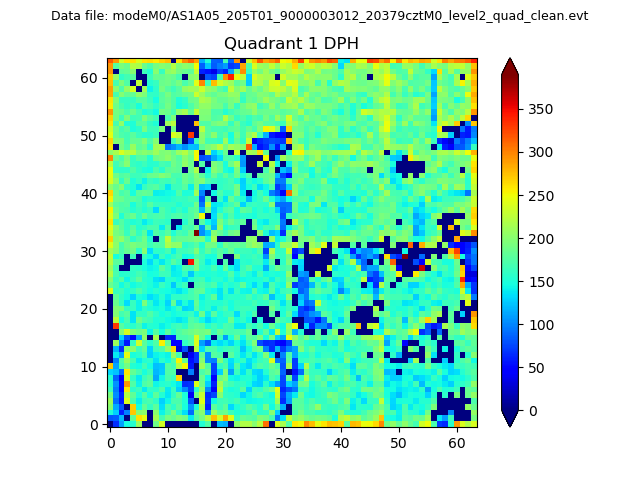 |
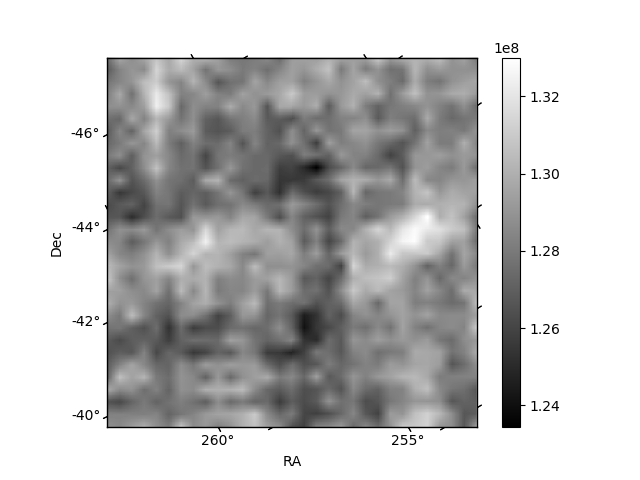
Quadrant B |
|---|---|---|---|
| Quadrant D |  |
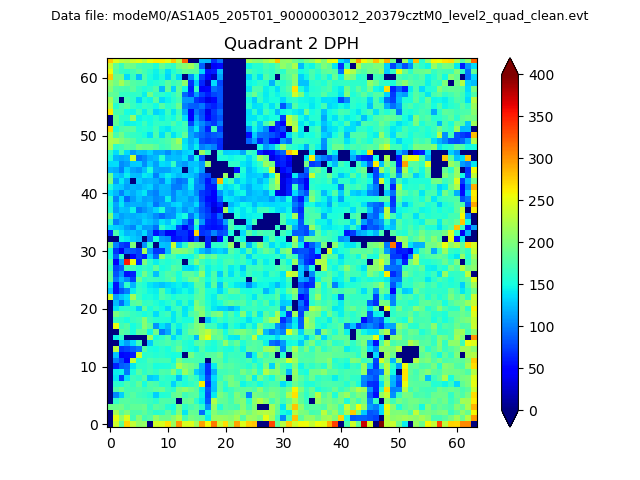 |
Quadrant C |
| Plot type | Count rate plots | Images |
|---|---|---|
| Comparison with Poisson distribution Blue bars denote a histogram of data divided into 1 sec bins. Red curve is a Poisson curve with rate = median count rate of data. |
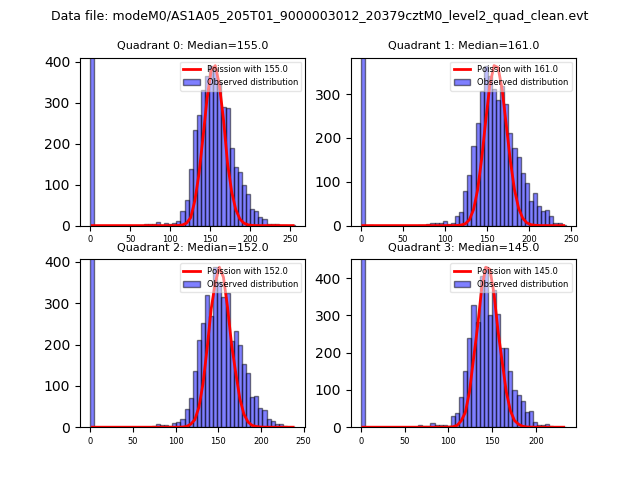 |
 |
| Quadrant-wise count rates Data is divided into 100 sec bins |
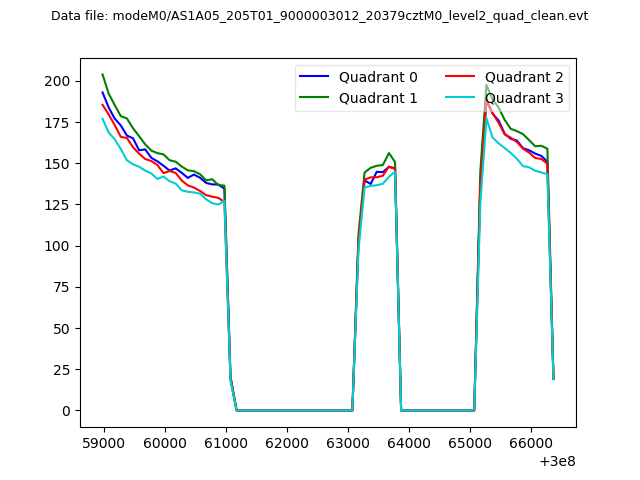 |
|
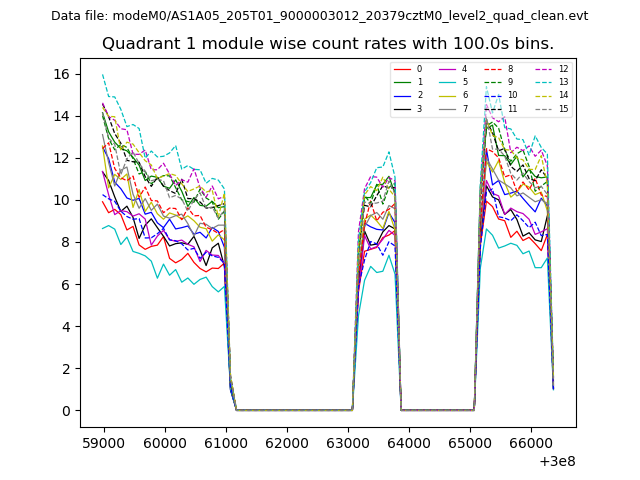
| Module-wise count rates for Quadrant A Data is divided into 100 sec bins |
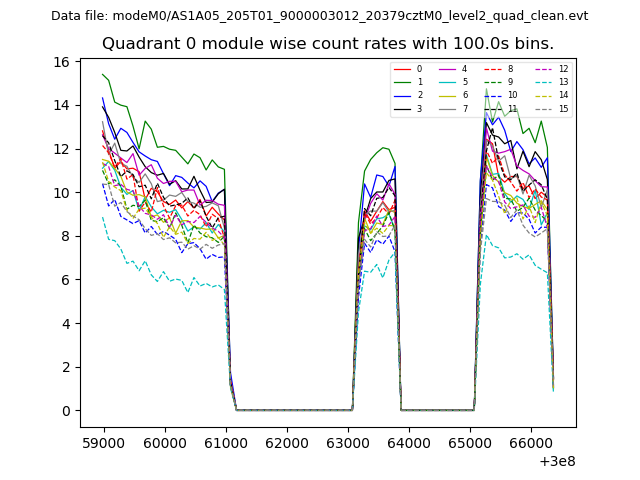 |
 |
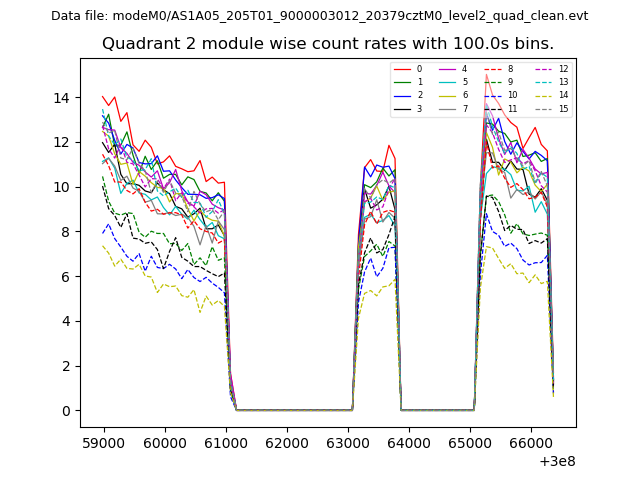
| Module-wise count rates for Quadrant B Data is divided into 100 sec bins |
 |
 |
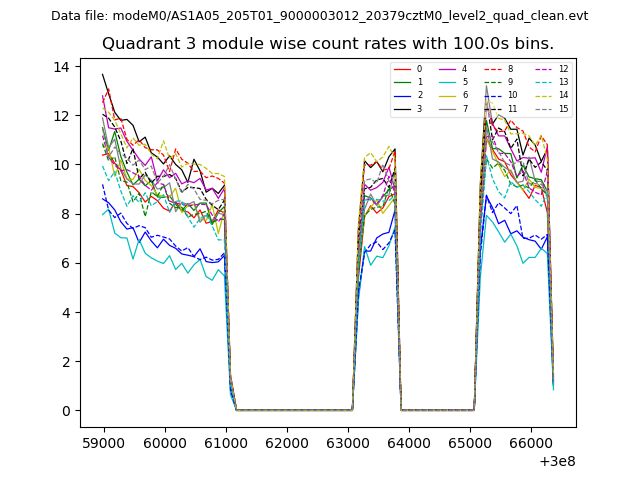
| Module-wise count rates for Quadrant C Data is divided into 100 sec bins |
 |
 |
| Module-wise count rates for Quadrant D Data is divided into 100 sec bins |
 |
 |
| Parameter | Plot |
|---|---|
| CZT HV Monitor | 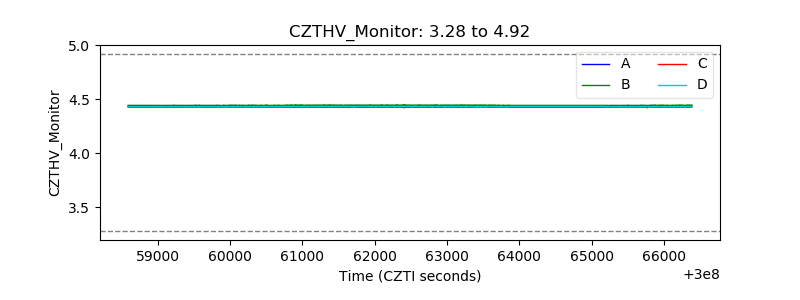 |
| D_VDD | 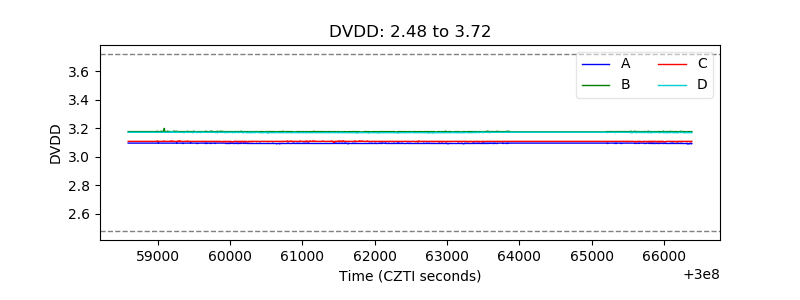 |
| Temperature 1 | 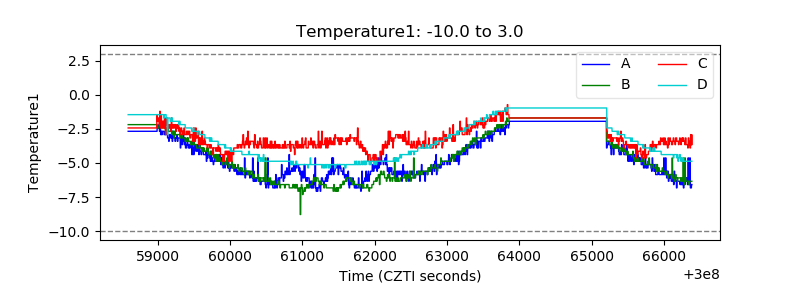 |
| Veto HV Monitor | 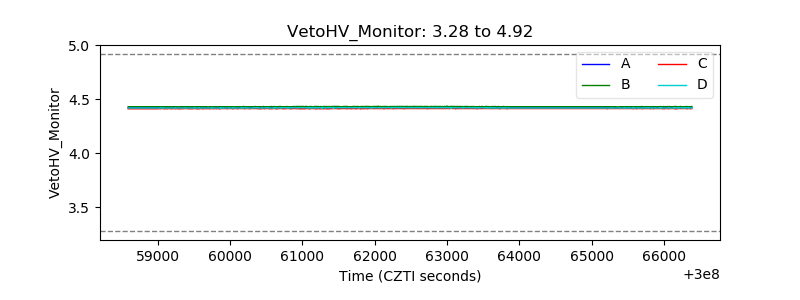 |
| Veto LLD | 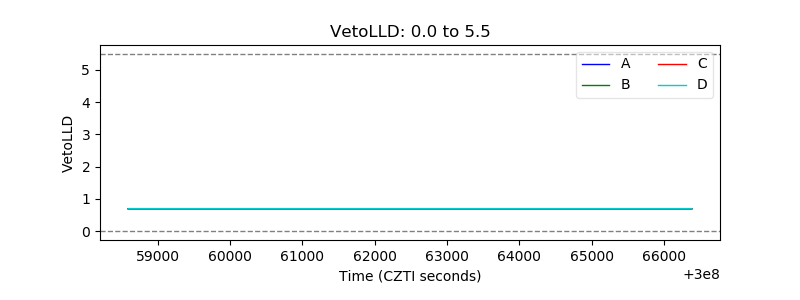 |
| Alpha Counter | 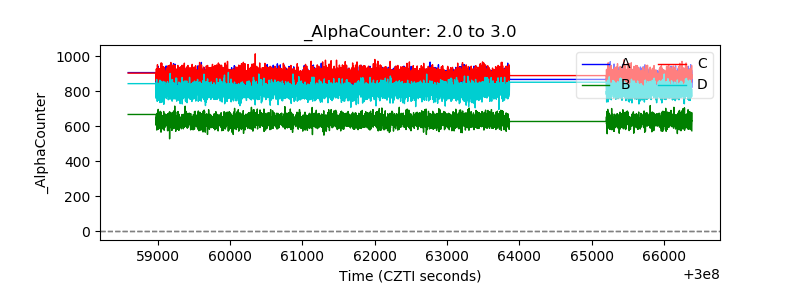 |
| _CPM_Rate |  |
| CZT Counter | 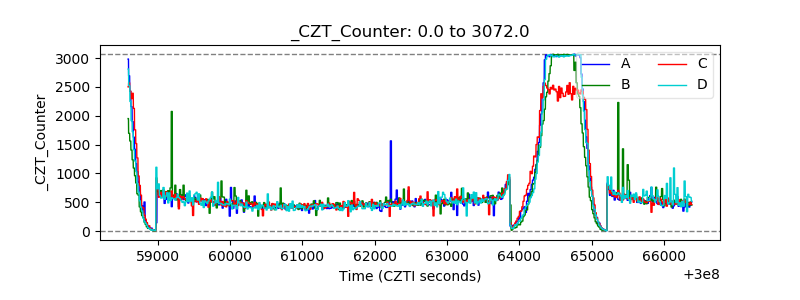 |
| +2.5 Volts monitor |  |
| +5 Volts monitor | 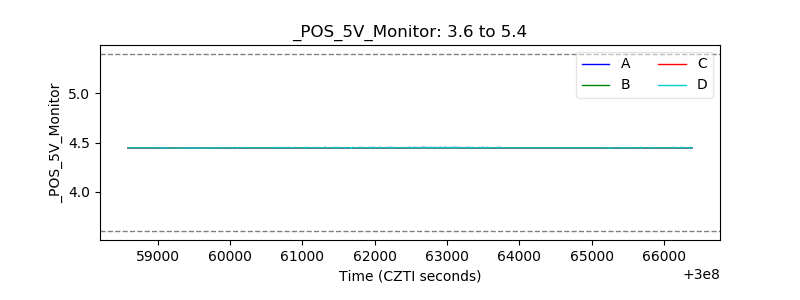 |
| _ROLL_ROT | 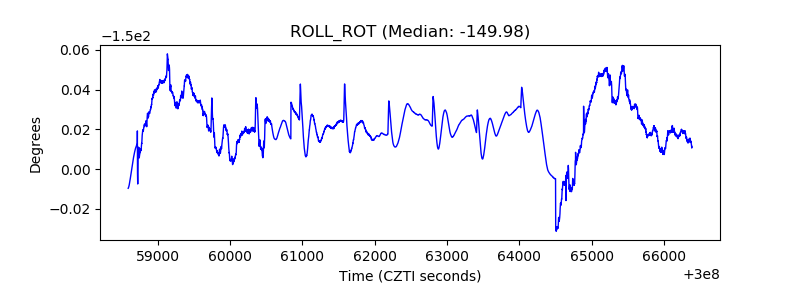 |
| _Roll_DEC | 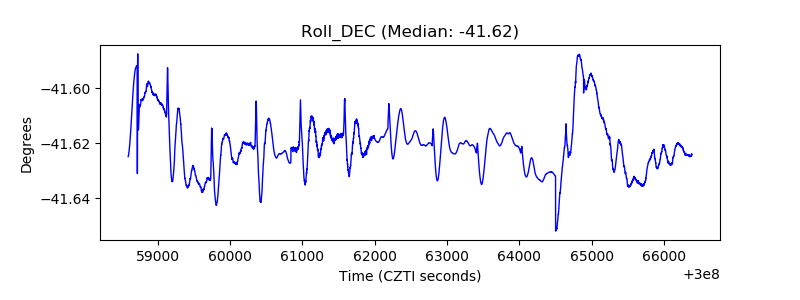 |
| _Roll_RA | 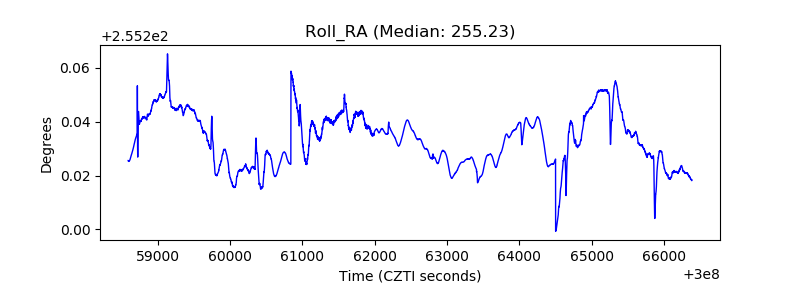 |
| Veto Counter | 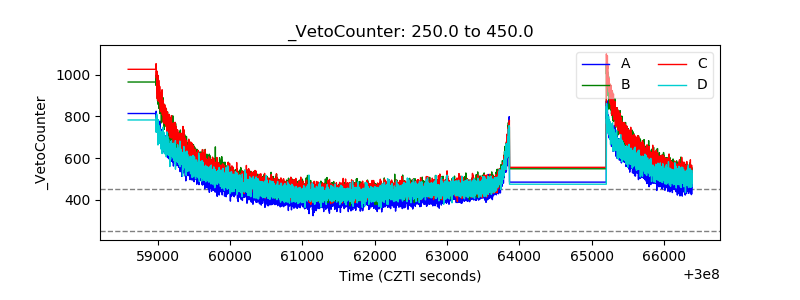 |