| Param | Original file | Final file |
|---|---|---|
| Filename | modeM0/AS1A05_205T01_9000003012_20380cztM0_level2.evt | modeM0/AS1A05_205T01_9000003012_20380cztM0_level2_quad_clean.evt |
| Size (bytes) | 441,740,160 | 96,546,240 |
| Size | 421.3 MB | 92.1 MB |
| Events in quadrant A | 3,084,327 | 629,421 |
| Events in quadrant B | 3,304,909 | 651,911 |
| Events in quadrant C | 3,163,413 | 623,416 |
| Events in quadrant D | 3,409,257 | 591,379 |
| Mode M9 | |||
|---|---|---|---|
| Quadrant | BADHDUFLAG | Total packets | Discarded packets |
| A | 0 | 26 | 0 |
| B | 0 | 27 | 0 |
| C | 0 | 27 | 0 |
| D | 0 | 27 | 0 |
| Mode SS | |||
|---|---|---|---|
| Quadrant | BADHDUFLAG | Total packets | Discarded packets |
| A | 0 | 124 | 0 |
| B | 0 | 124 | 0 |
| C | 0 | 124 | 0 |
| D | 0 | 124 | 0 |
| Mode M0 | |||
|---|---|---|---|
| Quadrant | BADHDUFLAG | Total packets | Discarded packets |
| A | 0 | 12878 | 2 |
| B | 0 | 13388 | 2 |
| C | 0 | 12930 | 2 |
| D | 0 | 14121 | 2 |
| Quadrant | Total seconds | Saturated seconds | Saturation percentage |
|---|---|---|---|
| A | 6128 | 19 | 0.310052% |
| B | 6128 | 86 | 1.403394% |
| C | 6128 | 41 | 0.669060% |
| D | 6127 | 41 | 0.669169% |
Noise dominated data is calculated using 1-second bins in cleaned event files. If a bin has >2000 counts, and if more than 50% of those come from <1% of pixels, then it is considered to be noise-dominated and hence unusable.
| Quadrant | # 1 sec bins | Bins with >0 counts | Bins with >2000 counts | High rate bins dominated by noise | Noise dominated (total time) | Noise dominated (detector-on time) | Marked lightcurve |
|---|---|---|---|---|---|---|---|
| A | 7518 | 6129 | 0 | 0 | 0.00% | 0.00% | 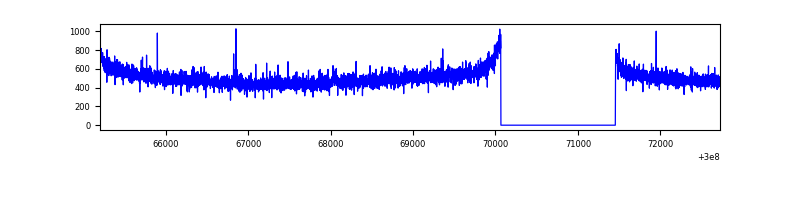 |
| B | 7518 | 6129 | 9 | 9 | 0.12% | 0.15% | 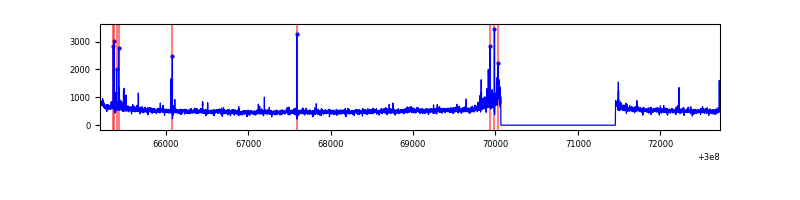 |
| C | 7518 | 6129 | 0 | 0 | 0.00% | 0.00% | 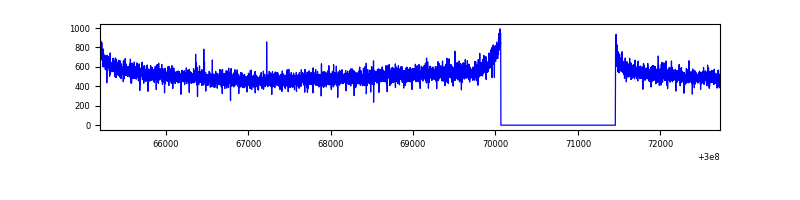 |
| D | 7517 | 6128 | 20 | 20 | 0.27% | 0.33% | 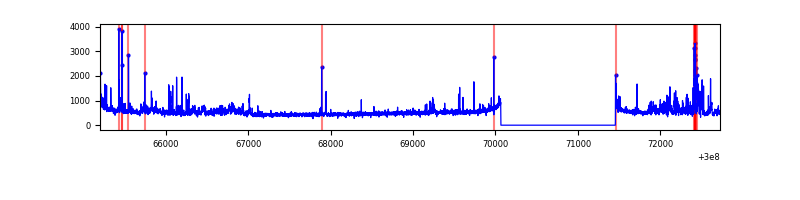 |
Top three noisy pixels from each quadrant. If the there are fewer than three noisy pixels in the level2.evt file, extra rows are filled as -1
| Pixel properties | Quadrant properties | ||||||
|---|---|---|---|---|---|---|---|
| Quadrant | DetID | PixID | Counts | Sigma | Mean | Median | Sigma |
| A | 9 | 143 | 9139 | 52.21 | 797 | 784 | 160.0 |
| A | 0 | 226 | 6991 | 38.79 | 797 | 784 | 160.0 |
| A | 13 | 254 | 6682 | 36.86 | 797 | 784 | 160.0 |
| B | 7 | 220 | 83849 | 555.06 | 806 | 789 | 149.6 |
| B | 12 | 111 | 17564 | 112.1 | 806 | 789 | 149.6 |
| B | 0 | 198 | 16813 | 107.08 | 806 | 789 | 149.6 |
| C | 14 | 238 | 124221 | 687.28 | 777 | 786 | 179.6 |
| C | 1 | 16 | 5566 | 26.61 | 777 | 786 | 179.6 |
| C | 13 | 61 | 5488 | 26.18 | 777 | 786 | 179.6 |
| D | 1 | 52 | 290818 | 1544.7 | 771 | 750 | 187.8 |
| D | 13 | 153 | 118592 | 627.54 | 771 | 750 | 187.8 |
| D | 2 | 234 | 31237 | 162.35 | 771 | 750 | 187.8 |
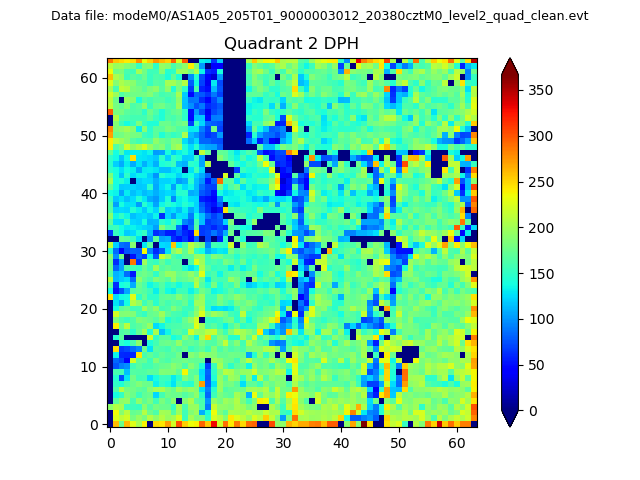
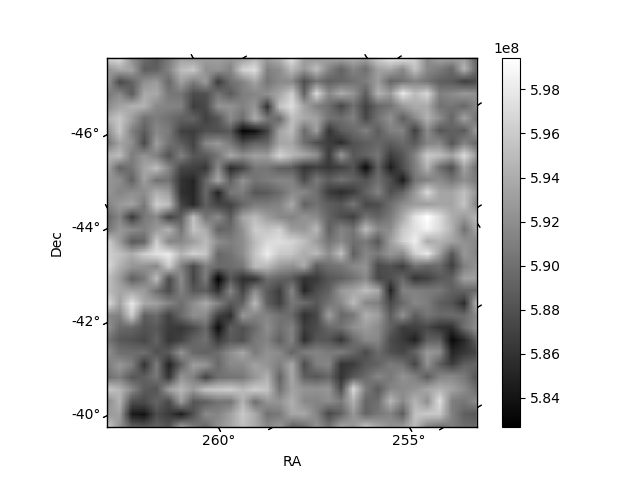
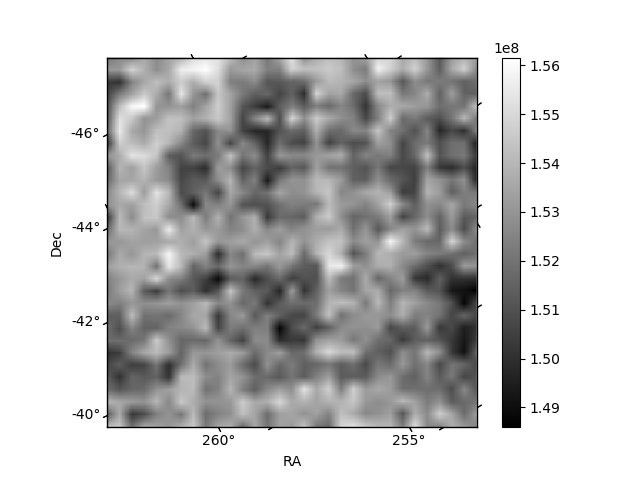
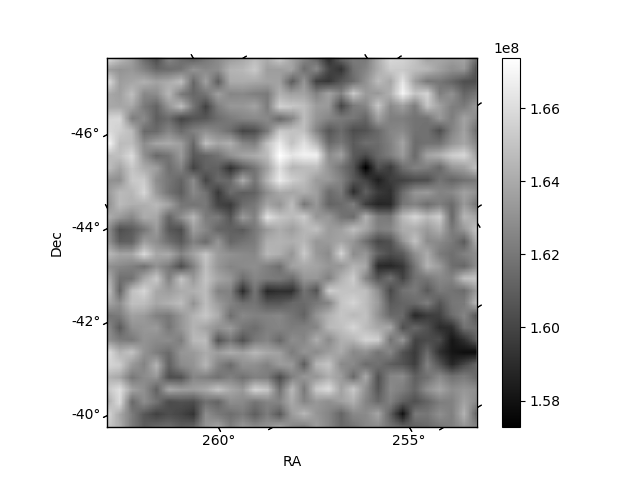
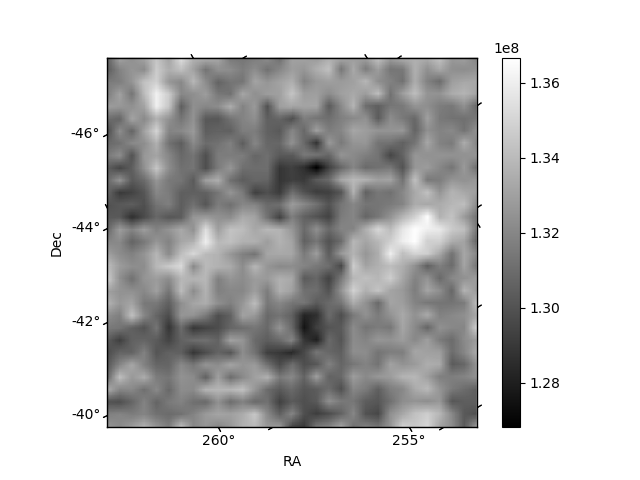
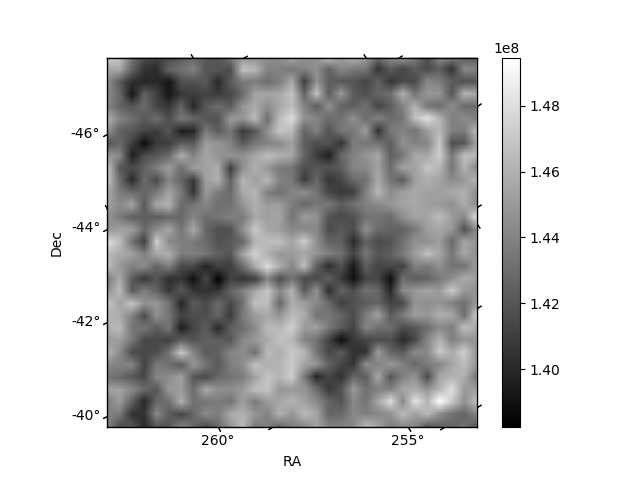
Histogram calculated using DETX and DETY for each event in the final _common_clean file
| Quadrant A | 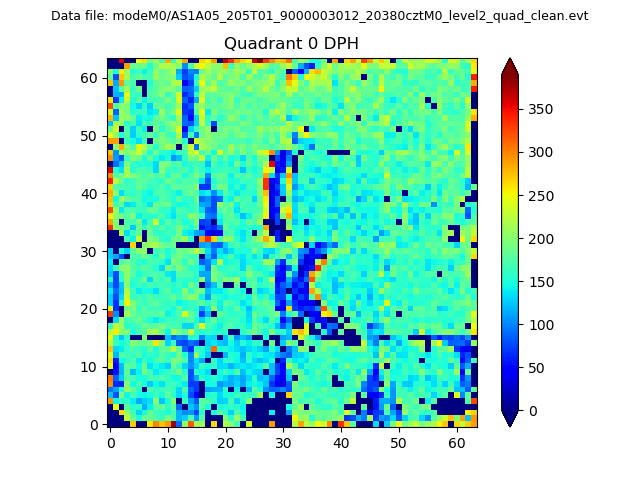 |
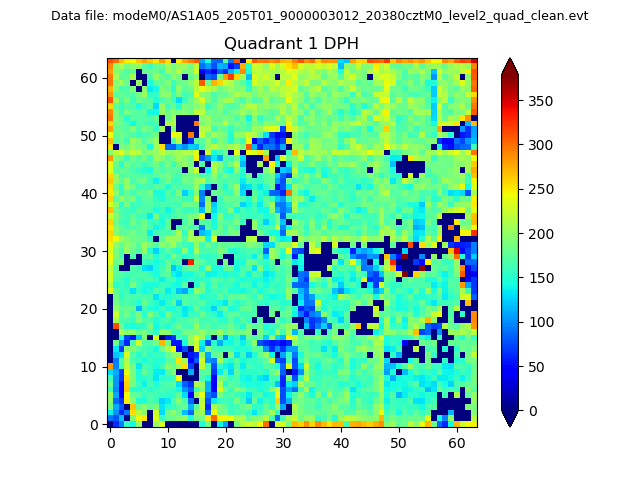 |
Quadrant B |
|---|---|---|---|
| Quadrant D | 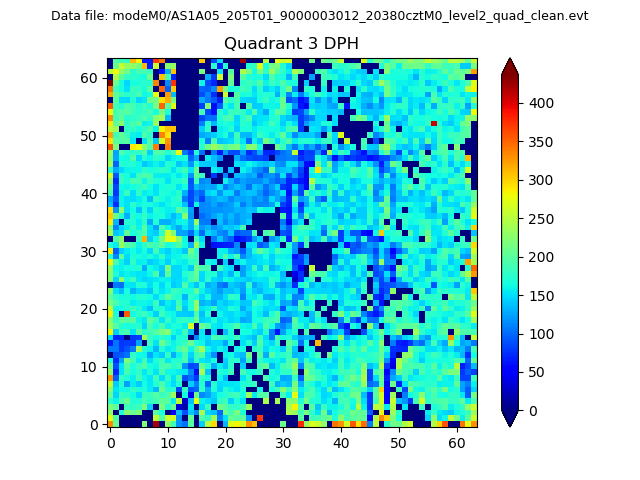 |
 |
Quadrant C |
| Plot type | Count rate plots | Images |
|---|---|---|
| Comparison with Poisson distribution Blue bars denote a histogram of data divided into 1 sec bins. Red curve is a Poisson curve with rate = median count rate of data. |
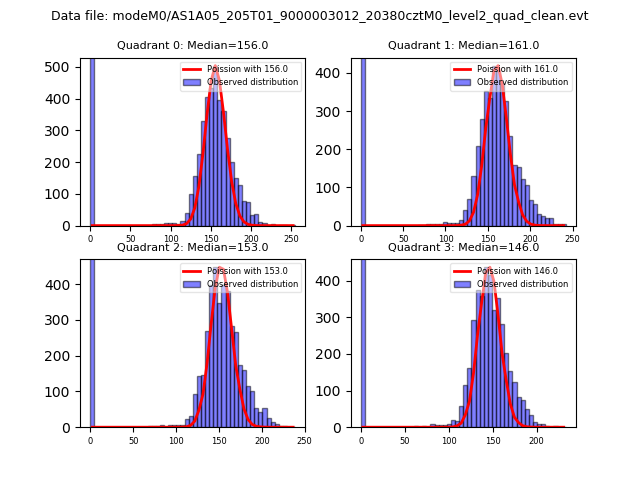 |
 |
| Quadrant-wise count rates Data is divided into 100 sec bins |
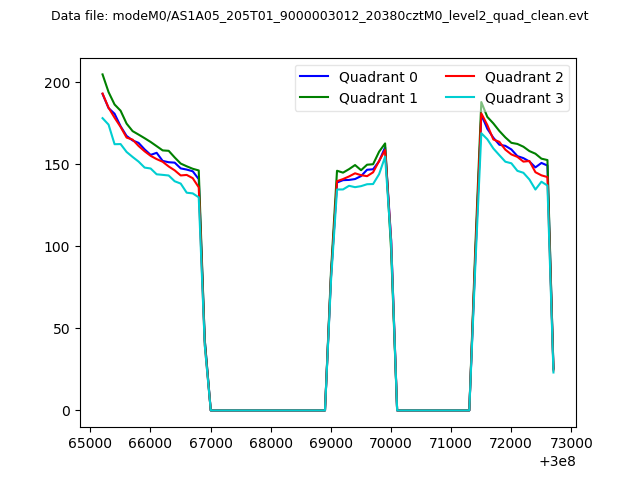 |
|
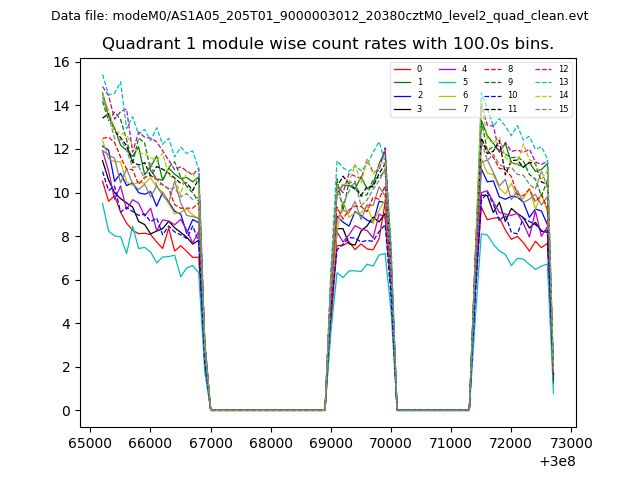
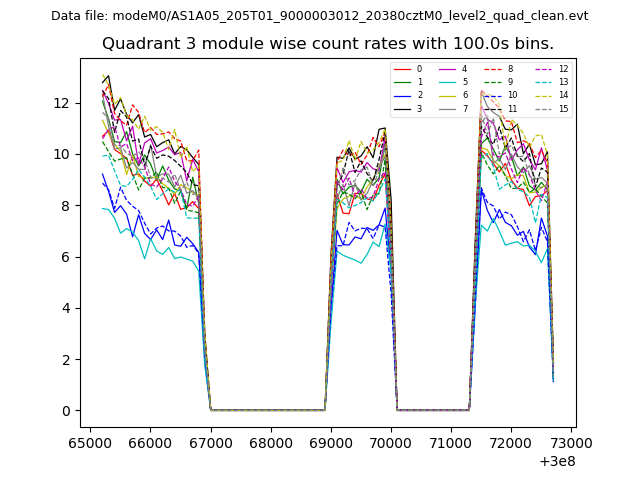
| Module-wise count rates for Quadrant A Data is divided into 100 sec bins |
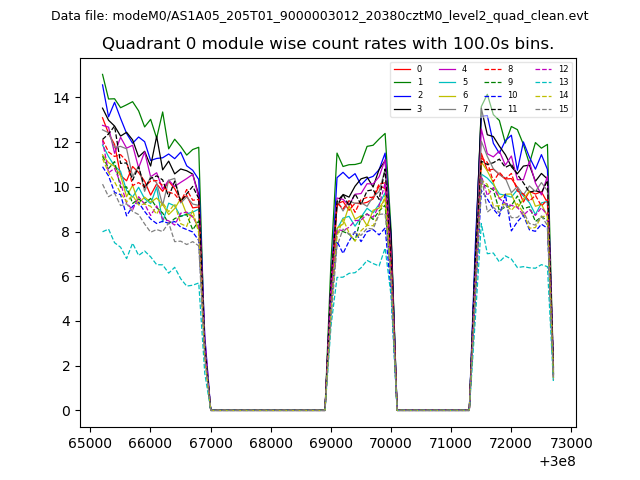 |
 |
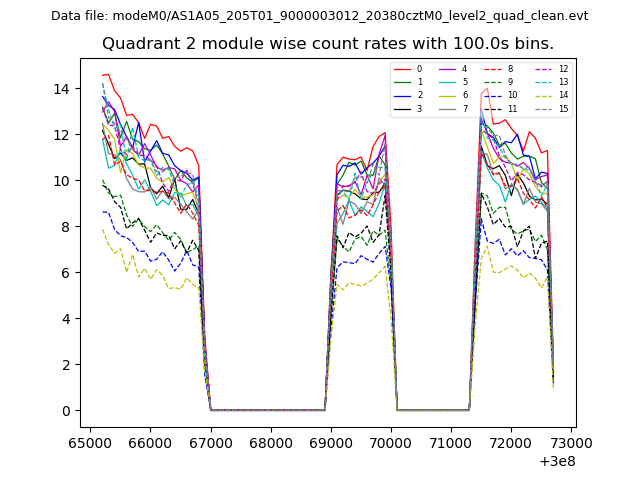
| Module-wise count rates for Quadrant B Data is divided into 100 sec bins |
 |
 |
| Module-wise count rates for Quadrant C Data is divided into 100 sec bins |
 |
 |
| Module-wise count rates for Quadrant D Data is divided into 100 sec bins |
 |
 |
| Parameter | Plot |
|---|---|
| CZT HV Monitor | 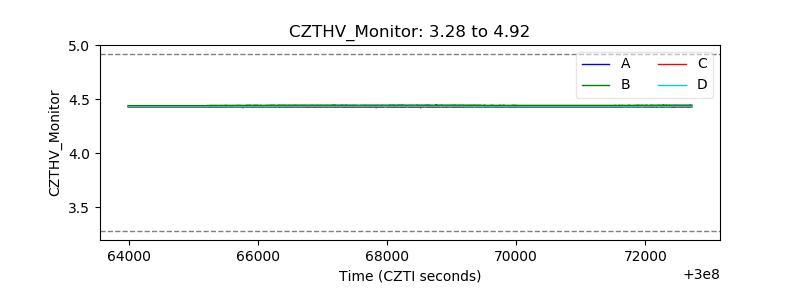 |
| D_VDD | 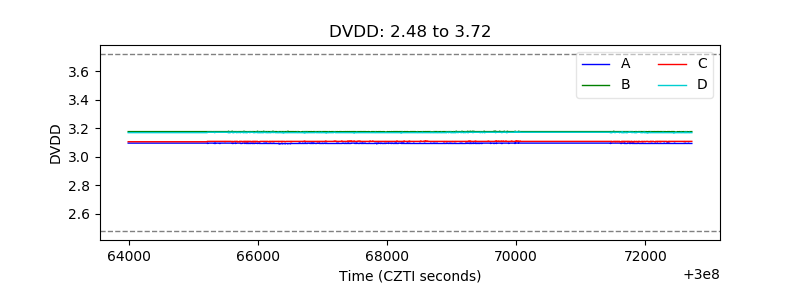 |
| Temperature 1 | 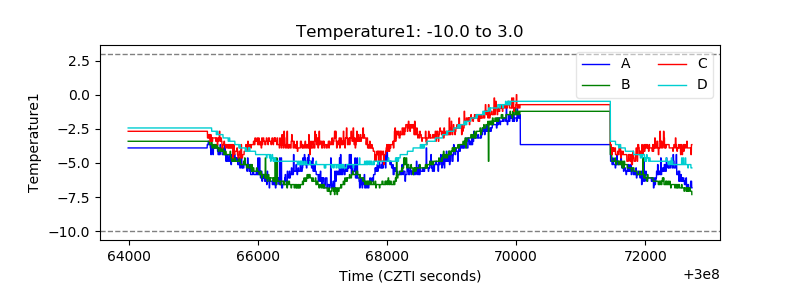 |
| Veto HV Monitor | 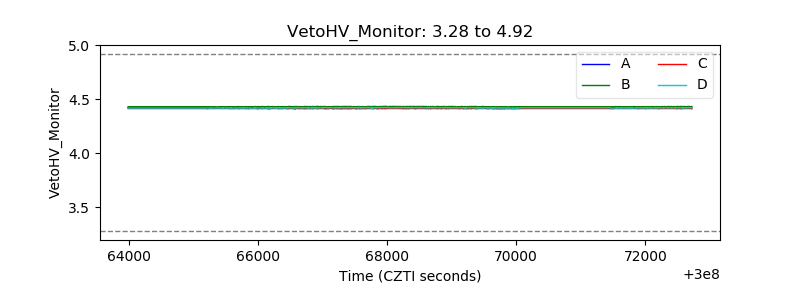 |
| Veto LLD | 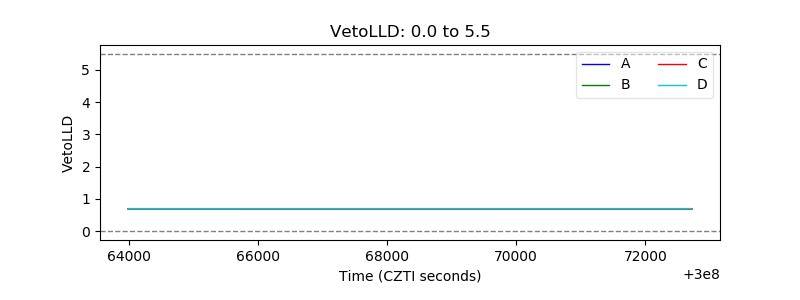 |
| Alpha Counter | 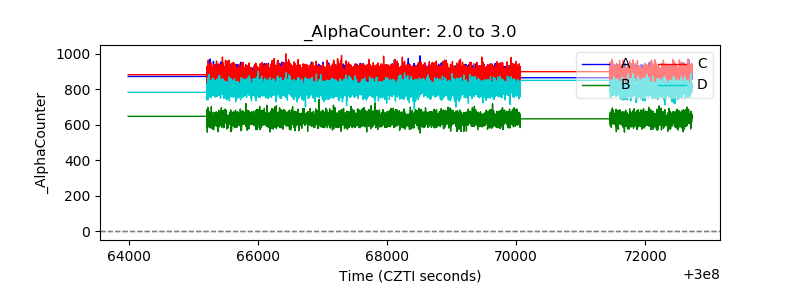 |
| _CPM_Rate | 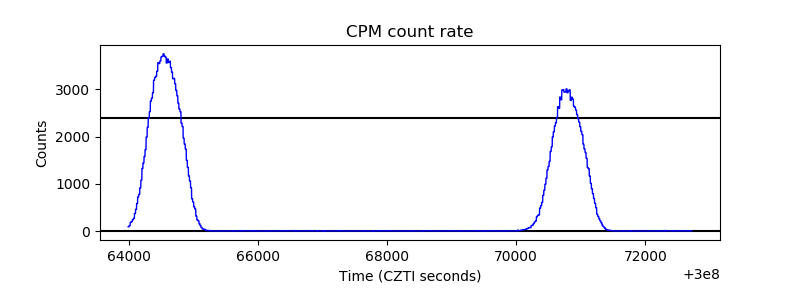 |
| CZT Counter | 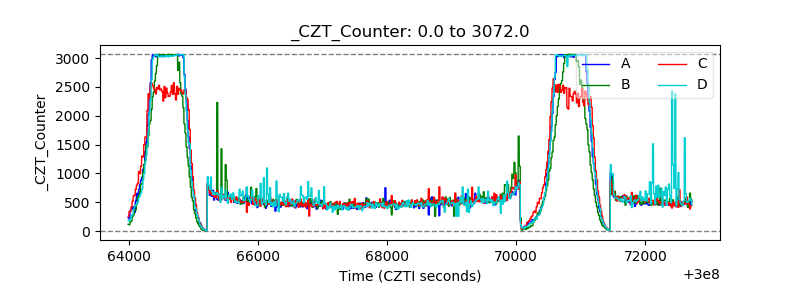 |
| +2.5 Volts monitor |  |
| +5 Volts monitor |  |
| _ROLL_ROT | 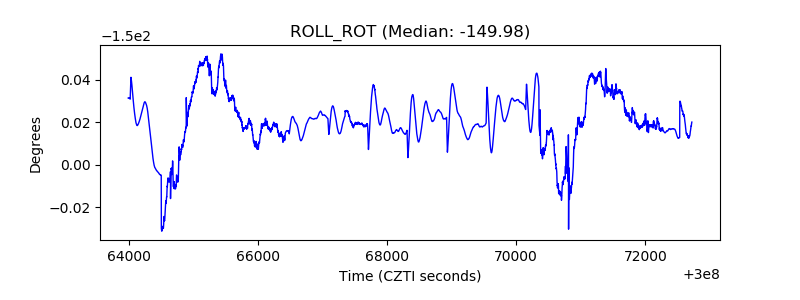 |
| _Roll_DEC |  |
| _Roll_RA | 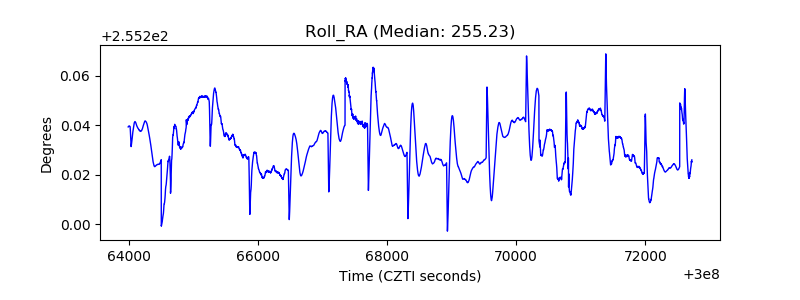 |
| Veto Counter | 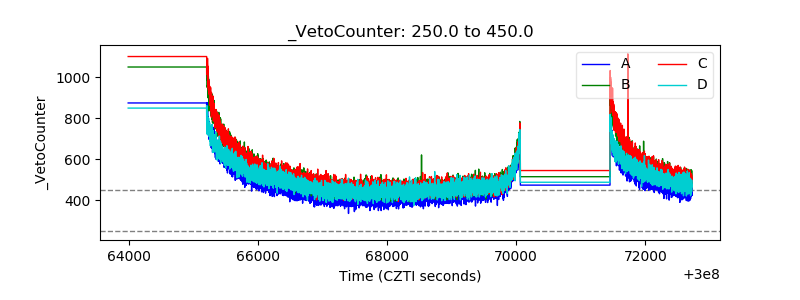 |