| Param | Original file | Final file |
|---|---|---|
| Filename | modeM0/AS1A05_205T01_9000003012_20382cztM0_level2.evt | modeM0/AS1A05_205T01_9000003012_20382cztM0_level2_quad_clean.evt |
| Size (bytes) | 451,586,880 | 81,711,360 |
| Size | 430.7 MB | 77.9 MB |
| Events in quadrant A | 3,226,123 | 505,422 |
| Events in quadrant B | 3,356,951 | 520,961 |
| Events in quadrant C | 3,252,487 | 502,291 |
| Events in quadrant D | 3,391,318 | 484,469 |
| Mode M9 | |||
|---|---|---|---|
| Quadrant | BADHDUFLAG | Total packets | Discarded packets |
| A | 0 | 17 | 0 |
| B | 0 | 18 | 0 |
| C | 0 | 18 | 0 |
| D | 0 | 18 | 0 |
| Mode SS | |||
|---|---|---|---|
| Quadrant | BADHDUFLAG | Total packets | Discarded packets |
| A | 0 | 134 | 0 |
| B | 0 | 134 | 0 |
| C | 0 | 134 | 0 |
| D | 0 | 134 | 0 |
| Mode M0 | |||
|---|---|---|---|
| Quadrant | BADHDUFLAG | Total packets | Discarded packets |
| A | 0 | 13733 | 3 |
| B | 0 | 13932 | 2 |
| C | 0 | 13574 | 2 |
| D | 0 | 14411 | 4 |
| Quadrant | Total seconds | Saturated seconds | Saturation percentage |
|---|---|---|---|
| A | 6614 | 36 | 0.544300% |
| B | 6615 | 42 | 0.634921% |
| C | 6615 | 64 | 0.967498% |
| D | 6614 | 44 | 0.665256% |
Noise dominated data is calculated using 1-second bins in cleaned event files. If a bin has >2000 counts, and if more than 50% of those come from <1% of pixels, then it is considered to be noise-dominated and hence unusable.
| Quadrant | # 1 sec bins | Bins with >0 counts | Bins with >2000 counts | High rate bins dominated by noise | Noise dominated (total time) | Noise dominated (detector-on time) | Marked lightcurve |
|---|---|---|---|---|---|---|---|
| A | 7710 | 6616 | 6 | 6 | 0.08% | 0.09% | 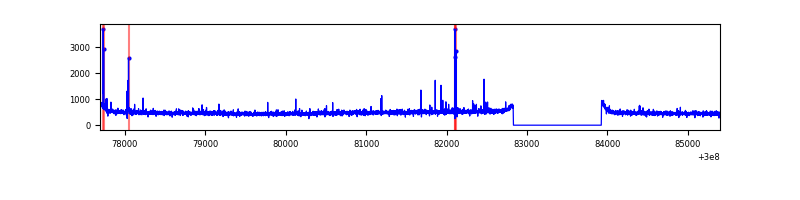 |
| B | 7710 | 6616 | 5 | 5 | 0.06% | 0.08% | 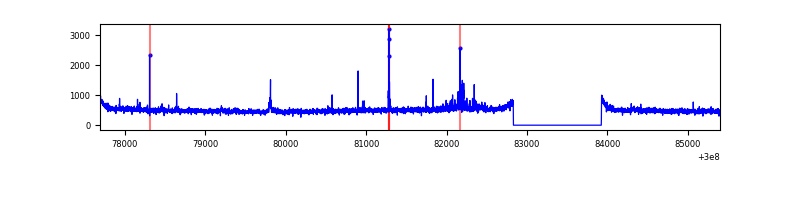 |
| C | 7710 | 6616 | 0 | 0 | 0.00% | 0.00% | 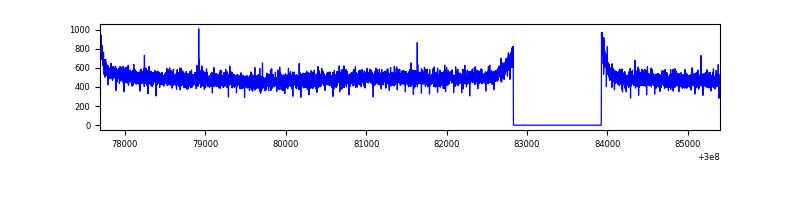 |
| D | 7710 | 6616 | 22 | 22 | 0.29% | 0.33% | 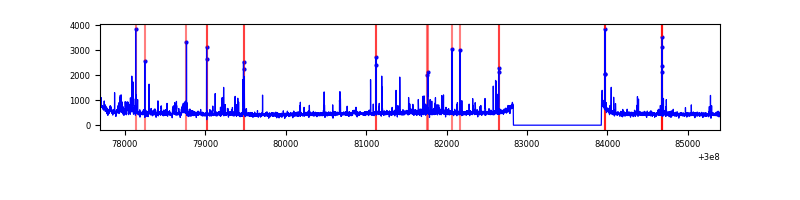 |
Top three noisy pixels from each quadrant. If the there are fewer than three noisy pixels in the level2.evt file, extra rows are filled as -1
| Pixel properties | Quadrant properties | ||||||
|---|---|---|---|---|---|---|---|
| Quadrant | DetID | PixID | Counts | Sigma | Mean | Median | Sigma |
| A | 5 | 16 | 29457 | 175.37 | 819 | 803 | 163.4 |
| A | 12 | 96 | 22426 | 132.34 | 819 | 803 | 163.4 |
| A | 6 | 16 | 14931 | 86.47 | 819 | 803 | 163.4 |
| B | 7 | 220 | 31874 | 197.68 | 827 | 807 | 157.2 |
| B | 3 | 64 | 31149 | 193.06 | 827 | 807 | 157.2 |
| B | 12 | 111 | 18722 | 113.99 | 827 | 807 | 157.2 |
| C | 14 | 238 | 125531 | 672.4 | 799 | 803 | 185.5 |
| C | 13 | 61 | 5651 | 26.14 | 799 | 803 | 185.5 |
| C | 3 | 233 | 5427 | 24.93 | 799 | 803 | 185.5 |
| D | 1 | 52 | 272972 | 1382.45 | 803 | 779 | 196.9 |
| D | 13 | 153 | 35053 | 174.07 | 803 | 779 | 196.9 |
| D | 2 | 234 | 27987 | 138.19 | 803 | 779 | 196.9 |
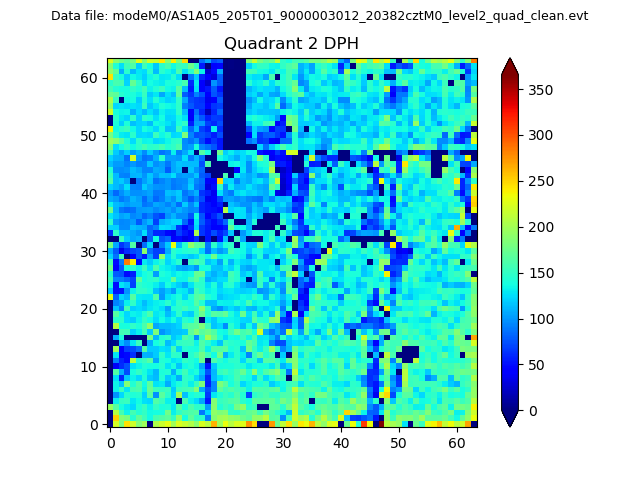
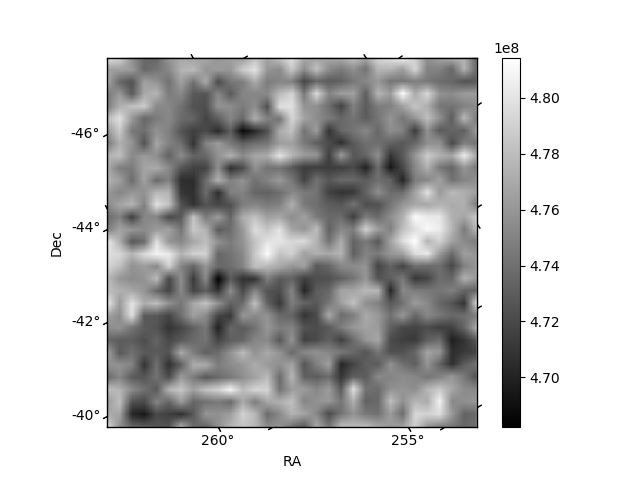
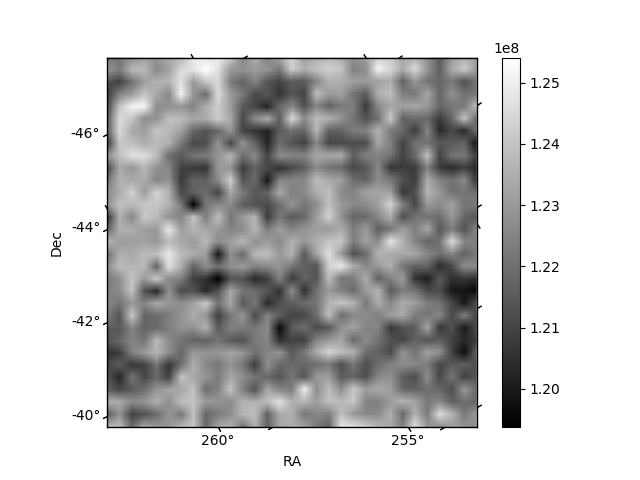
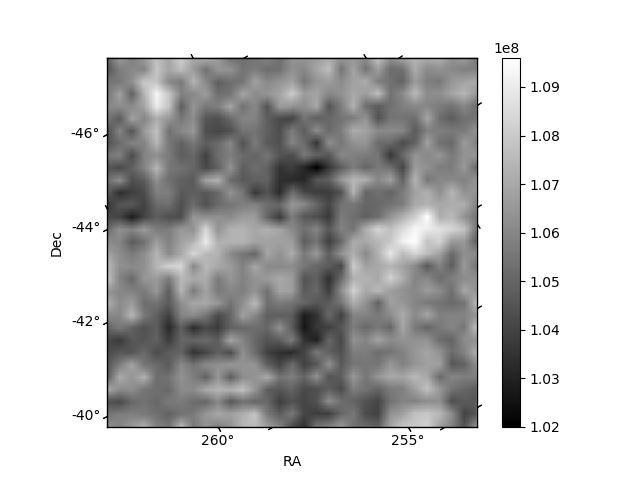
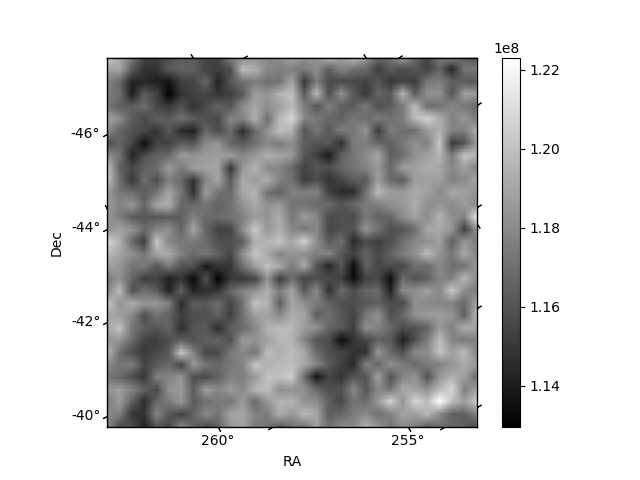
Histogram calculated using DETX and DETY for each event in the final _common_clean file
| Quadrant A | 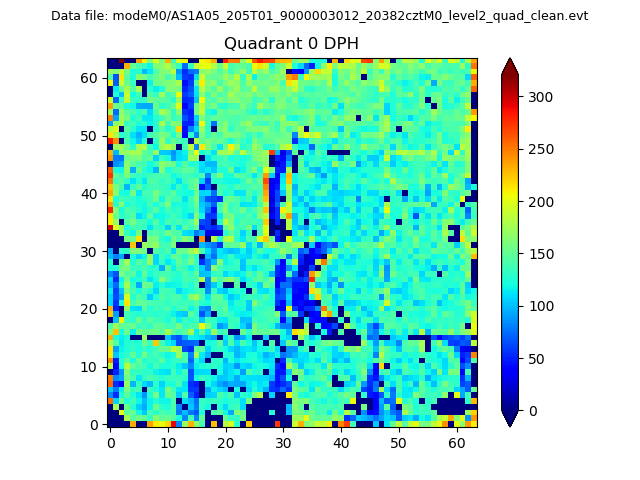 |
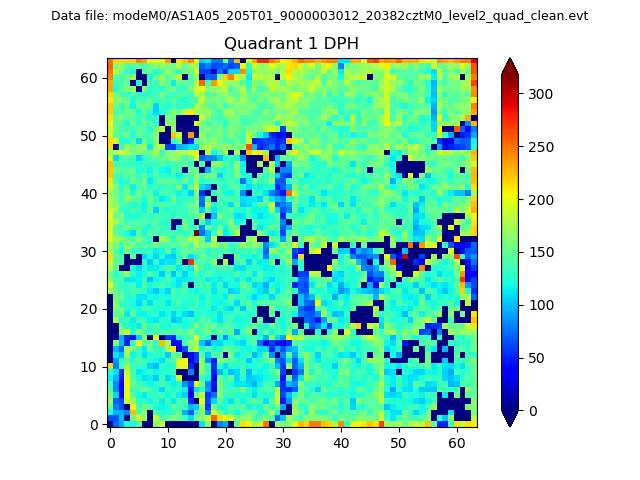 |
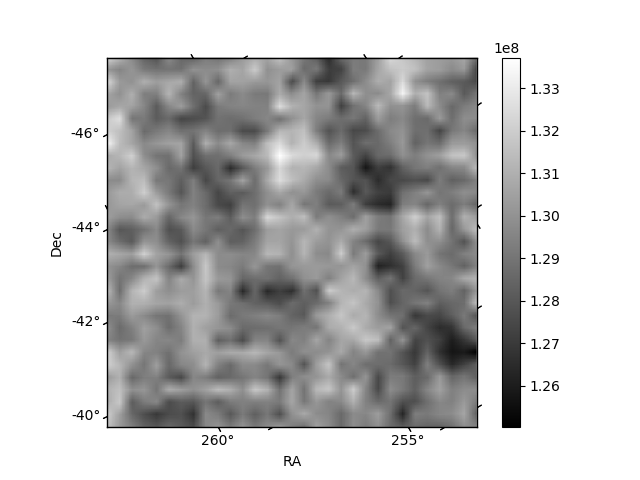
Quadrant B |
|---|---|---|---|
| Quadrant D | 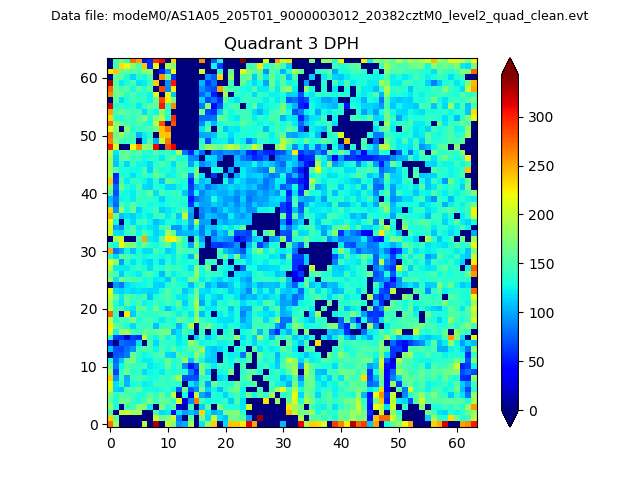 |
 |
Quadrant C |
| Plot type | Count rate plots | Images |
|---|---|---|
| Comparison with Poisson distribution Blue bars denote a histogram of data divided into 1 sec bins. Red curve is a Poisson curve with rate = median count rate of data. |
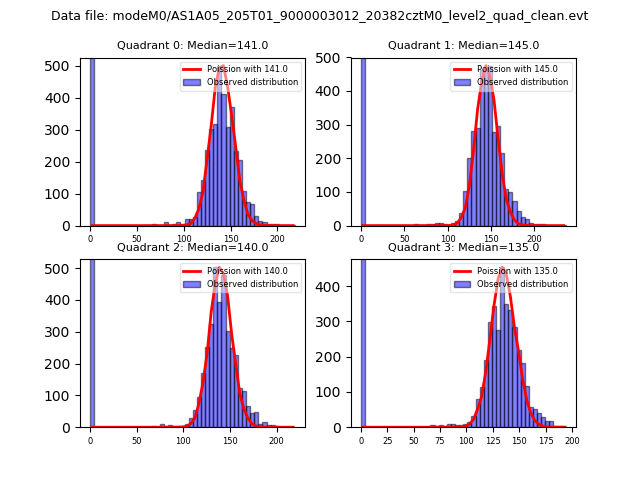 |
 |
| Quadrant-wise count rates Data is divided into 100 sec bins |
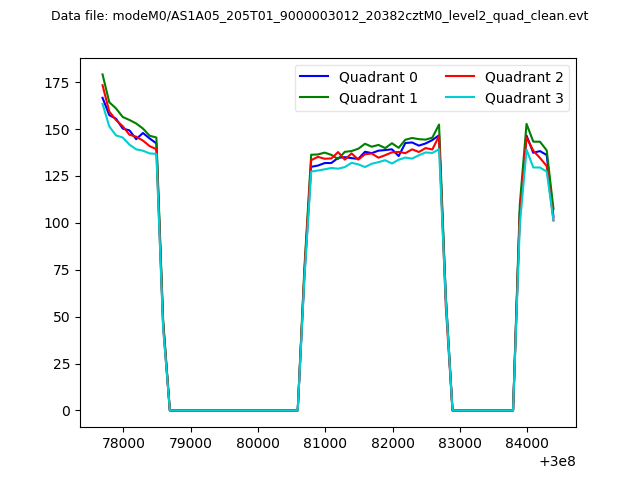 |
|
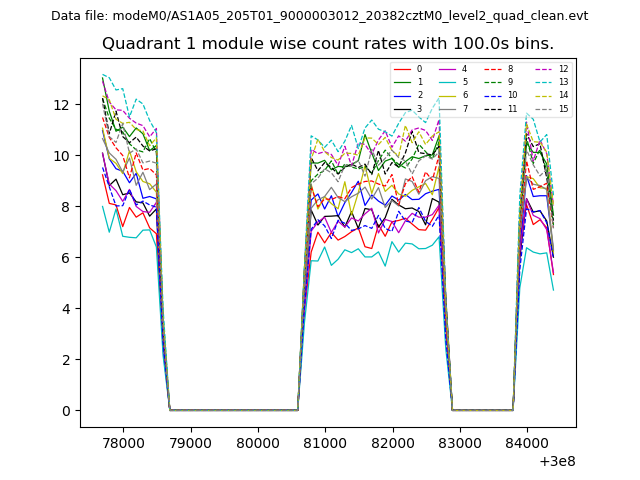
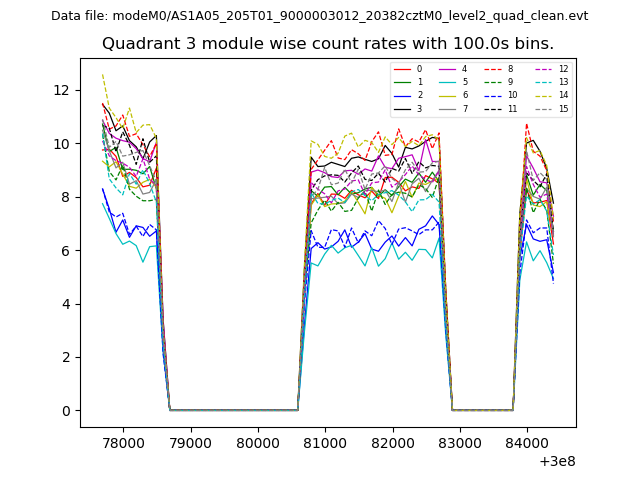
| Module-wise count rates for Quadrant A Data is divided into 100 sec bins |
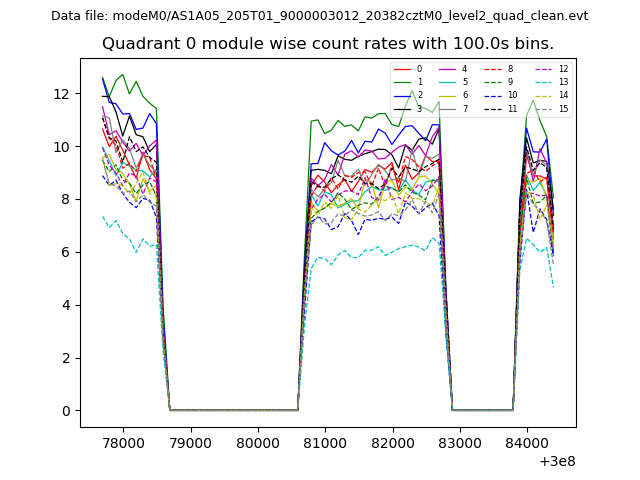 |
 |
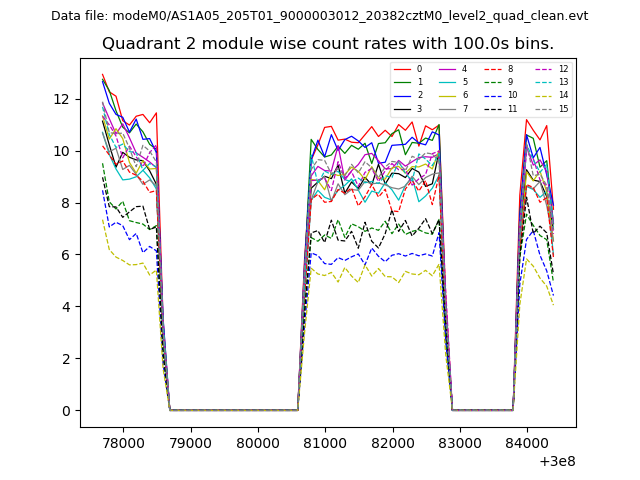
| Module-wise count rates for Quadrant B Data is divided into 100 sec bins |
 |
 |
| Module-wise count rates for Quadrant C Data is divided into 100 sec bins |
 |
 |
| Module-wise count rates for Quadrant D Data is divided into 100 sec bins |
 |
 |
| Parameter | Plot |
|---|---|
| CZT HV Monitor | 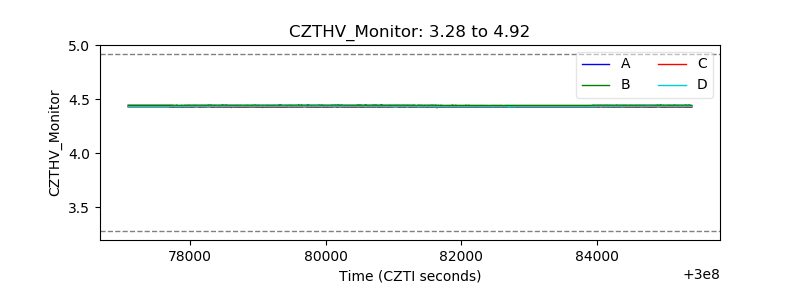 |
| D_VDD | 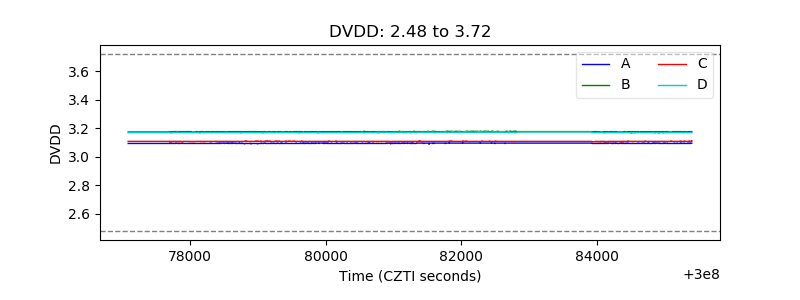 |
| Temperature 1 | 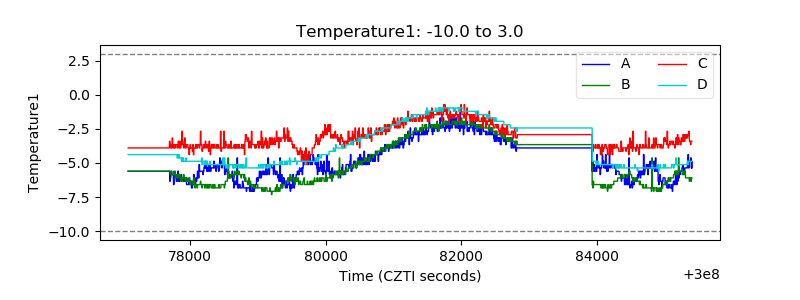 |
| Veto HV Monitor | 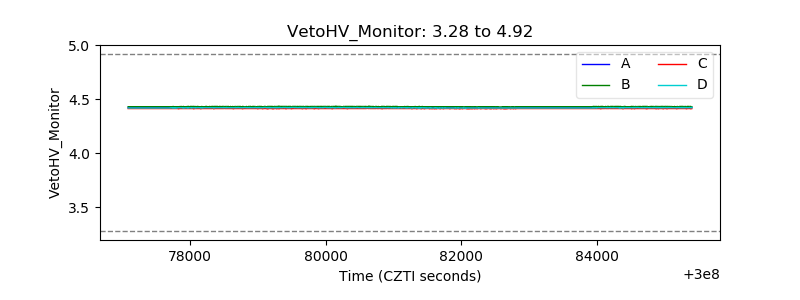 |
| Veto LLD | 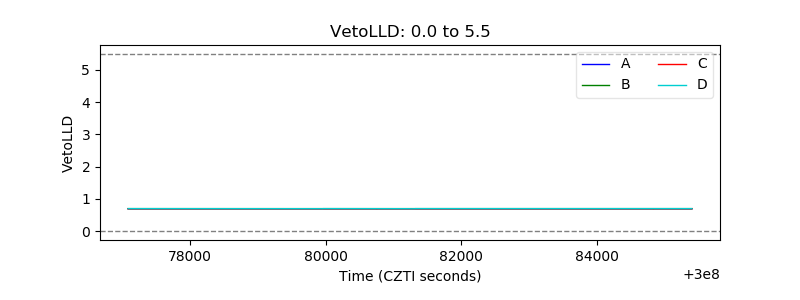 |
| Alpha Counter | 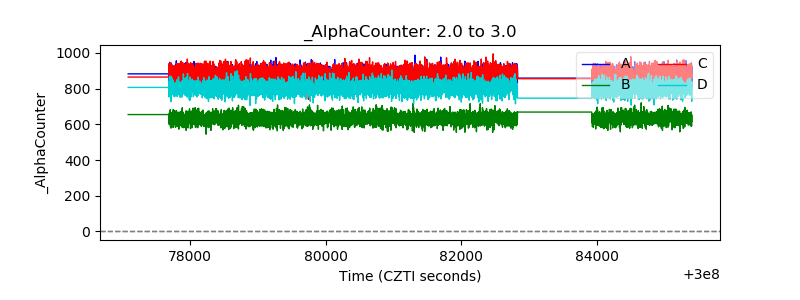 |
| _CPM_Rate | 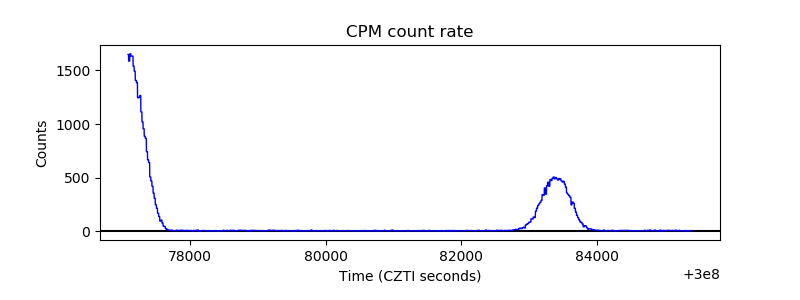 |
| CZT Counter |  |
| +2.5 Volts monitor |  |
| +5 Volts monitor | 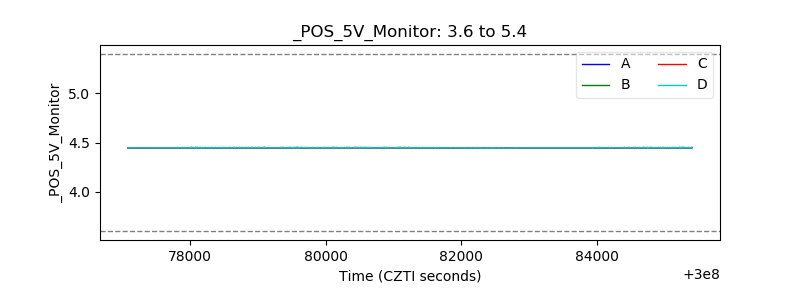 |
| _ROLL_ROT | 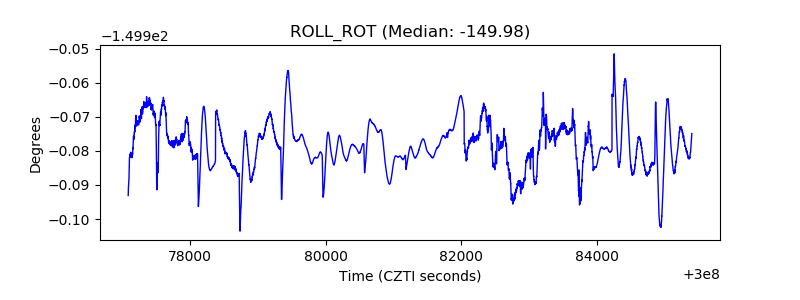 |
| _Roll_DEC | 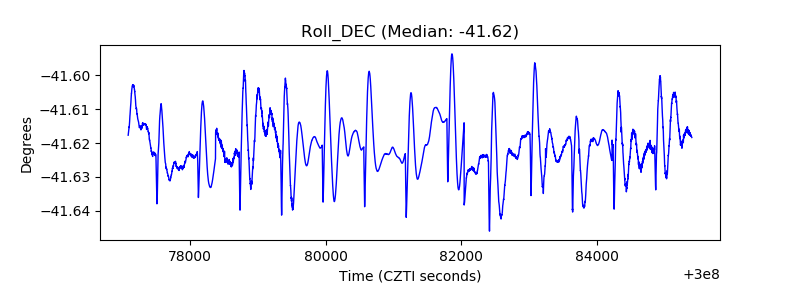 |
| _Roll_RA | 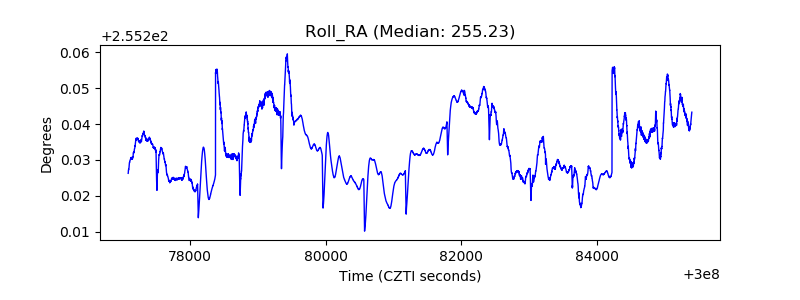 |
| Veto Counter | 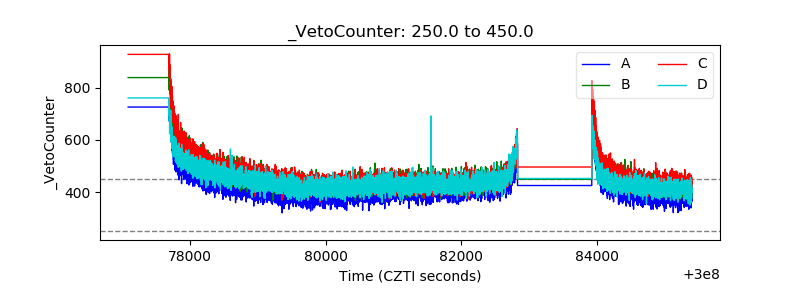 |