| Param | Original file | Final file |
|---|---|---|
| Filename | modeM0/AS1A05_205T01_9000003012_20384cztM0_level2.evt | modeM0/AS1A05_205T01_9000003012_20384cztM0_level2_quad_clean.evt |
| Size (bytes) | 853,672,320 | 143,801,280 |
| Size | 814.1 MB | 137.1 MB |
| Events in quadrant A | 5,969,796 | 885,182 |
| Events in quadrant B | 6,642,464 | 888,434 |
| Events in quadrant C | 6,082,341 | 861,924 |
| Events in quadrant D | 6,303,598 | 846,449 |
| Mode M9 | |||
|---|---|---|---|
| Quadrant | BADHDUFLAG | Total packets | Discarded packets |
| A | 0 | 10 | 0 |
| B | 0 | 10 | 0 |
| C | 0 | 10 | 0 |
| D | 0 | 10 | 0 |
| Mode SS | |||
|---|---|---|---|
| Quadrant | BADHDUFLAG | Total packets | Discarded packets |
| A | 0 | 254 | 0 |
| B | 0 | 254 | 0 |
| C | 0 | 254 | 0 |
| D | 0 | 254 | 0 |
| Mode M0 | |||
|---|---|---|---|
| Quadrant | BADHDUFLAG | Total packets | Discarded packets |
| A | 0 | 26134 | 2 |
| B | 0 | 27764 | 4 |
| C | 0 | 26182 | 2 |
| D | 0 | 27580 | 2 |
| Quadrant | Total seconds | Saturated seconds | Saturation percentage |
|---|---|---|---|
| A | 12634 | 203 | 1.606775% |
| B | 12633 | 402 | 3.182142% |
| C | 12634 | 287 | 2.271648% |
| D | 12634 | 275 | 2.176666% |
Noise dominated data is calculated using 1-second bins in cleaned event files. If a bin has >2000 counts, and if more than 50% of those come from <1% of pixels, then it is considered to be noise-dominated and hence unusable.
| Quadrant | # 1 sec bins | Bins with >0 counts | Bins with >2000 counts | High rate bins dominated by noise | Noise dominated (total time) | Noise dominated (detector-on time) | Marked lightcurve |
|---|---|---|---|---|---|---|---|
| A | 13559 | 12636 | 1 | 1 | 0.01% | 0.01% | 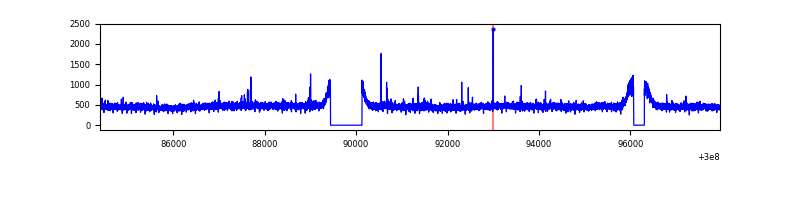 |
| B | 13559 | 12636 | 82 | 82 | 0.60% | 0.65% | 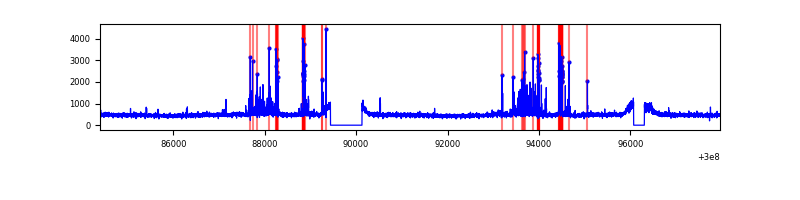 |
| C | 13559 | 12636 | 0 | 0 | 0.00% | 0.00% | 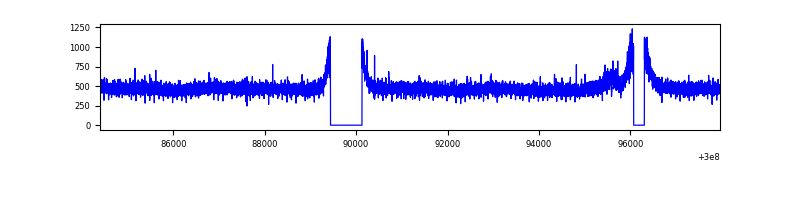 |
| D | 13559 | 12636 | 81 | 81 | 0.60% | 0.64% | 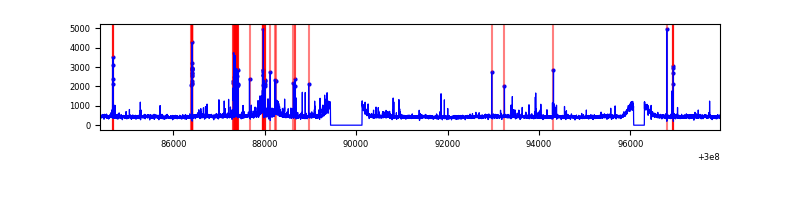 |
Top three noisy pixels from each quadrant. If the there are fewer than three noisy pixels in the level2.evt file, extra rows are filled as -1
| Pixel properties | Quadrant properties | ||||||
|---|---|---|---|---|---|---|---|
| Quadrant | DetID | PixID | Counts | Sigma | Mean | Median | Sigma |
| A | 5 | 16 | 27030 | 82.32 | 1539 | 1508 | 310.0 |
| A | 0 | 226 | 13335 | 38.15 | 1539 | 1508 | 310.0 |
| A | 3 | 137 | 13040 | 37.2 | 1539 | 1508 | 310.0 |
| B | 7 | 220 | 469197 | 1594.41 | 1533 | 1493 | 293.3 |
| B | 0 | 198 | 51595 | 170.8 | 1533 | 1493 | 293.3 |
| B | 12 | 111 | 35929 | 117.39 | 1533 | 1493 | 293.3 |
| C | 14 | 238 | 230093 | 656.29 | 1483 | 1489 | 348.3 |
| C | 3 | 233 | 42723 | 118.38 | 1483 | 1489 | 348.3 |
| C | 8 | 128 | 14995 | 38.77 | 1483 | 1489 | 348.3 |
| D | 1 | 52 | 494015 | 1343.94 | 1502 | 1457 | 366.5 |
| D | 2 | 234 | 60834 | 162.01 | 1502 | 1457 | 366.5 |
| D | 13 | 153 | 35426 | 92.68 | 1502 | 1457 | 366.5 |
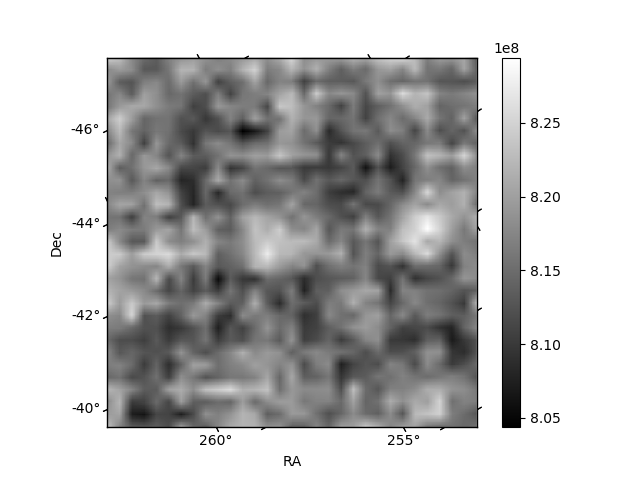
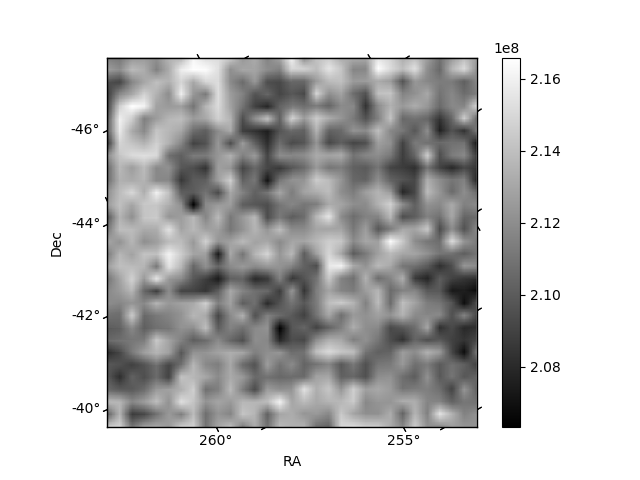
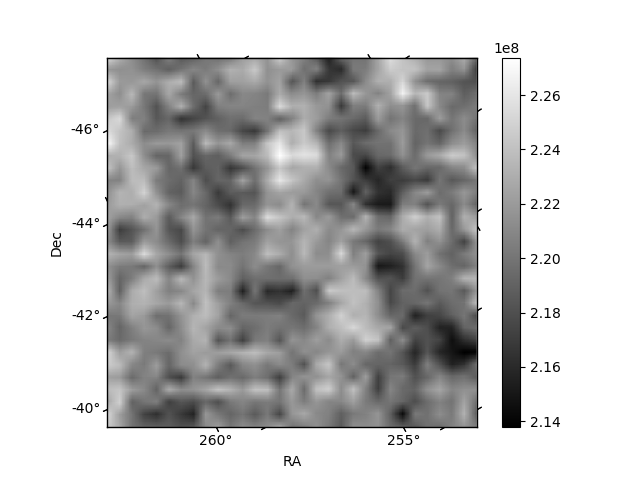
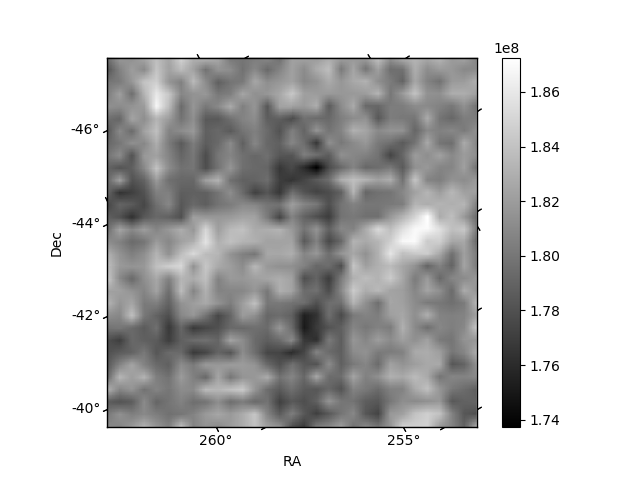
Histogram calculated using DETX and DETY for each event in the final _common_clean file
| Quadrant A | 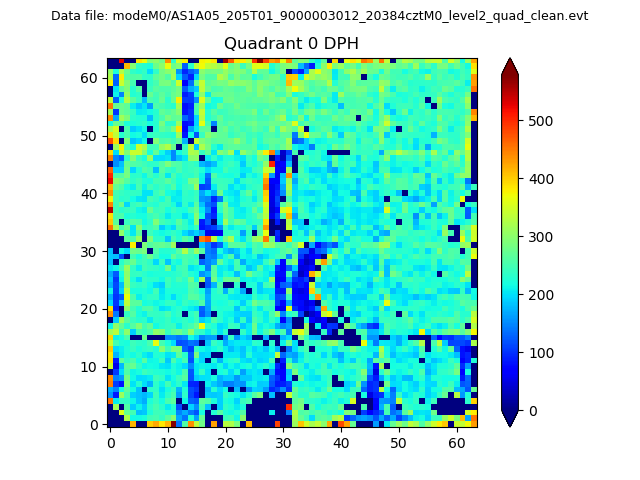 |
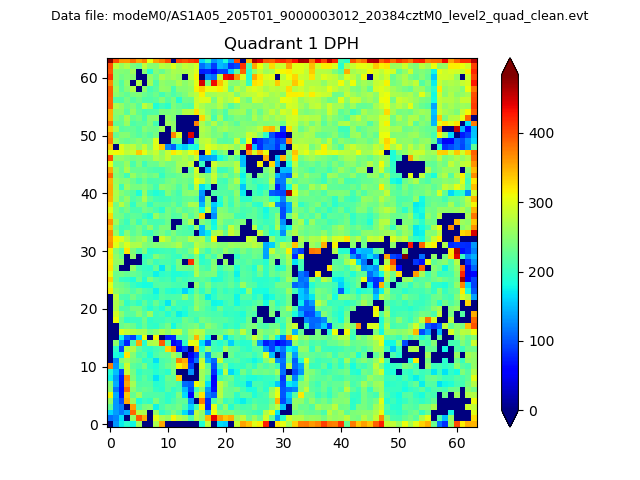 |
Quadrant B |
|---|---|---|---|
| Quadrant D | 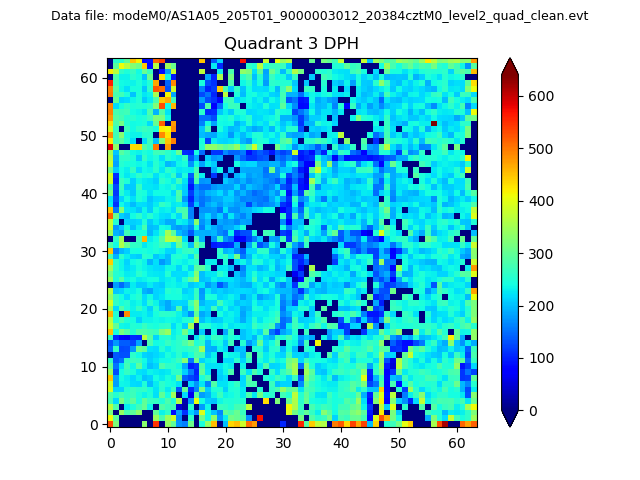 |
 |
Quadrant C |
| Plot type | Count rate plots | Images |
|---|---|---|
| Comparison with Poisson distribution Blue bars denote a histogram of data divided into 1 sec bins. Red curve is a Poisson curve with rate = median count rate of data. |
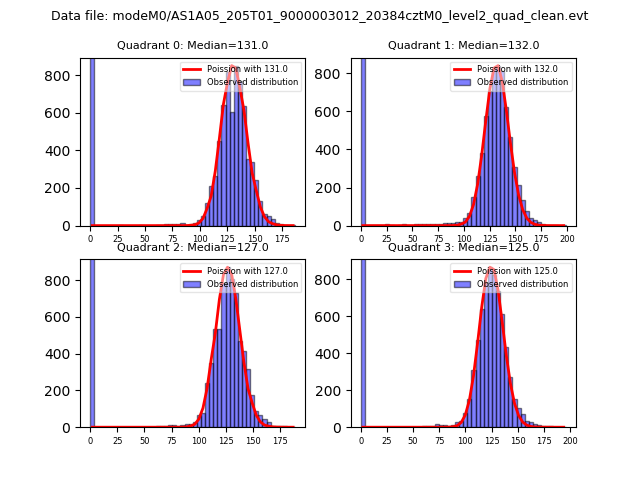 |
 |
| Quadrant-wise count rates Data is divided into 100 sec bins |
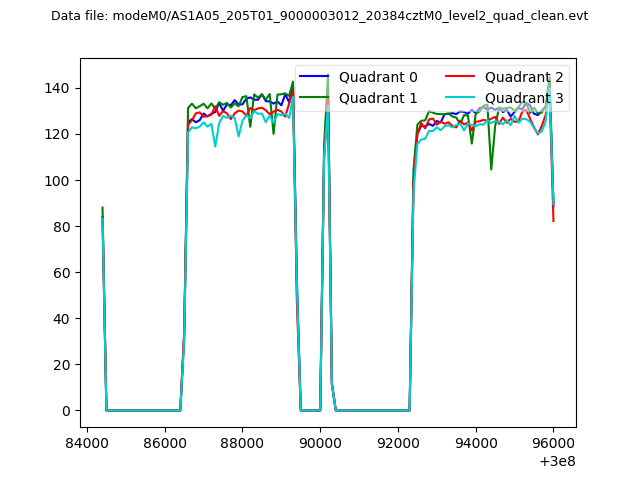 |
|
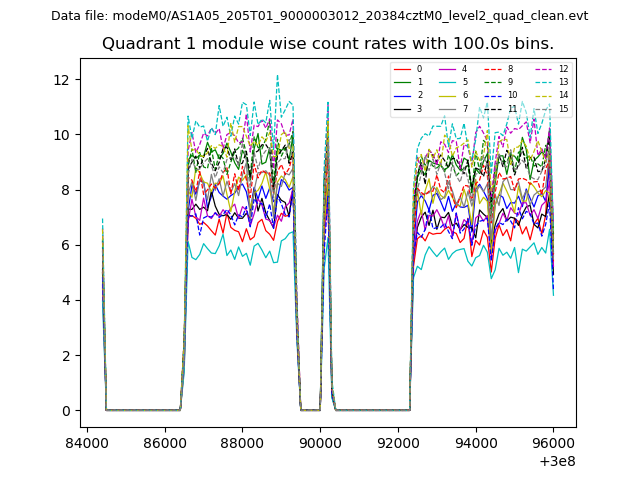
| Module-wise count rates for Quadrant A Data is divided into 100 sec bins |
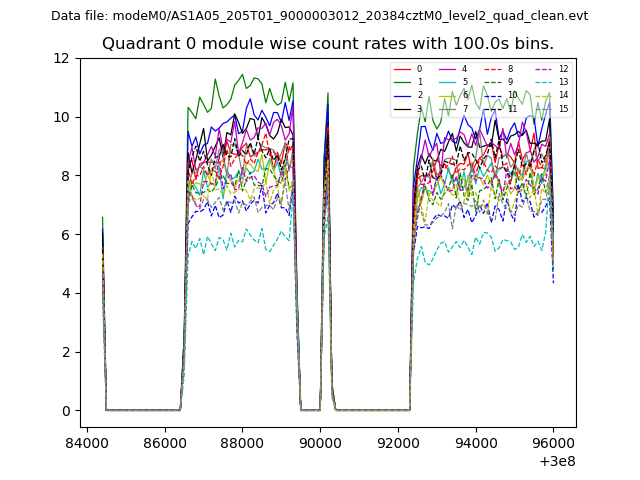 |
 |
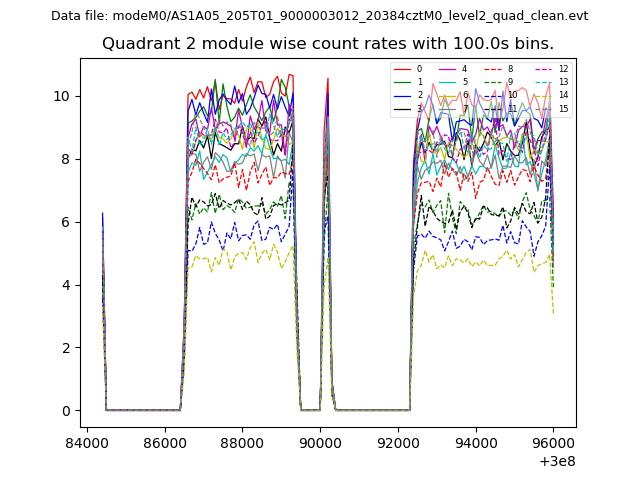
| Module-wise count rates for Quadrant B Data is divided into 100 sec bins |
 |
 |
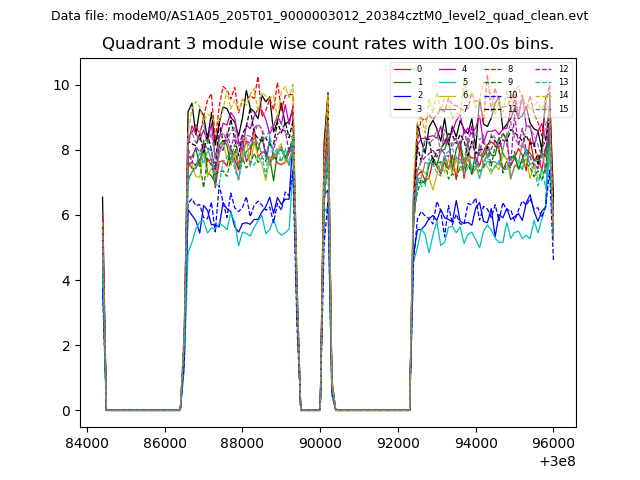
| Module-wise count rates for Quadrant C Data is divided into 100 sec bins |
 |
 |
| Module-wise count rates for Quadrant D Data is divided into 100 sec bins |
 |
 |
| Parameter | Plot |
|---|---|
| CZT HV Monitor | 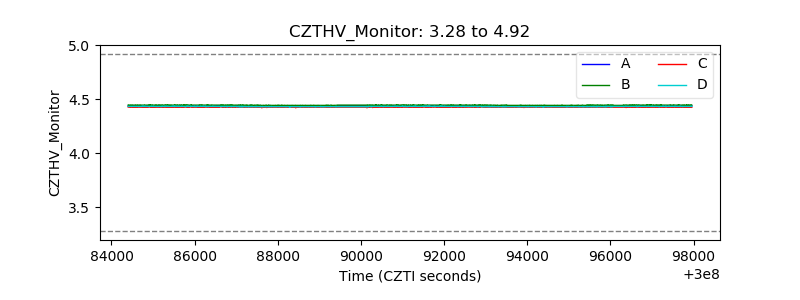 |
| D_VDD | 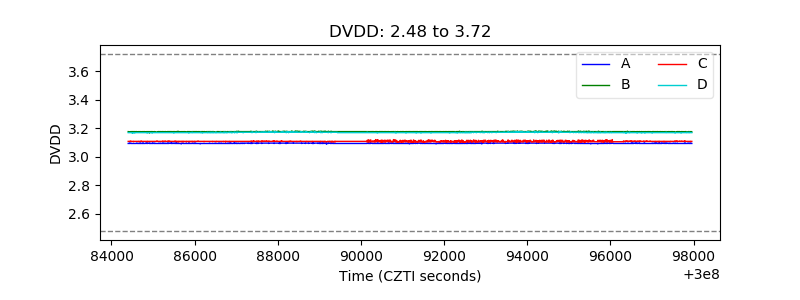 |
| Temperature 1 | 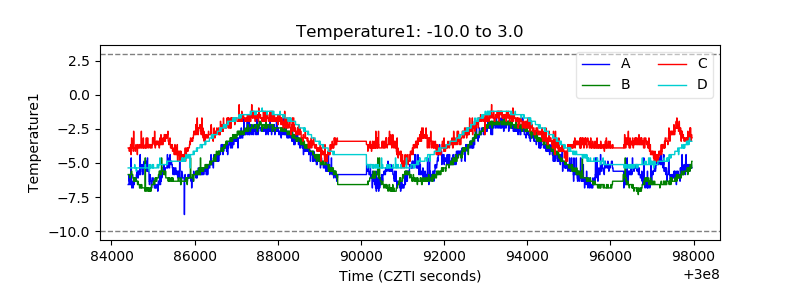 |
| Veto HV Monitor | 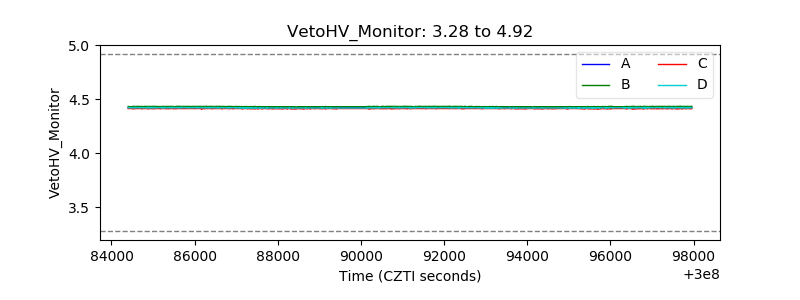 |
| Veto LLD | 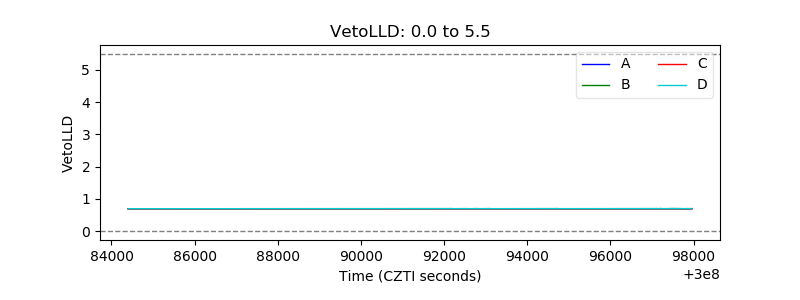 |
| Alpha Counter | 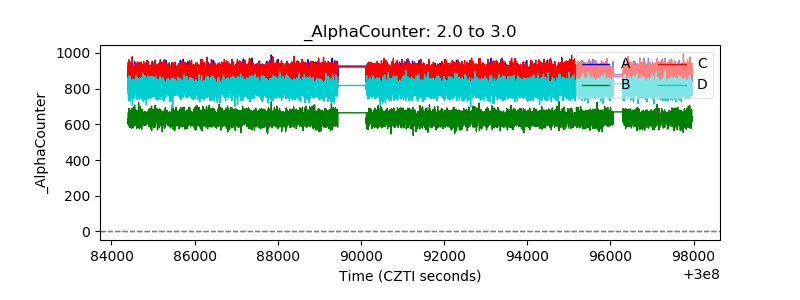 |
| _CPM_Rate | 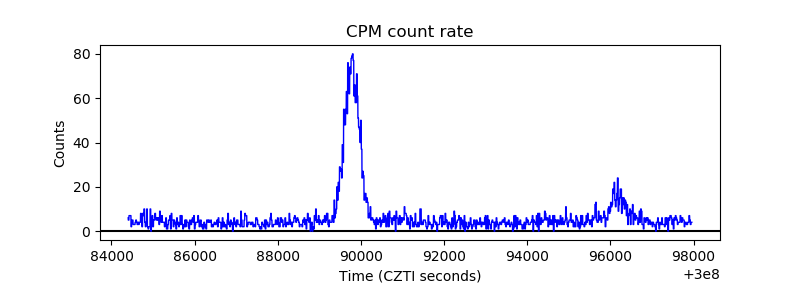 |
| CZT Counter | 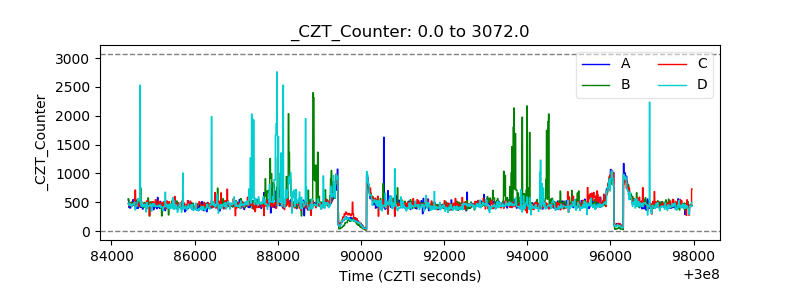 |
| +2.5 Volts monitor |  |
| +5 Volts monitor |  |
| _ROLL_ROT | 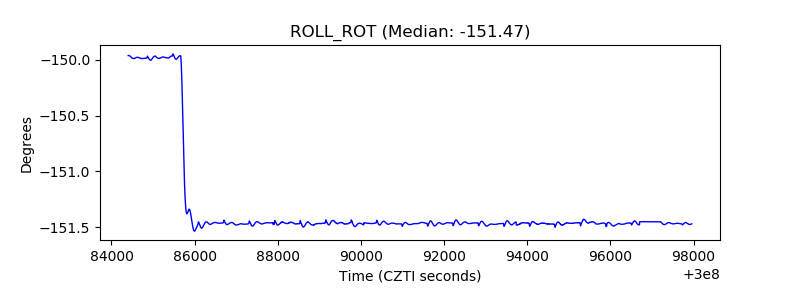 |
| _Roll_DEC | 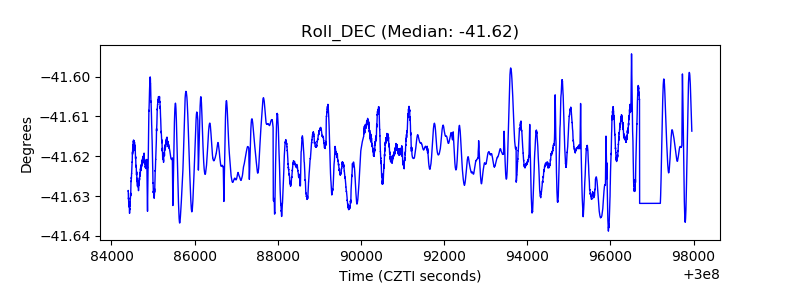 |
| _Roll_RA | 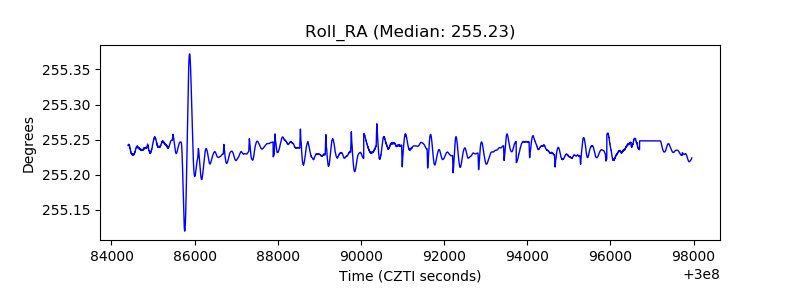 |
| Veto Counter | 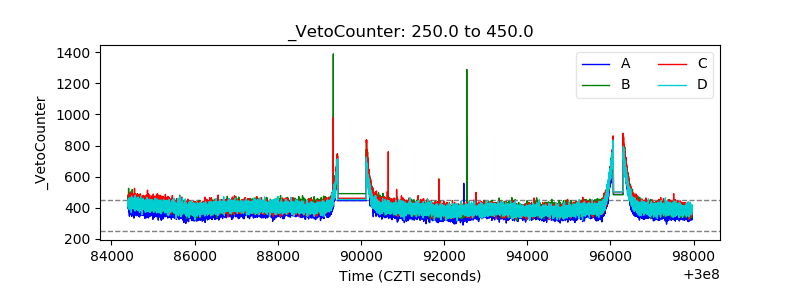 |