| Param | Original file | Final file |
|---|---|---|
| Filename | modeM0/AS1A05_205T01_9000003012_20385cztM0_level2.evt | modeM0/AS1A05_205T01_9000003012_20385cztM0_level2_quad_clean.evt |
| Size (bytes) | 627,721,920 | 97,367,040 |
| Size | 598.6 MB | 92.9 MB |
| Events in quadrant A | 4,249,450 | 599,627 |
| Events in quadrant B | 4,499,845 | 603,697 |
| Events in quadrant C | 4,460,867 | 580,567 |
| Events in quadrant D | 5,210,007 | 560,709 |
| Mode M9 | |||
|---|---|---|---|
| Quadrant | BADHDUFLAG | Total packets | Discarded packets |
| A | 0 | 4 | 0 |
| B | 0 | 4 | 0 |
| C | 0 | 4 | 0 |
| D | 0 | 4 | 0 |
| Mode SS | |||
|---|---|---|---|
| Quadrant | BADHDUFLAG | Total packets | Discarded packets |
| A | 0 | 178 | 0 |
| B | 0 | 178 | 0 |
| C | 0 | 178 | 0 |
| D | 0 | 178 | 0 |
| Mode M0 | |||
|---|---|---|---|
| Quadrant | BADHDUFLAG | Total packets | Discarded packets |
| A | 0 | 18370 | 2 |
| B | 0 | 18828 | 2 |
| C | 0 | 18880 | 2 |
| D | 0 | 21456 | 2 |
| Quadrant | Total seconds | Saturated seconds | Saturation percentage |
|---|---|---|---|
| A | 8697 | 416 | 4.783259% |
| B | 8697 | 486 | 5.588134% |
| C | 8698 | 482 | 5.541504% |
| D | 8698 | 595 | 6.840653% |
Noise dominated data is calculated using 1-second bins in cleaned event files. If a bin has >2000 counts, and if more than 50% of those come from <1% of pixels, then it is considered to be noise-dominated and hence unusable.
| Quadrant | # 1 sec bins | Bins with >0 counts | Bins with >2000 counts | High rate bins dominated by noise | Noise dominated (total time) | Noise dominated (detector-on time) | Marked lightcurve |
|---|---|---|---|---|---|---|---|
| A | 9017 | 8701 | 0 | 0 | 0.00% | 0.00% | 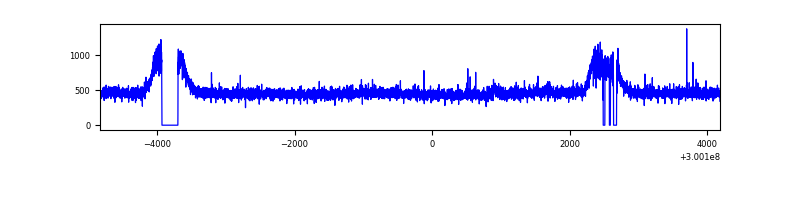 |
| B | 9017 | 8700 | 14 | 14 | 0.16% | 0.16% | 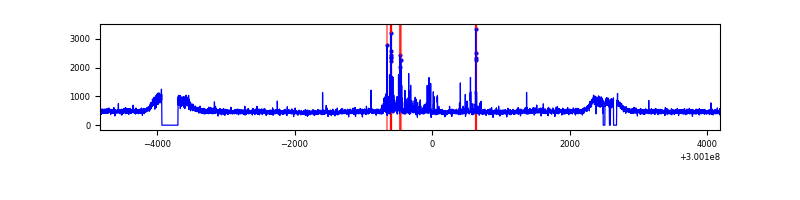 |
| C | 9018 | 8702 | 0 | 0 | 0.00% | 0.00% | 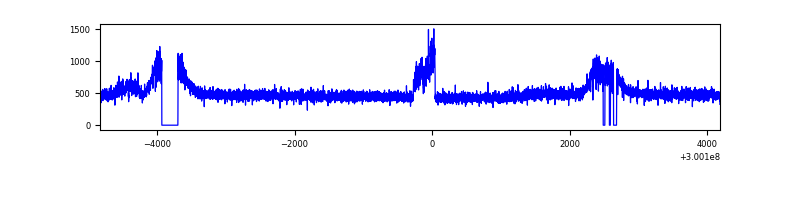 |
| D | 9018 | 8702 | 154 | 154 | 1.71% | 1.77% | 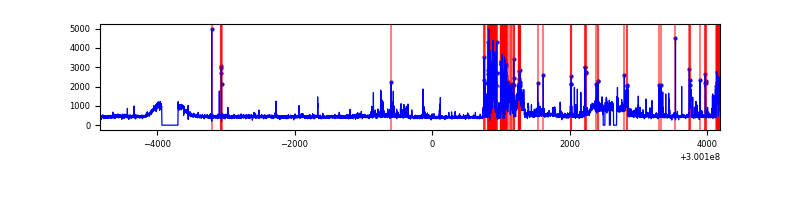 |
Top three noisy pixels from each quadrant. If the there are fewer than three noisy pixels in the level2.evt file, extra rows are filled as -1
| Pixel properties | Quadrant properties | ||||||
|---|---|---|---|---|---|---|---|
| Quadrant | DetID | PixID | Counts | Sigma | Mean | Median | Sigma |
| A | 13 | 210 | 24615 | 105.79 | 1094 | 1068 | 222.6 |
| A | 3 | 137 | 9547 | 38.09 | 1094 | 1068 | 222.6 |
| A | 11 | 29 | 9438 | 37.6 | 1094 | 1068 | 222.6 |
| B | 7 | 220 | 152678 | 710.71 | 1089 | 1057 | 213.3 |
| B | 0 | 198 | 35873 | 163.2 | 1089 | 1057 | 213.3 |
| B | 12 | 111 | 26599 | 119.73 | 1089 | 1057 | 213.3 |
| C | 3 | 233 | 181872 | 721.55 | 1053 | 1058 | 250.6 |
| C | 14 | 238 | 161720 | 641.13 | 1053 | 1058 | 250.6 |
| C | 13 | 61 | 7366 | 25.17 | 1053 | 1058 | 250.6 |
| D | 1 | 52 | 1044433 | 4039.39 | 1064 | 1034 | 258.3 |
| D | 2 | 234 | 42461 | 160.38 | 1064 | 1034 | 258.3 |
| D | 1 | 20 | 33282 | 124.84 | 1064 | 1034 | 258.3 |
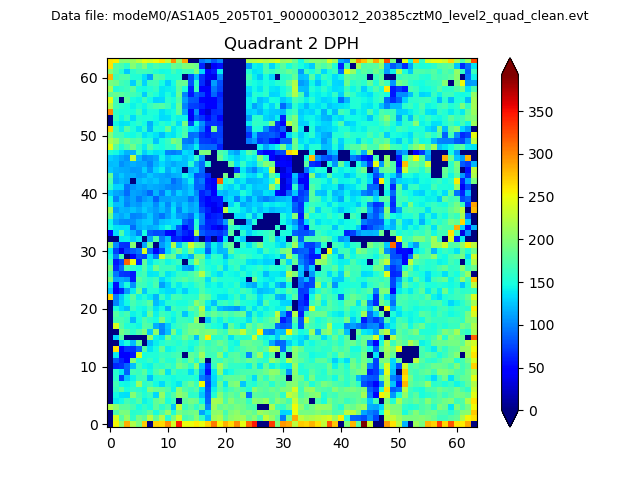
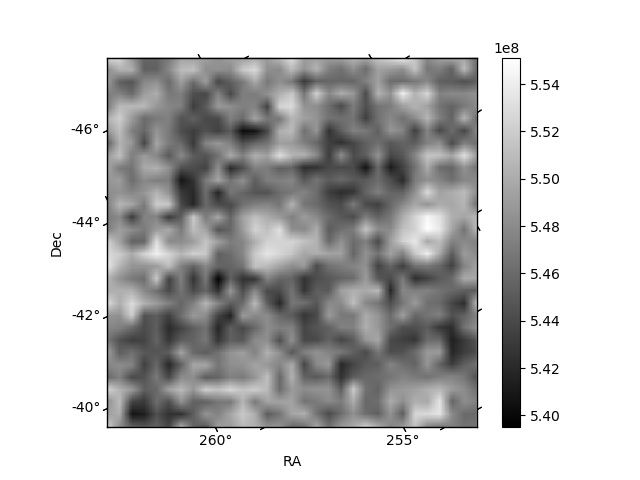
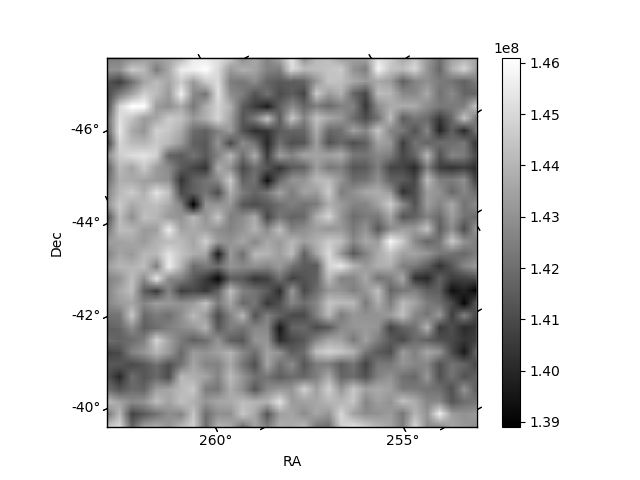
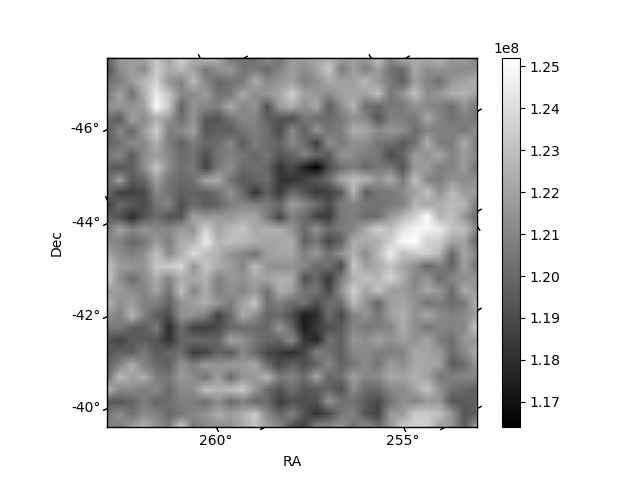
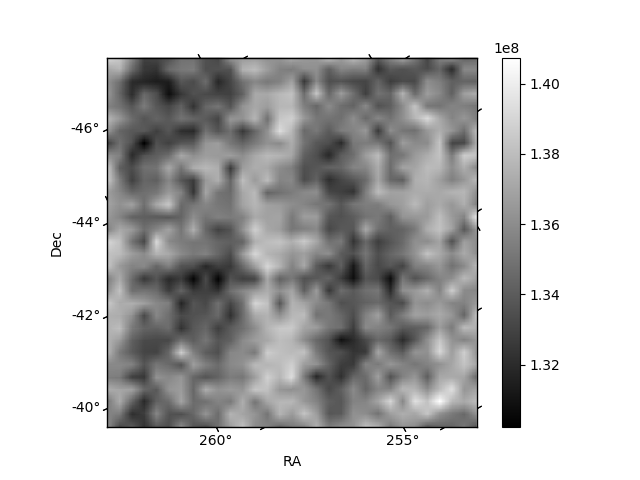
Histogram calculated using DETX and DETY for each event in the final _common_clean file
| Quadrant A | 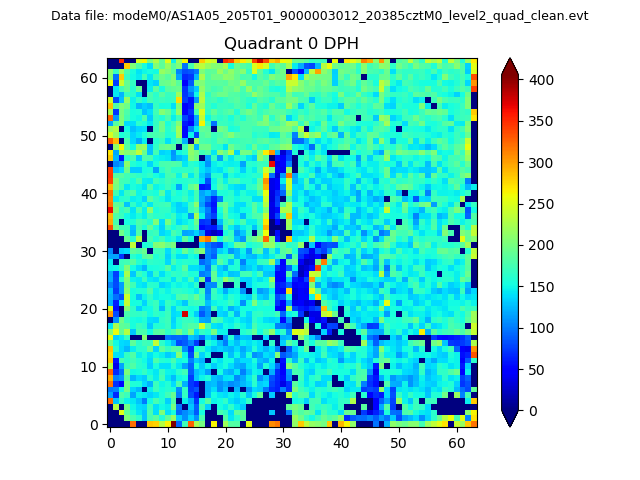 |
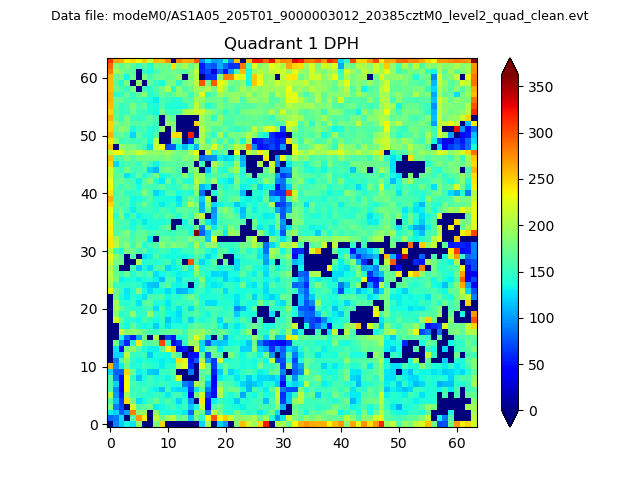 |
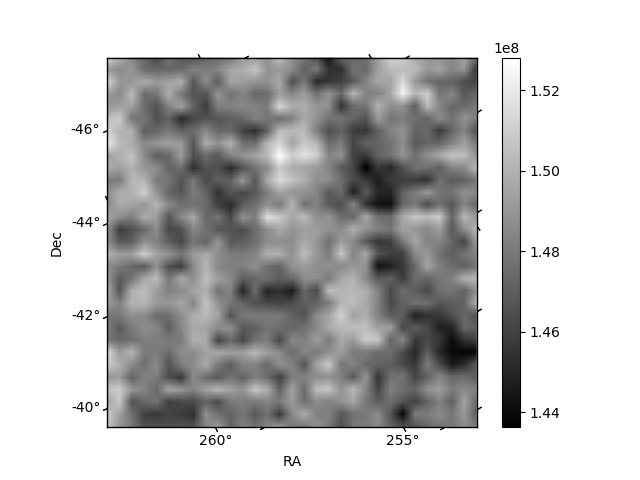
Quadrant B |
|---|---|---|---|
| Quadrant D | 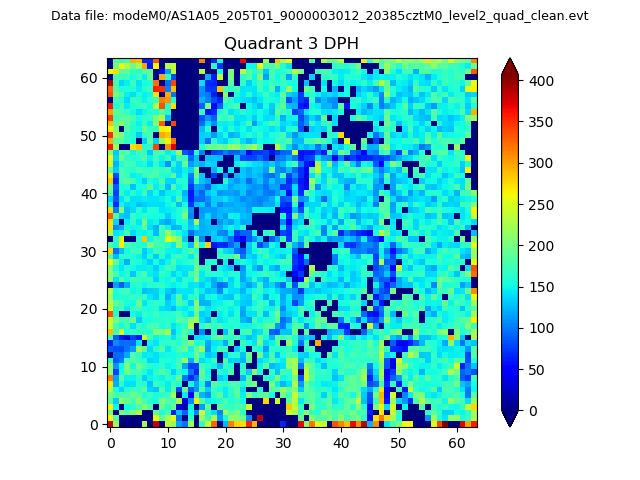 |
 |
Quadrant C |
| Plot type | Count rate plots | Images |
|---|---|---|
| Comparison with Poisson distribution Blue bars denote a histogram of data divided into 1 sec bins. Red curve is a Poisson curve with rate = median count rate of data. |
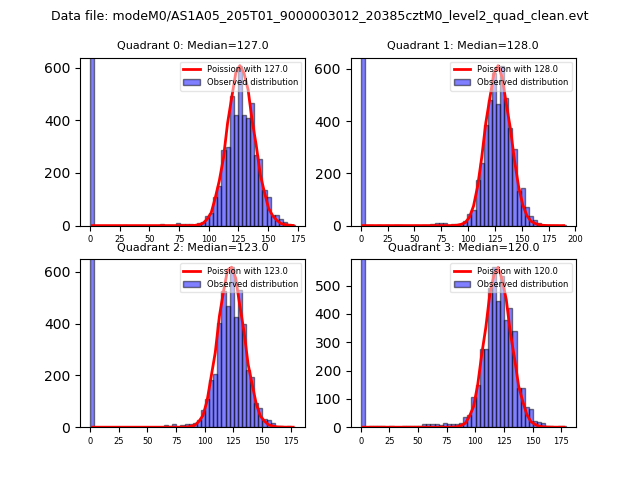 |
 |
| Quadrant-wise count rates Data is divided into 100 sec bins |
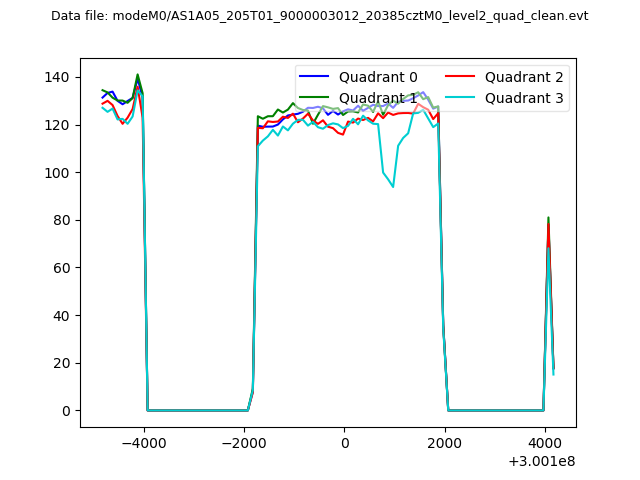 |
|
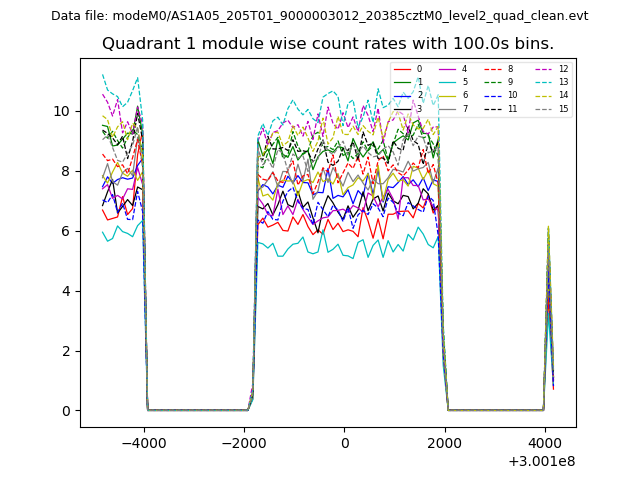
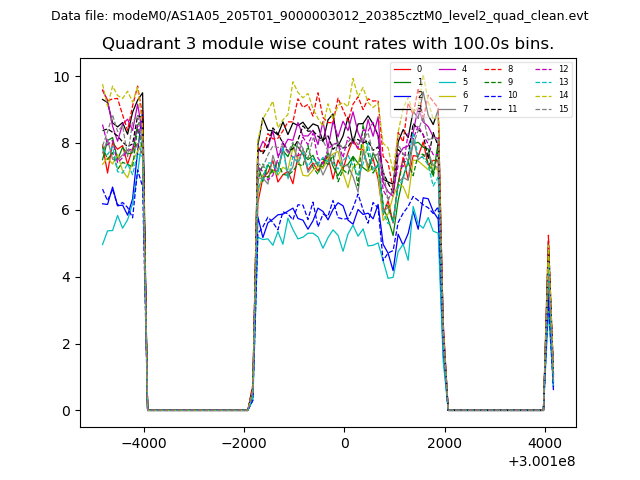
| Module-wise count rates for Quadrant A Data is divided into 100 sec bins |
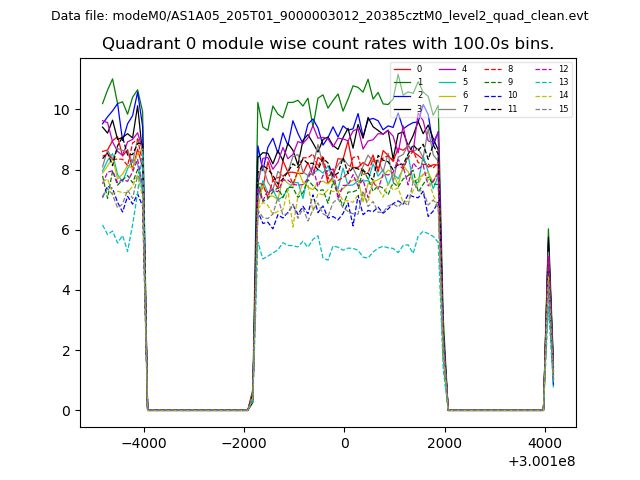 |
 |
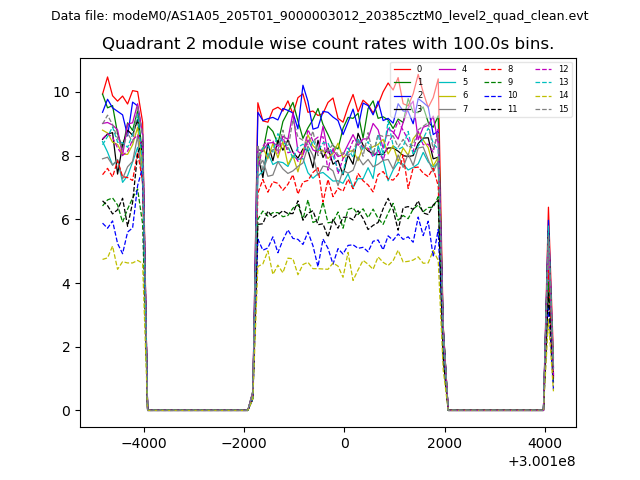
| Module-wise count rates for Quadrant B Data is divided into 100 sec bins |
 |
 |
| Module-wise count rates for Quadrant C Data is divided into 100 sec bins |
 |
 |
| Module-wise count rates for Quadrant D Data is divided into 100 sec bins |
 |
 |
| Parameter | Plot |
|---|---|
| CZT HV Monitor | 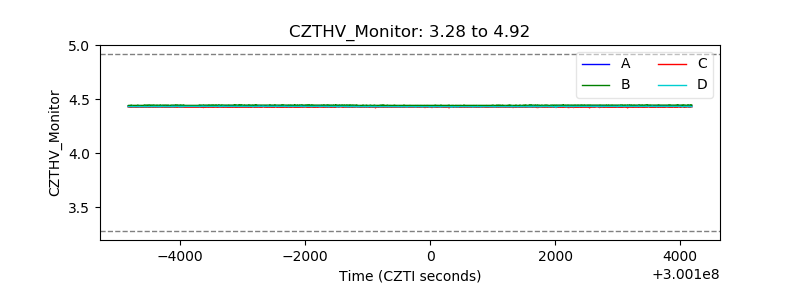 |
| D_VDD | 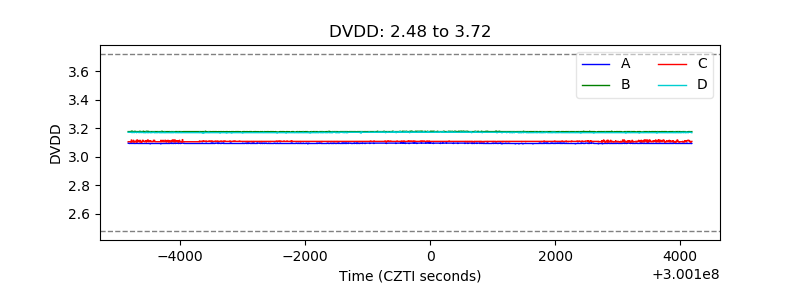 |
| Temperature 1 |  |
| Veto HV Monitor | 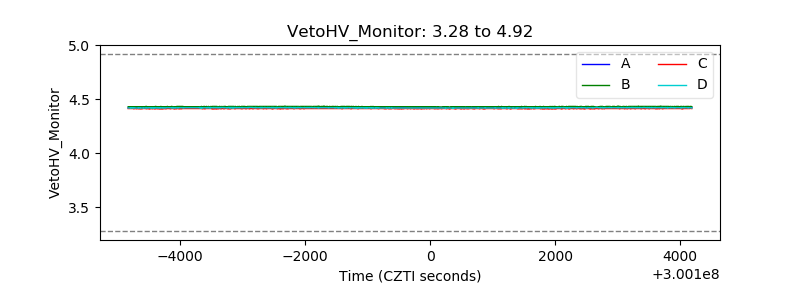 |
| Veto LLD | 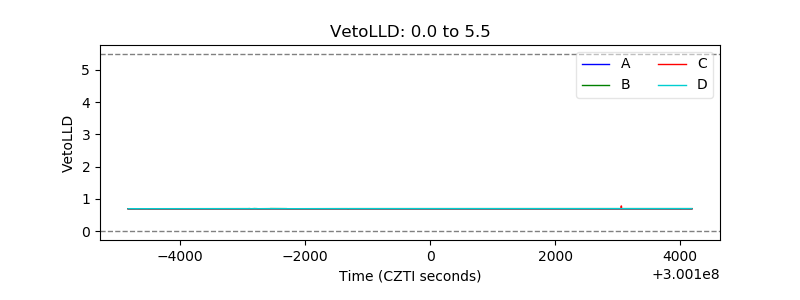 |
| Alpha Counter | 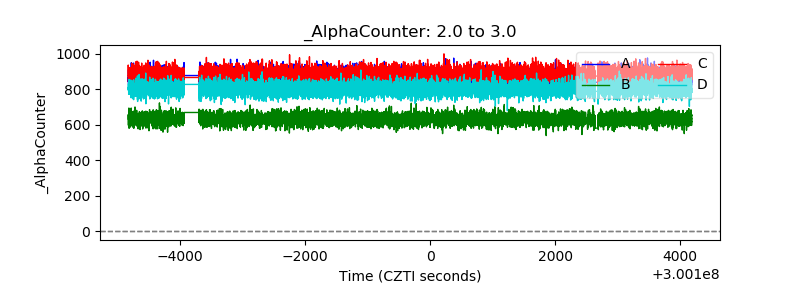 |
| _CPM_Rate | 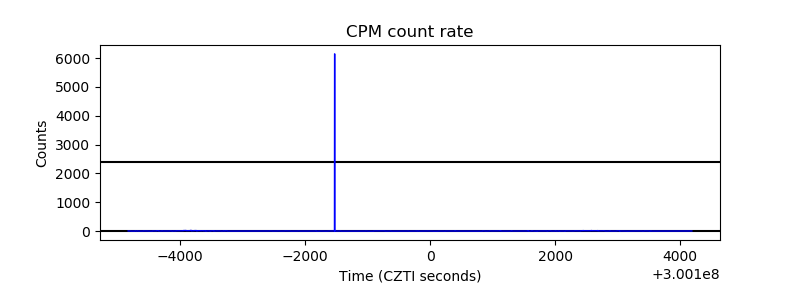 |
| CZT Counter | 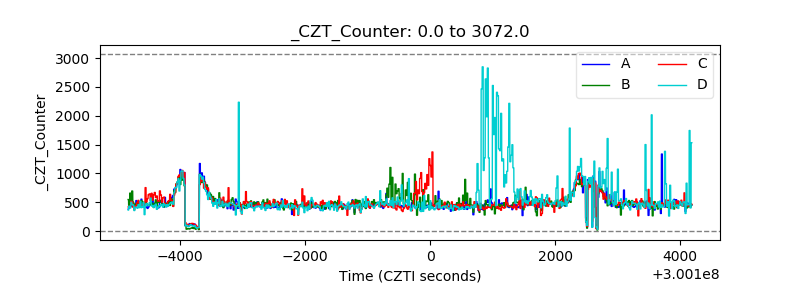 |
| +2.5 Volts monitor |  |
| +5 Volts monitor | 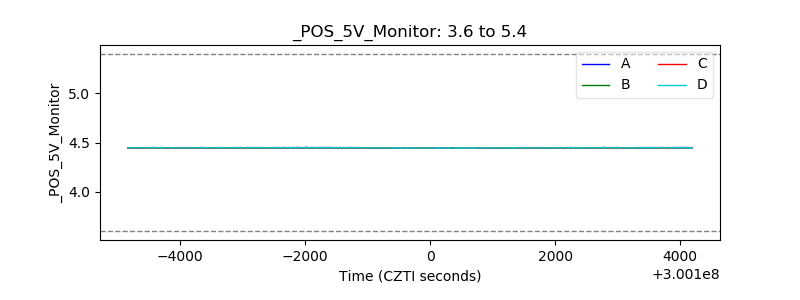 |
| _ROLL_ROT | 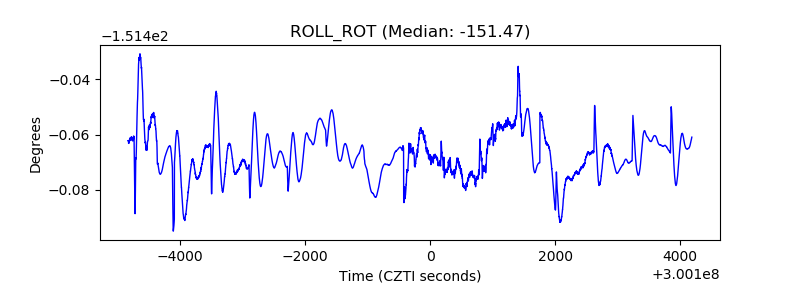 |
| _Roll_DEC | 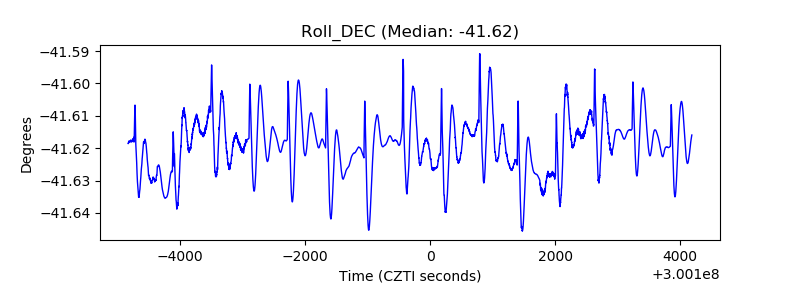 |
| _Roll_RA | 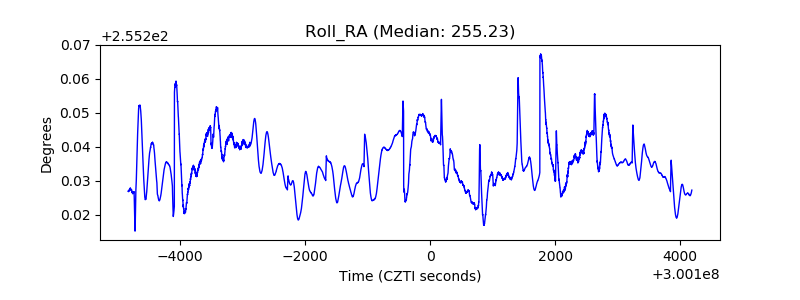 |
| Veto Counter | 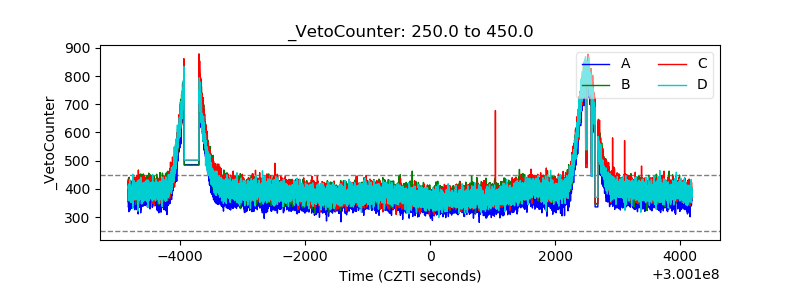 |