| Param | Original file | Final file |
|---|---|---|
| Filename | modeM0/AS1A05_205T01_9000003012_20386cztM0_level2.evt | modeM0/AS1A05_205T01_9000003012_20386cztM0_level2_quad_clean.evt |
| Size (bytes) | 565,752,960 | 89,559,360 |
| Size | 539.5 MB | 85.4 MB |
| Events in quadrant A | 3,878,953 | 548,445 |
| Events in quadrant B | 4,053,176 | 552,511 |
| Events in quadrant C | 3,942,221 | 533,647 |
| Events in quadrant D | 4,710,684 | 515,896 |
| Mode M9 | |||
|---|---|---|---|
| Quadrant | BADHDUFLAG | Total packets | Discarded packets |
| A | 0 | 6 | 0 |
| B | 0 | 6 | 0 |
| C | 0 | 6 | 0 |
| D | 0 | 6 | 0 |
| Mode SS | |||
|---|---|---|---|
| Quadrant | BADHDUFLAG | Total packets | Discarded packets |
| A | 0 | 164 | 0 |
| B | 0 | 164 | 0 |
| C | 0 | 164 | 0 |
| D | 0 | 164 | 0 |
| Mode M0 | |||
|---|---|---|---|
| Quadrant | BADHDUFLAG | Total packets | Discarded packets |
| A | 0 | 16819 | 2 |
| B | 0 | 17073 | 2 |
| C | 0 | 16850 | 2 |
| D | 0 | 19356 | 3 |
| Quadrant | Total seconds | Saturated seconds | Saturation percentage |
|---|---|---|---|
| A | 8085 | 315 | 3.896104% |
| B | 8086 | 373 | 4.612911% |
| C | 8086 | 370 | 4.575810% |
| D | 8085 | 435 | 5.380334% |
Noise dominated data is calculated using 1-second bins in cleaned event files. If a bin has >2000 counts, and if more than 50% of those come from <1% of pixels, then it is considered to be noise-dominated and hence unusable.
| Quadrant | # 1 sec bins | Bins with >0 counts | Bins with >2000 counts | High rate bins dominated by noise | Noise dominated (total time) | Noise dominated (detector-on time) | Marked lightcurve |
|---|---|---|---|---|---|---|---|
| A | 8605 | 8089 | 0 | 0 | 0.00% | 0.00% | 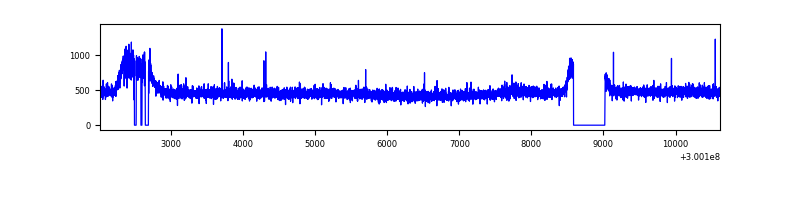 |
| B | 8606 | 8089 | 16 | 16 | 0.19% | 0.20% | 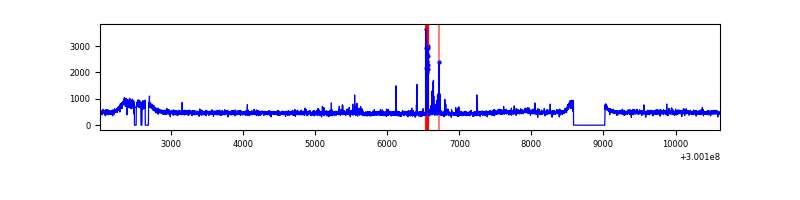 |
| C | 8606 | 8090 | 0 | 0 | 0.00% | 0.00% | 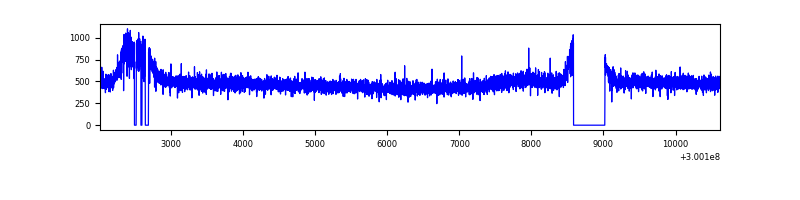 |
| D | 8605 | 8089 | 97 | 97 | 1.13% | 1.20% | 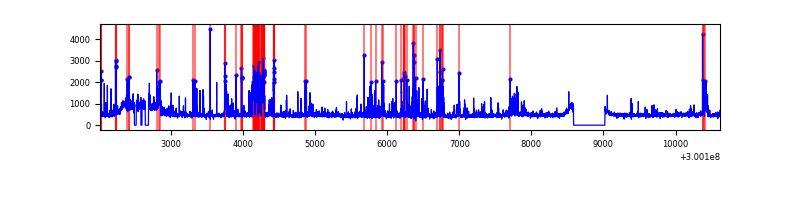 |
Top three noisy pixels from each quadrant. If the there are fewer than three noisy pixels in the level2.evt file, extra rows are filled as -1
| Pixel properties | Quadrant properties | ||||||
|---|---|---|---|---|---|---|---|
| Quadrant | DetID | PixID | Counts | Sigma | Mean | Median | Sigma |
| A | 0 | 226 | 8831 | 38.6 | 1002 | 977 | 203.4 |
| A | 3 | 137 | 8612 | 37.53 | 1002 | 977 | 203.4 |
| A | 12 | 194 | 7126 | 30.22 | 1002 | 977 | 203.4 |
| B | 7 | 220 | 75853 | 380.86 | 998 | 969 | 196.6 |
| B | 12 | 111 | 24133 | 117.81 | 998 | 969 | 196.6 |
| B | 11 | 111 | 21351 | 103.66 | 998 | 969 | 196.6 |
| C | 14 | 238 | 148614 | 643.65 | 966 | 971 | 229.4 |
| C | 8 | 128 | 12310 | 49.43 | 966 | 971 | 229.4 |
| C | 3 | 233 | 9095 | 35.42 | 966 | 971 | 229.4 |
| D | 1 | 52 | 729331 | 3048.15 | 979 | 949 | 239.0 |
| D | 13 | 153 | 149408 | 621.27 | 979 | 949 | 239.0 |
| D | 7 | 238 | 56317 | 231.71 | 979 | 949 | 239.0 |
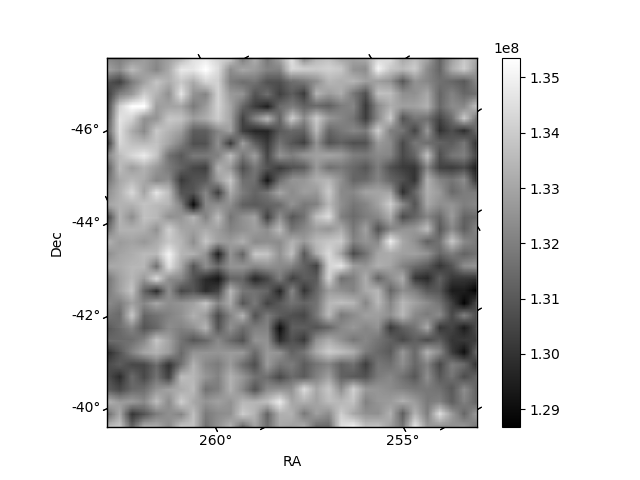
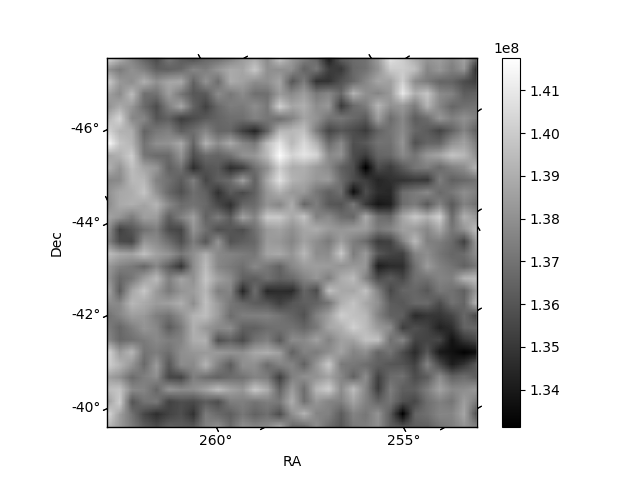
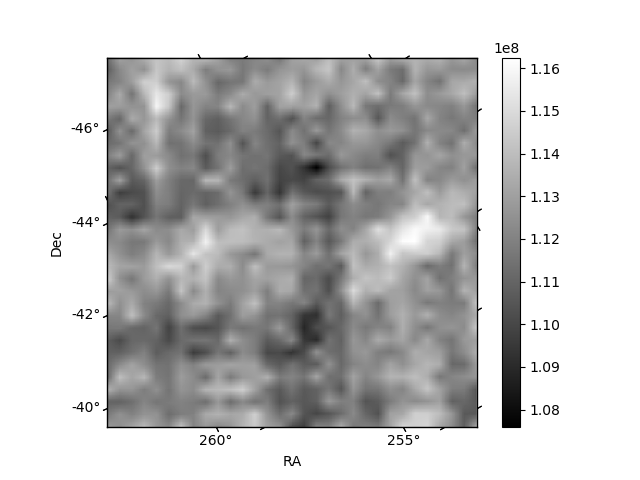
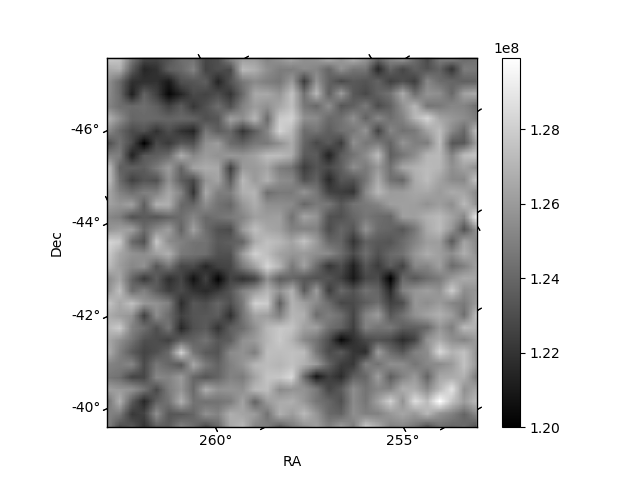
Histogram calculated using DETX and DETY for each event in the final _common_clean file
| Quadrant A | 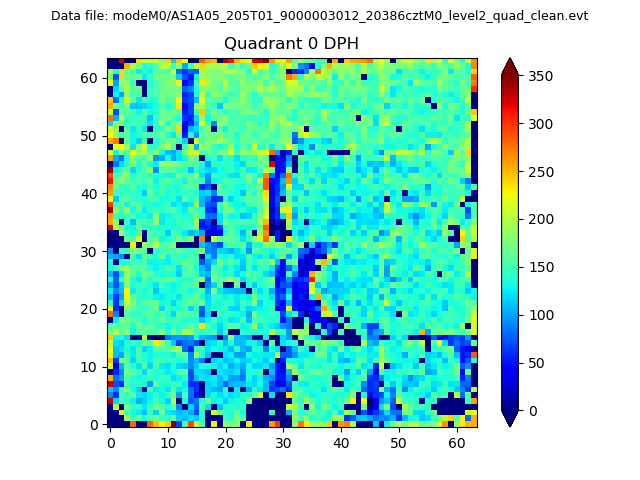 |
 |
Quadrant B |
|---|---|---|---|
| Quadrant D | 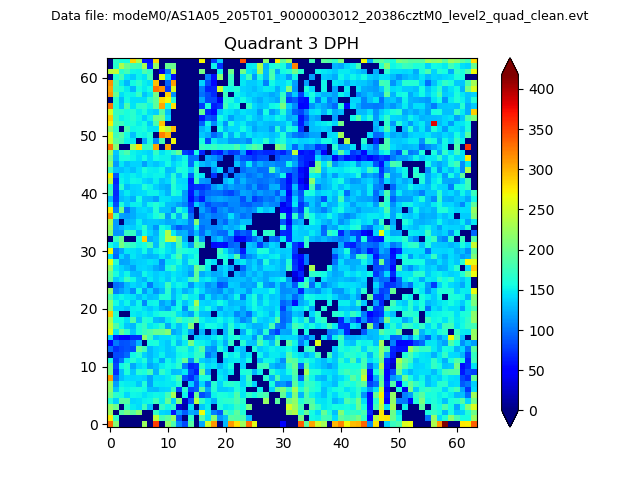 |
 |
Quadrant C |
| Plot type | Count rate plots | Images |
|---|---|---|
| Comparison with Poisson distribution Blue bars denote a histogram of data divided into 1 sec bins. Red curve is a Poisson curve with rate = median count rate of data. |
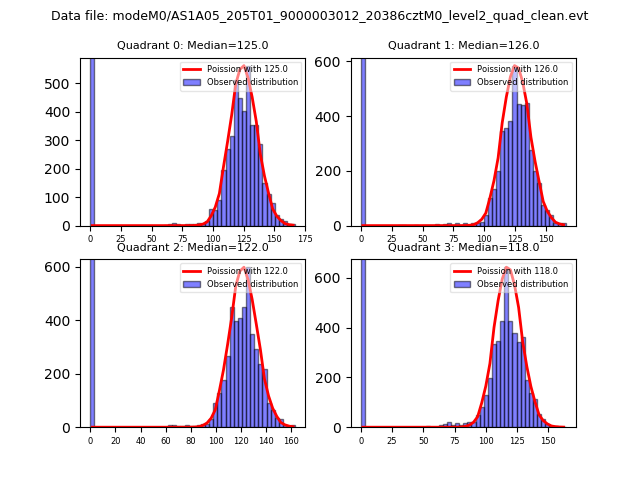 |
 |
| Quadrant-wise count rates Data is divided into 100 sec bins |
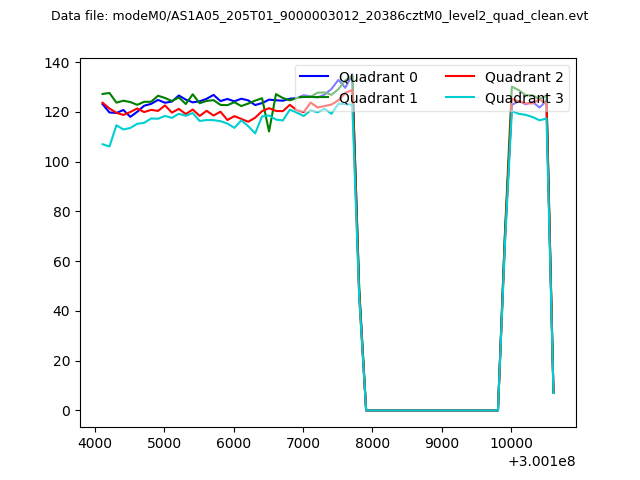 |
|
| Module-wise count rates for Quadrant A Data is divided into 100 sec bins |
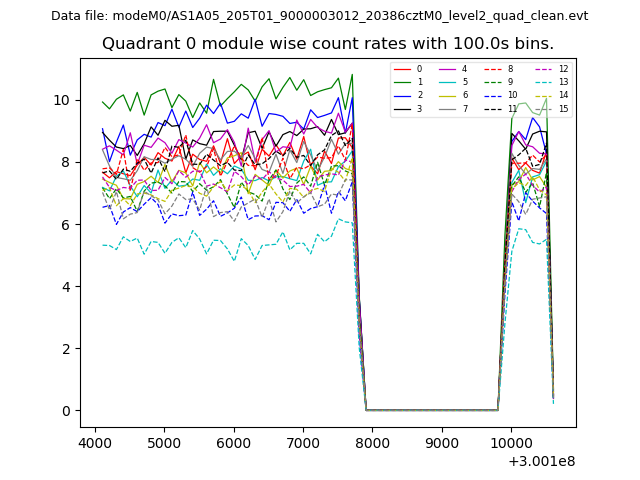 |
 |
| Module-wise count rates for Quadrant B Data is divided into 100 sec bins |
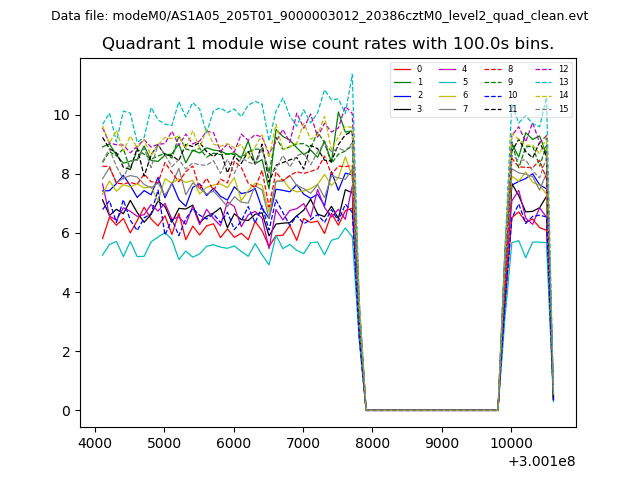 |
 |
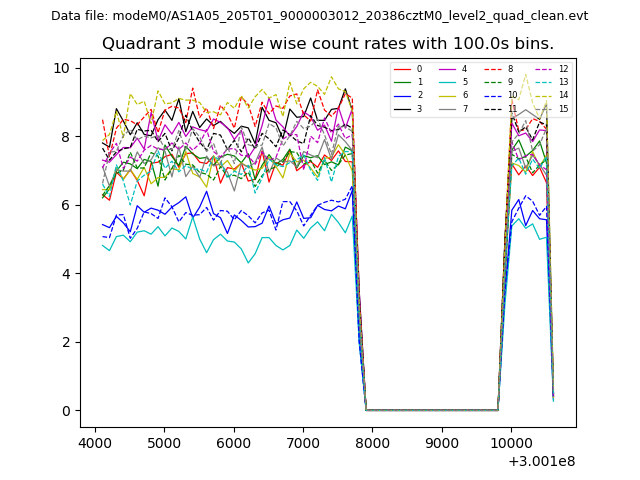
| Module-wise count rates for Quadrant C Data is divided into 100 sec bins |
 |
 |
| Module-wise count rates for Quadrant D Data is divided into 100 sec bins |
 |
 |
| Parameter | Plot |
|---|---|
| CZT HV Monitor | 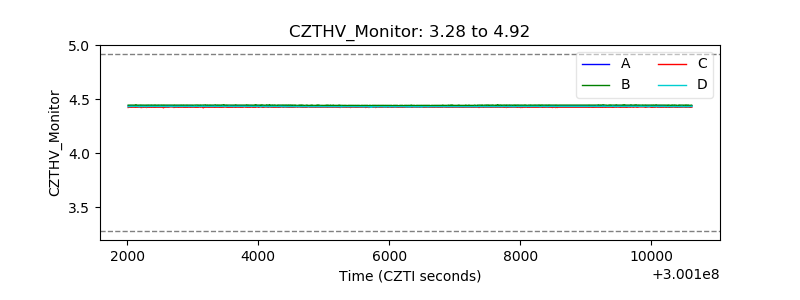 |
| D_VDD | 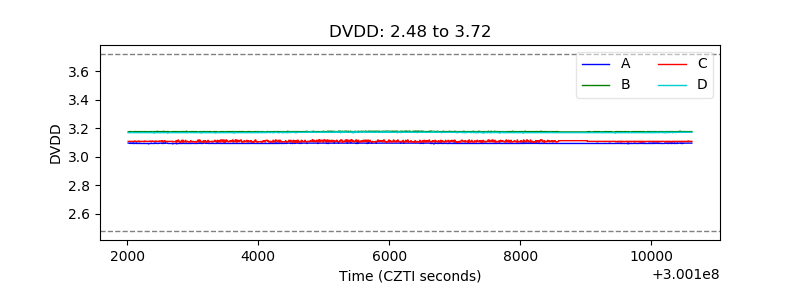 |
| Temperature 1 | 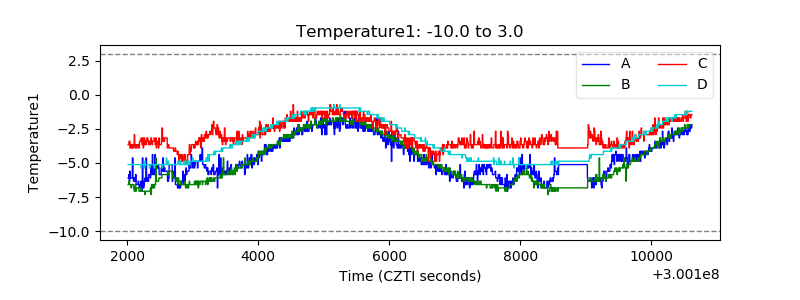 |
| Veto HV Monitor |  |
| Veto LLD | 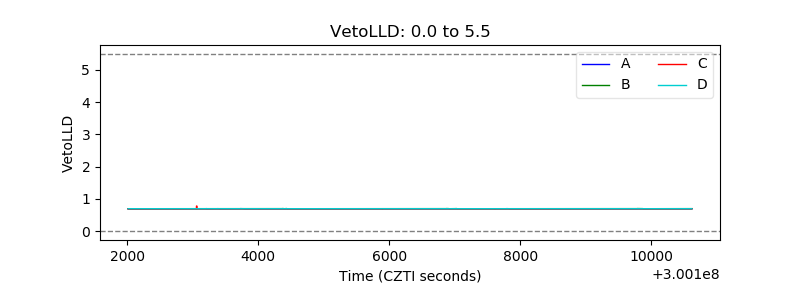 |
| Alpha Counter | 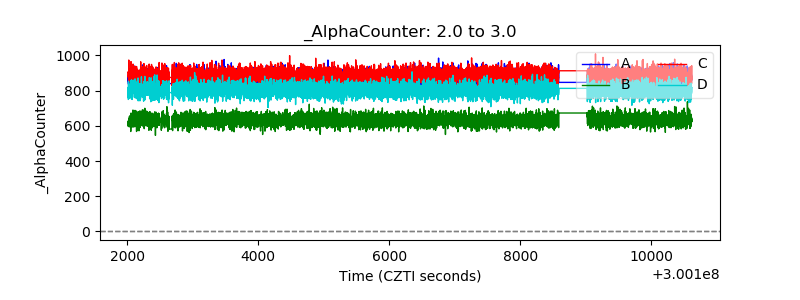 |
| _CPM_Rate | 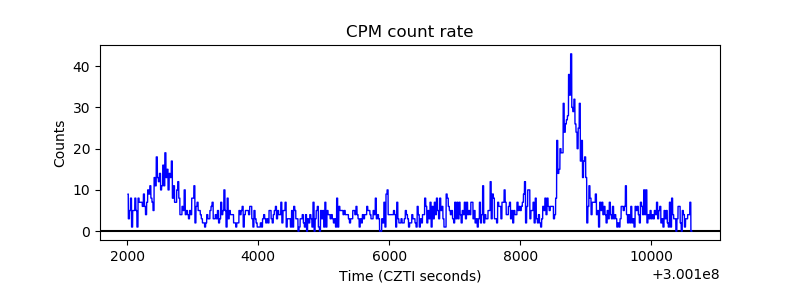 |
| CZT Counter | 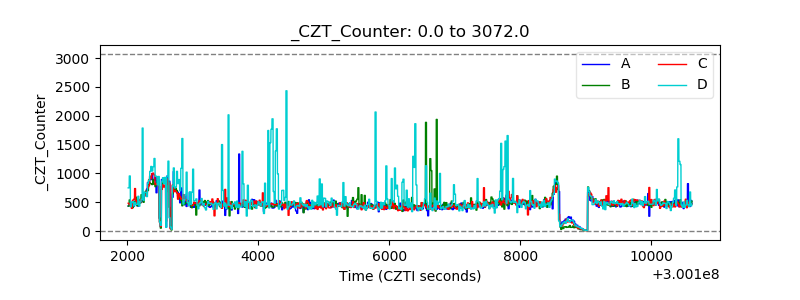 |
| +2.5 Volts monitor |  |
| +5 Volts monitor | 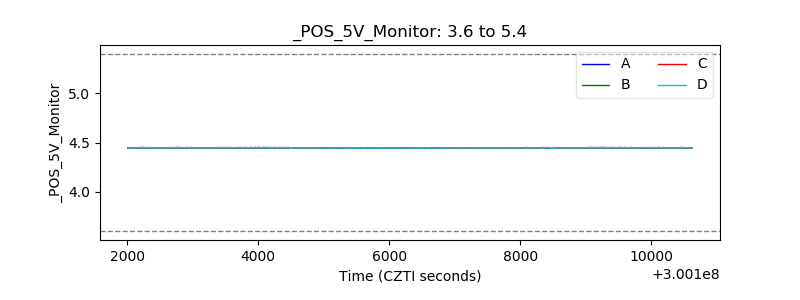 |
| _ROLL_ROT | 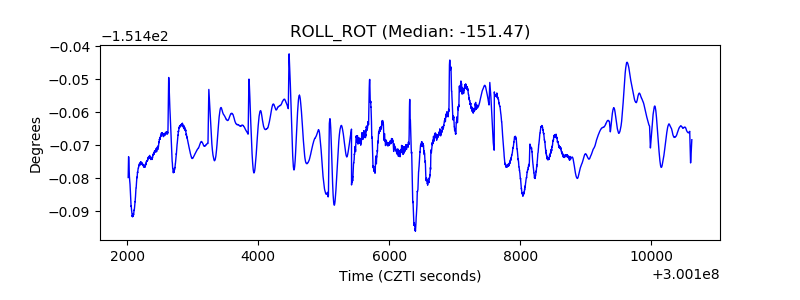 |
| _Roll_DEC | 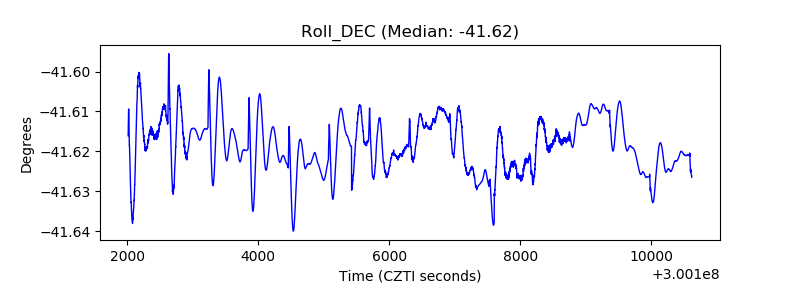 |
| _Roll_RA |  |
| Veto Counter | 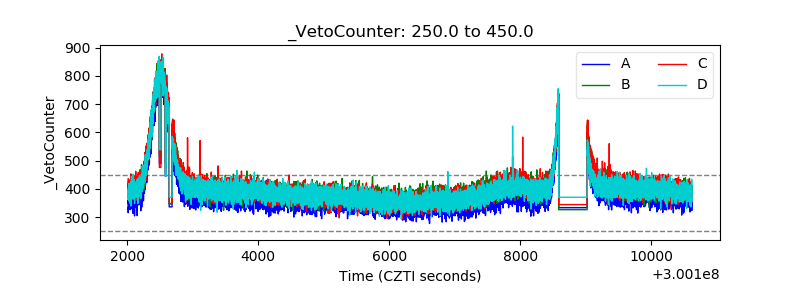 |