| Param | Original file | Final file |
|---|---|---|
| Filename | modeM0/AS1A05_205T01_9000003012_20388cztM0_level2.evt | modeM0/AS1A05_205T01_9000003012_20388cztM0_level2_quad_clean.evt |
| Size (bytes) | 241,223,040 | 50,402,880 |
| Size | 230.0 MB | 48.1 MB |
| Events in quadrant A | 1,622,315 | 324,268 |
| Events in quadrant B | 1,949,407 | 323,670 |
| Events in quadrant C | 1,613,538 | 316,101 |
| Events in quadrant D | 1,875,494 | 309,024 |
| Mode M9 | |||
|---|---|---|---|
| Quadrant | BADHDUFLAG | Total packets | Discarded packets |
| A | 0 | 3 | 0 |
| B | 0 | 4 | 0 |
| C | 0 | 4 | 0 |
| D | 0 | 4 | 0 |
| Mode SS | |||
|---|---|---|---|
| Quadrant | BADHDUFLAG | Total packets | Discarded packets |
| A | 0 | 72 | 0 |
| B | 0 | 72 | 0 |
| C | 0 | 72 | 0 |
| D | 0 | 72 | 0 |
| Mode M0 | |||
|---|---|---|---|
| Quadrant | BADHDUFLAG | Total packets | Discarded packets |
| A | 0 | 7211 | 1 |
| B | 0 | 8050 | 1 |
| C | 0 | 7209 | 1 |
| D | 0 | 7981 | 1 |
| Quadrant | Total seconds | Saturated seconds | Saturation percentage |
|---|---|---|---|
| A | 3571 | 7 | 0.196024% |
| B | 3571 | 75 | 2.100252% |
| C | 3571 | 21 | 0.588071% |
| D | 3571 | 25 | 0.700084% |
Noise dominated data is calculated using 1-second bins in cleaned event files. If a bin has >2000 counts, and if more than 50% of those come from <1% of pixels, then it is considered to be noise-dominated and hence unusable.
| Quadrant | # 1 sec bins | Bins with >0 counts | Bins with >2000 counts | High rate bins dominated by noise | Noise dominated (total time) | Noise dominated (detector-on time) | Marked lightcurve |
|---|---|---|---|---|---|---|---|
| A | 3571 | 3571 | 0 | 0 | 0.00% | 0.00% | 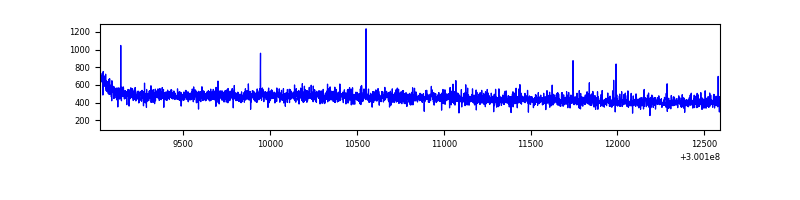 |
| B | 3571 | 3571 | 50 | 50 | 1.40% | 1.40% | 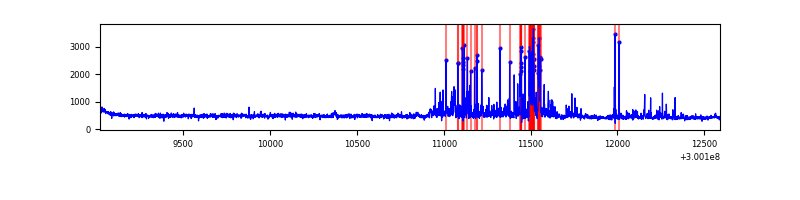 |
| C | 3571 | 3571 | 0 | 0 | 0.00% | 0.00% | 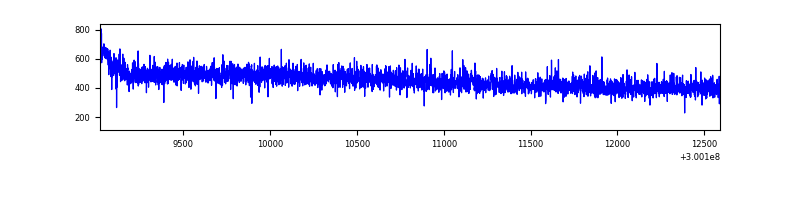 |
| D | 3571 | 3571 | 15 | 15 | 0.42% | 0.42% | 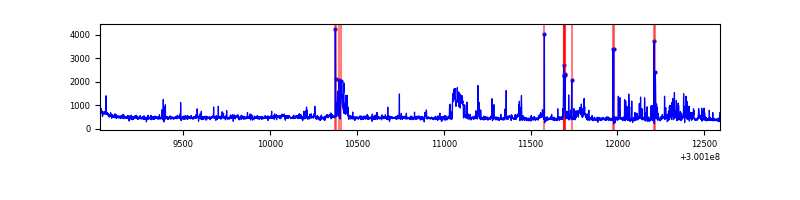 |
Top three noisy pixels from each quadrant. If the there are fewer than three noisy pixels in the level2.evt file, extra rows are filled as -1
| Pixel properties | Quadrant properties | ||||||
|---|---|---|---|---|---|---|---|
| Quadrant | DetID | PixID | Counts | Sigma | Mean | Median | Sigma |
| A | 6 | 16 | 4660 | 49.43 | 419 | 408 | 86.0 |
| A | 0 | 226 | 3677 | 38.0 | 419 | 408 | 86.0 |
| A | 3 | 137 | 3413 | 34.93 | 419 | 408 | 86.0 |
| B | 7 | 220 | 291126 | 3607.23 | 411 | 401 | 80.6 |
| B | 0 | 197 | 18392 | 223.23 | 411 | 401 | 80.6 |
| B | 0 | 198 | 10239 | 122.07 | 411 | 401 | 80.6 |
| C | 14 | 238 | 62651 | 656.29 | 397 | 398 | 94.9 |
| C | 13 | 61 | 2807 | 25.4 | 397 | 398 | 94.9 |
| C | 7 | 220 | 1741 | 14.16 | 397 | 398 | 94.9 |
| D | 1 | 52 | 106958 | 1071.86 | 405 | 393 | 99.4 |
| D | 13 | 153 | 83427 | 835.18 | 405 | 393 | 99.4 |
| D | 1 | 20 | 63448 | 634.23 | 405 | 393 | 99.4 |
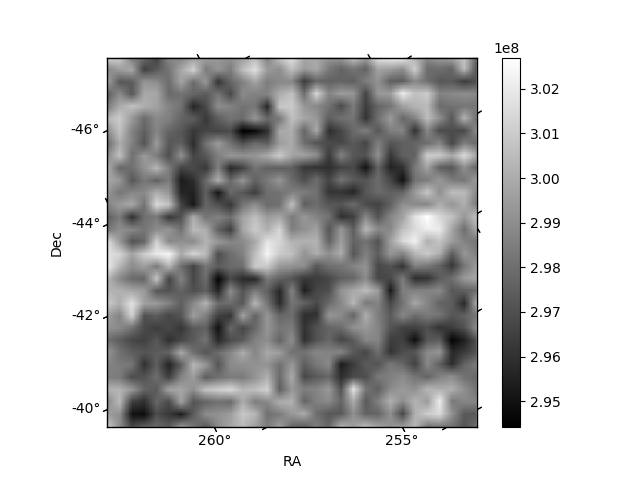
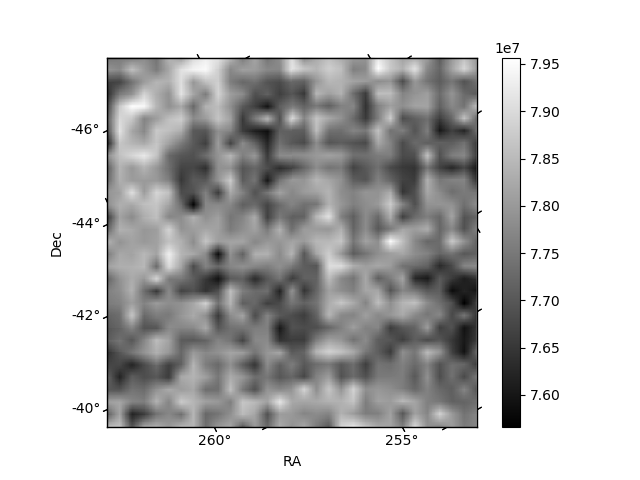
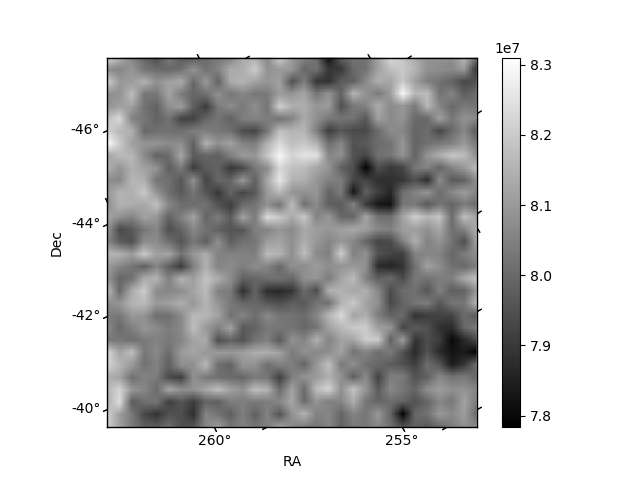
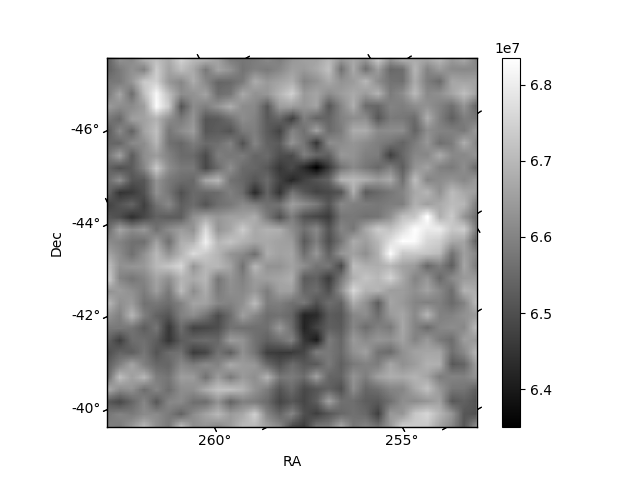
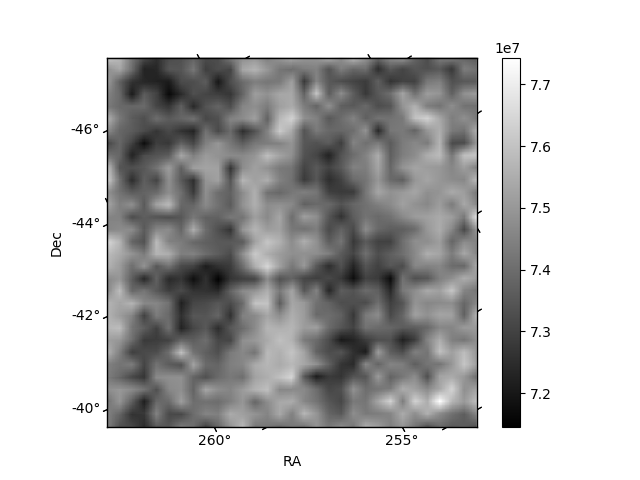
Histogram calculated using DETX and DETY for each event in the final _common_clean file
| Quadrant A | 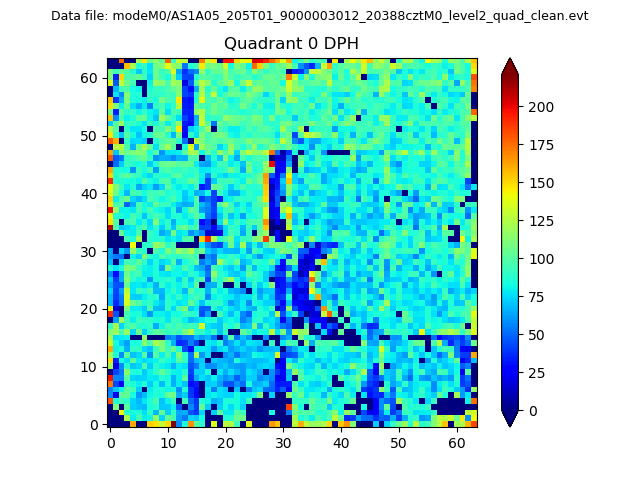 |
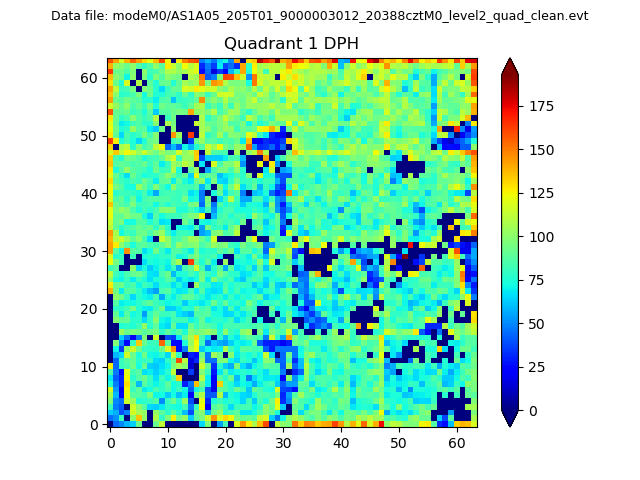 |
Quadrant B |
|---|---|---|---|
| Quadrant D | 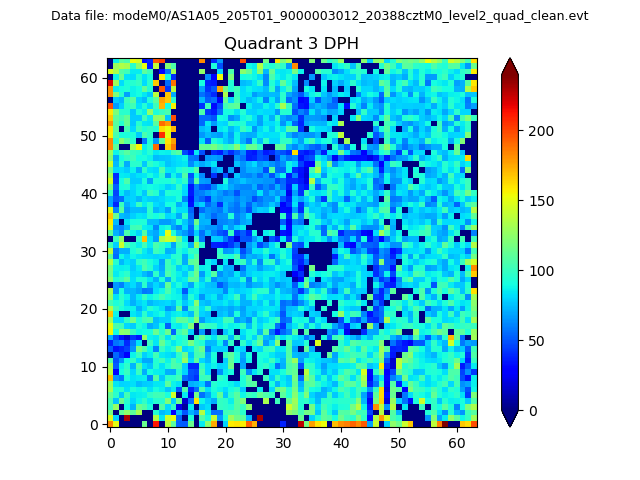 |
 |
Quadrant C |
| Plot type | Count rate plots | Images |
|---|---|---|
| Comparison with Poisson distribution Blue bars denote a histogram of data divided into 1 sec bins. Red curve is a Poisson curve with rate = median count rate of data. |
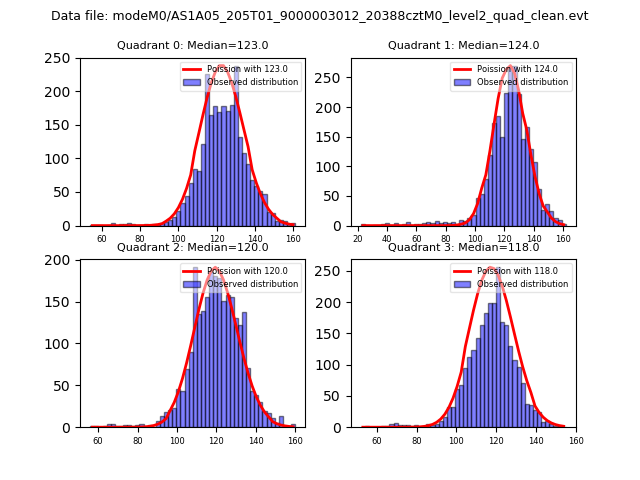 |
 |
| Quadrant-wise count rates Data is divided into 100 sec bins |
 |
|
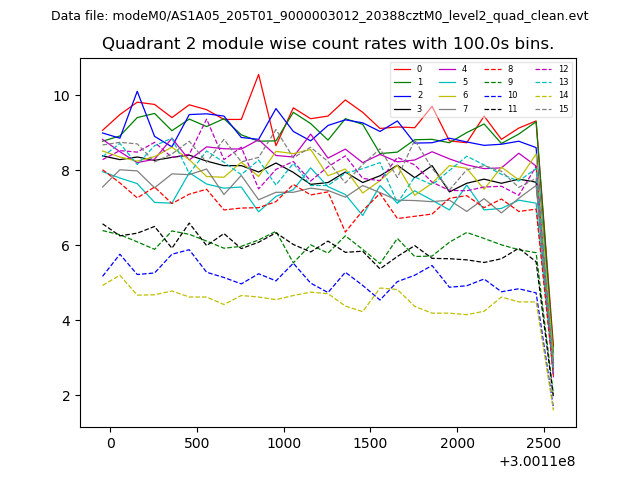
| Module-wise count rates for Quadrant A Data is divided into 100 sec bins |
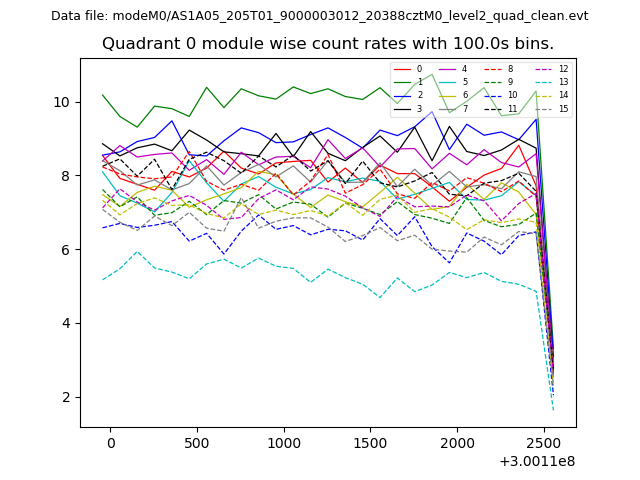 |
 |
| Module-wise count rates for Quadrant B Data is divided into 100 sec bins |
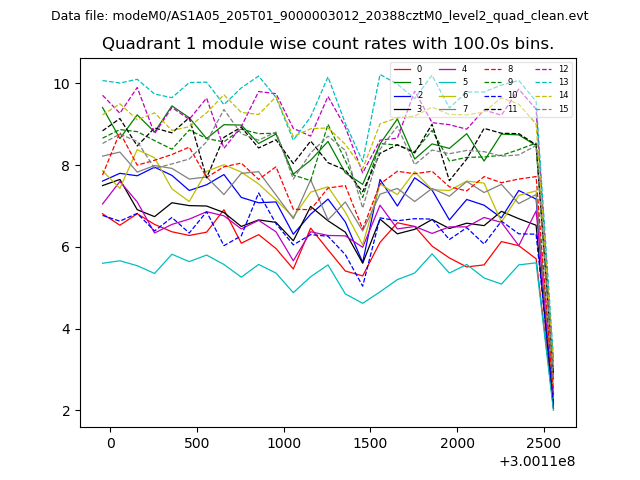 |
 |
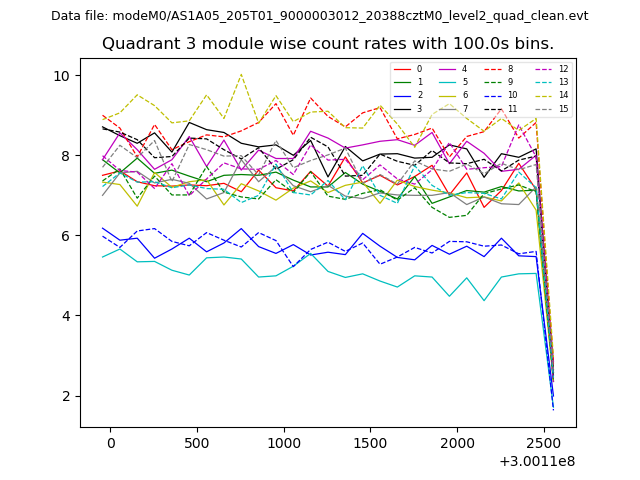
| Module-wise count rates for Quadrant C Data is divided into 100 sec bins |
 |
 |
| Module-wise count rates for Quadrant D Data is divided into 100 sec bins |
 |
 |
| Parameter | Plot |
|---|---|
| CZT HV Monitor | 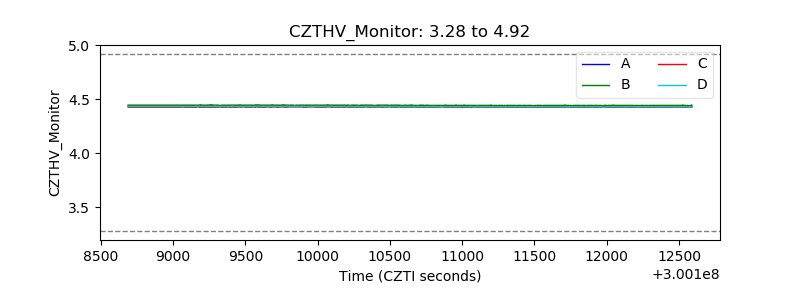 |
| D_VDD | 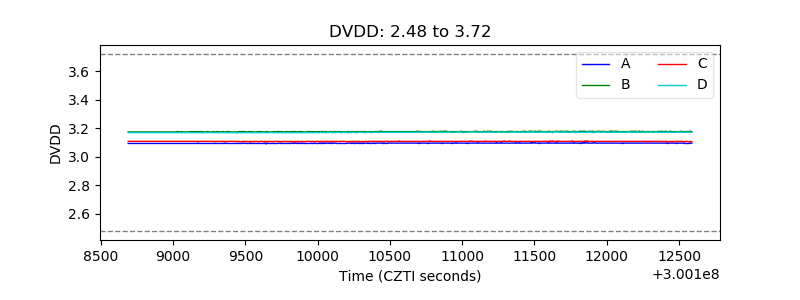 |
| Temperature 1 | 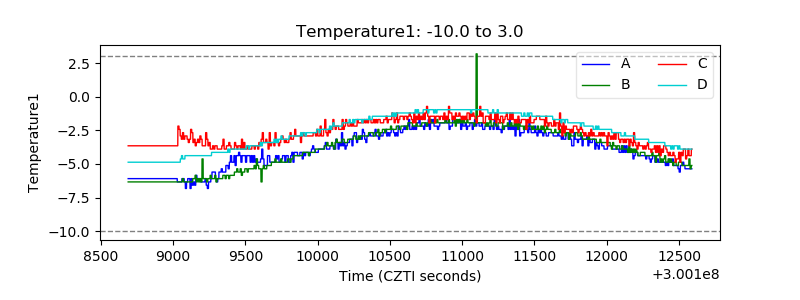 |
| Veto HV Monitor | 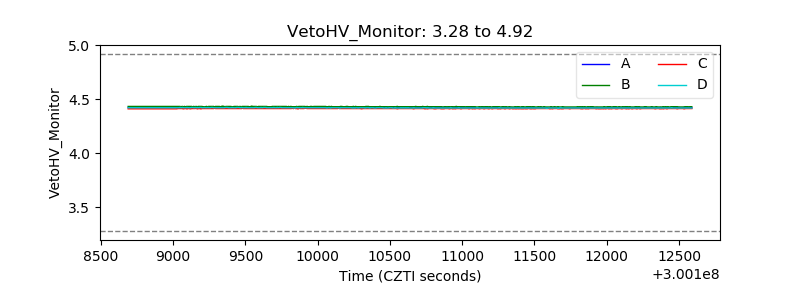 |
| Veto LLD | 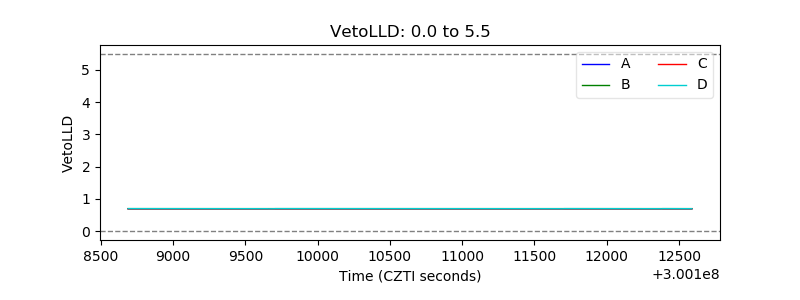 |
| Alpha Counter |  |
| _CPM_Rate |  |
| CZT Counter | 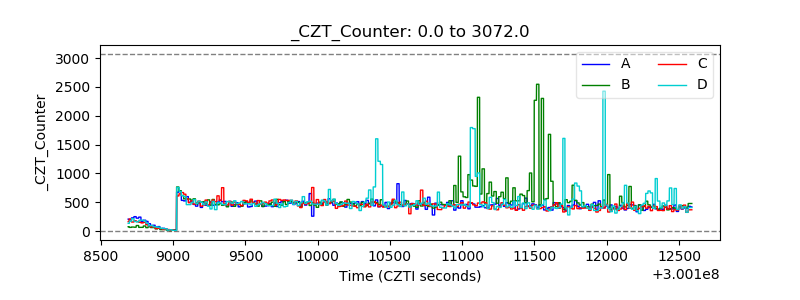 |
| +2.5 Volts monitor |  |
| +5 Volts monitor |  |
| _ROLL_ROT | 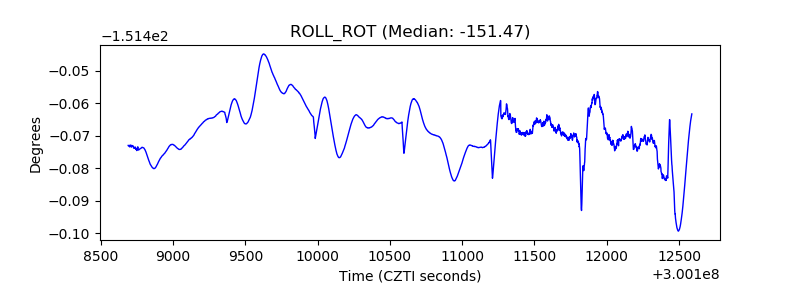 |
| _Roll_DEC | 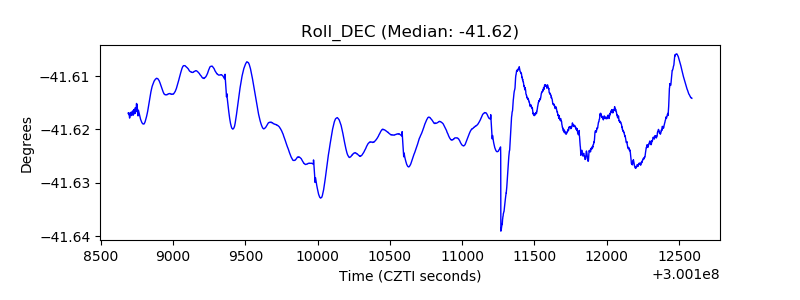 |
| _Roll_RA | 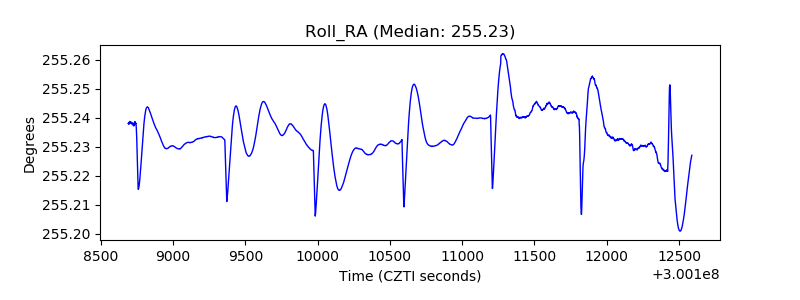 |
| Veto Counter | 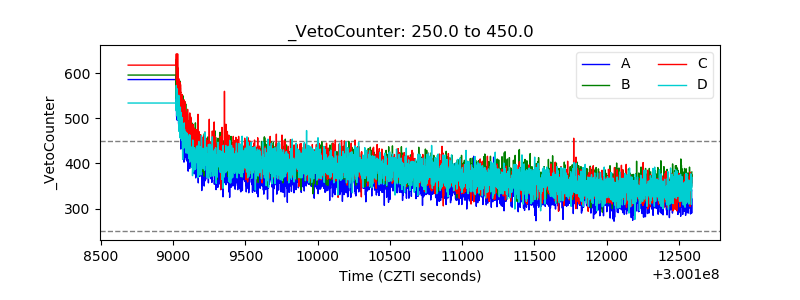 |