| Param | Original file | Final file |
|---|---|---|
| Filename | modeM0/AS1A05_198T01_9000003014_20389cztM0_level2.evt | modeM0/AS1A05_198T01_9000003014_20389cztM0_level2_quad_clean.evt |
| Size (bytes) | 471,188,160 | 76,354,560 |
| Size | 449.4 MB | 72.8 MB |
| Events in quadrant A | 3,124,106 | 476,624 |
| Events in quadrant B | 3,550,230 | 477,367 |
| Events in quadrant C | 3,165,374 | 455,084 |
| Events in quadrant D | 3,987,305 | 448,219 |
| Mode SS | |||
|---|---|---|---|
| Quadrant | BADHDUFLAG | Total packets | Discarded packets |
| A | 0 | 132 | 0 |
| B | 0 | 132 | 0 |
| C | 0 | 132 | 0 |
| D | 0 | 132 | 0 |
| Mode M0 | |||
|---|---|---|---|
| Quadrant | BADHDUFLAG | Total packets | Discarded packets |
| A | 0 | 13433 | 1 |
| B | 0 | 14827 | 1 |
| C | 0 | 13442 | 1 |
| D | 0 | 16044 | 5 |
| Mode M9 | |||
|---|---|---|---|
| Quadrant | BADHDUFLAG | Total packets | Discarded packets |
| A | 0 | 9 | 0 |
| B | 0 | 9 | 0 |
| C | 0 | 9 | 0 |
| D | 0 | 9 | 0 |
| Quadrant | Total seconds | Saturated seconds | Saturation percentage |
|---|---|---|---|
| A | 6521 | 50 | 0.766754% |
| B | 6521 | 158 | 2.422941% |
| C | 6522 | 59 | 0.904630% |
| D | 6521 | 145 | 2.223585% |
Noise dominated data is calculated using 1-second bins in cleaned event files. If a bin has >2000 counts, and if more than 50% of those come from <1% of pixels, then it is considered to be noise-dominated and hence unusable.
| Quadrant | # 1 sec bins | Bins with >0 counts | Bins with >2000 counts | High rate bins dominated by noise | Noise dominated (total time) | Noise dominated (detector-on time) | Marked lightcurve |
|---|---|---|---|---|---|---|---|
| A | 7476 | 6522 | 0 | 0 | 0.00% | 0.00% | 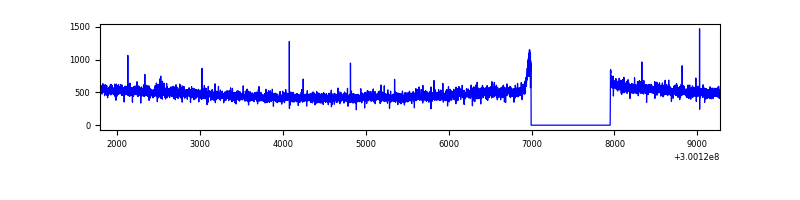 |
| B | 7476 | 6521 | 50 | 50 | 0.67% | 0.77% | 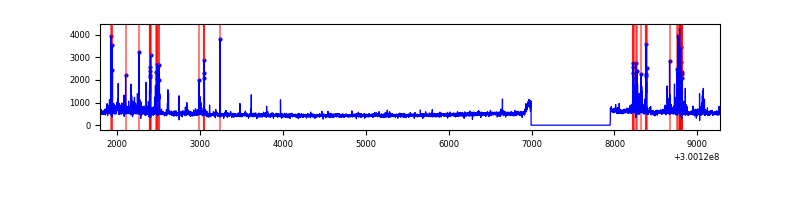 |
| C | 7477 | 6523 | 0 | 0 | 0.00% | 0.00% | 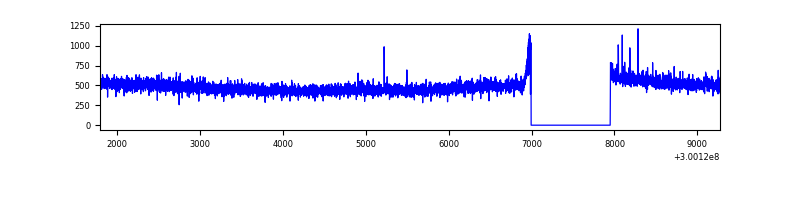 |
| D | 7476 | 6521 | 98 | 98 | 1.31% | 1.50% | 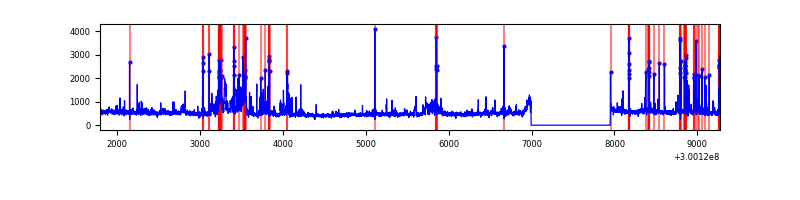 |
Top three noisy pixels from each quadrant. If the there are fewer than three noisy pixels in the level2.evt file, extra rows are filled as -1
| Pixel properties | Quadrant properties | ||||||
|---|---|---|---|---|---|---|---|
| Quadrant | DetID | PixID | Counts | Sigma | Mean | Median | Sigma |
| A | 0 | 226 | 7037 | 38.18 | 810 | 793 | 163.5 |
| A | 3 | 137 | 6635 | 35.73 | 810 | 793 | 163.5 |
| A | 12 | 194 | 5775 | 30.47 | 810 | 793 | 163.5 |
| B | 7 | 220 | 325807 | 2104.9 | 800 | 780 | 154.4 |
| B | 4 | 216 | 28661 | 180.56 | 800 | 780 | 154.4 |
| B | 12 | 111 | 18650 | 115.73 | 800 | 780 | 154.4 |
| C | 14 | 238 | 120818 | 658.41 | 775 | 780 | 182.3 |
| C | 9 | 221 | 14089 | 73.0 | 775 | 780 | 182.3 |
| C | 13 | 61 | 5371 | 25.18 | 775 | 780 | 182.3 |
| D | 1 | 52 | 975117 | 5086.87 | 785 | 761 | 191.5 |
| D | 2 | 234 | 23438 | 118.39 | 785 | 761 | 191.5 |
| D | 13 | 153 | 19910 | 99.97 | 785 | 761 | 191.5 |
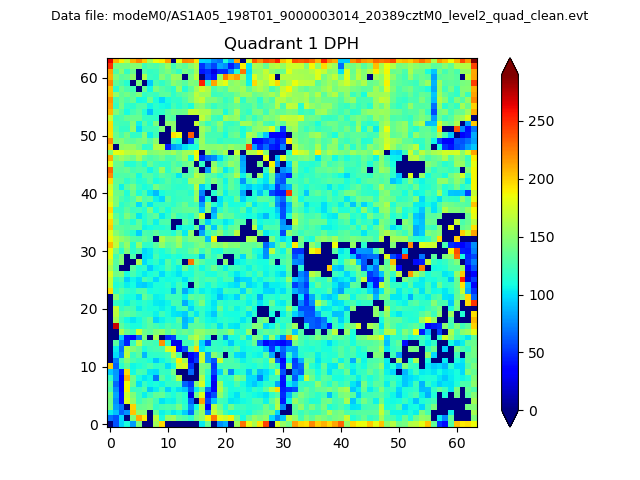
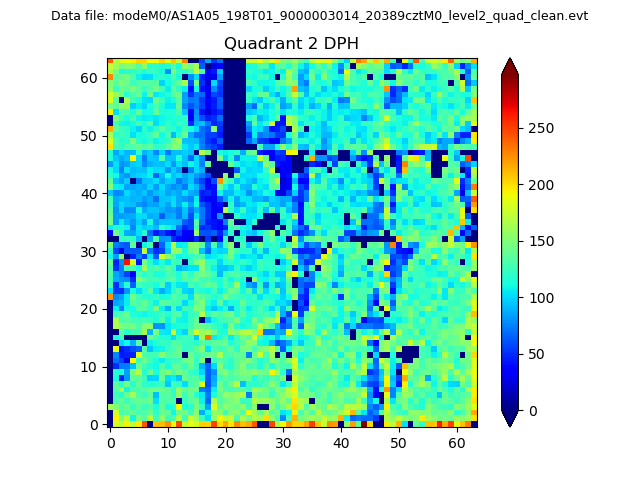
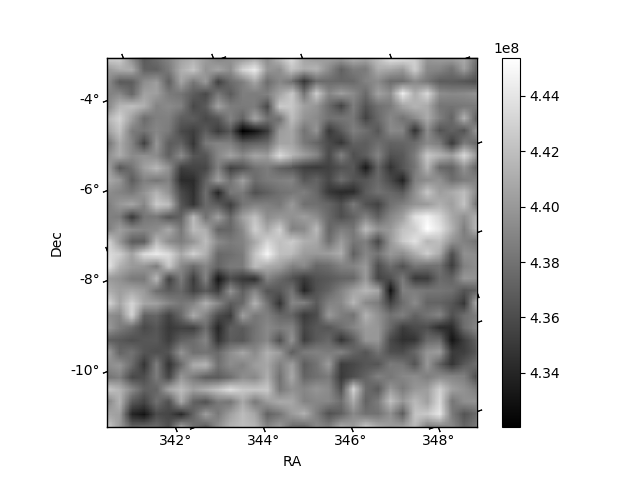
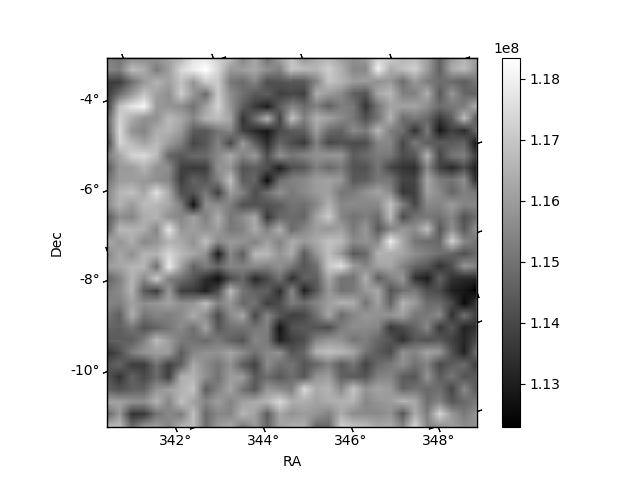
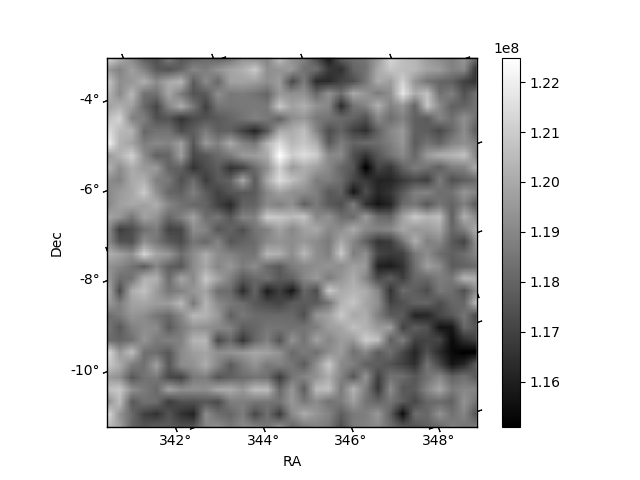
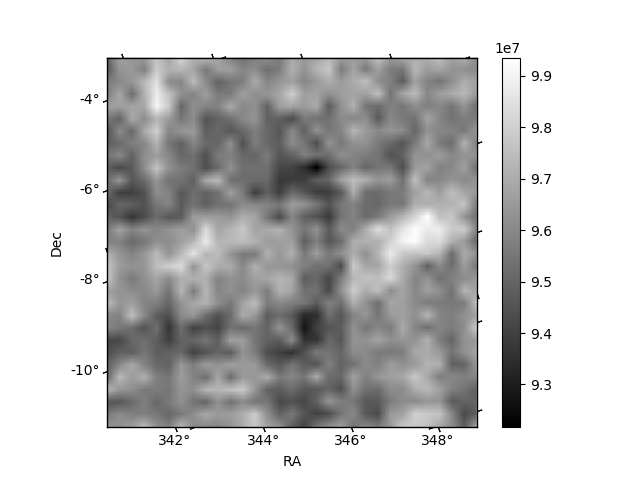
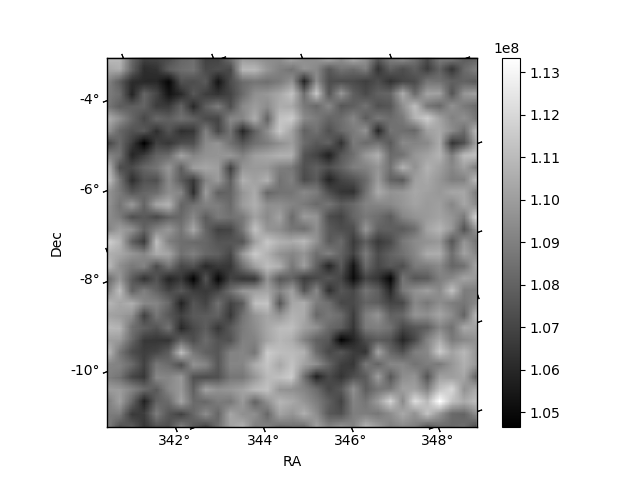
Histogram calculated using DETX and DETY for each event in the final _common_clean file
| Quadrant A |  |
 |
Quadrant B |
|---|---|---|---|
| Quadrant D | 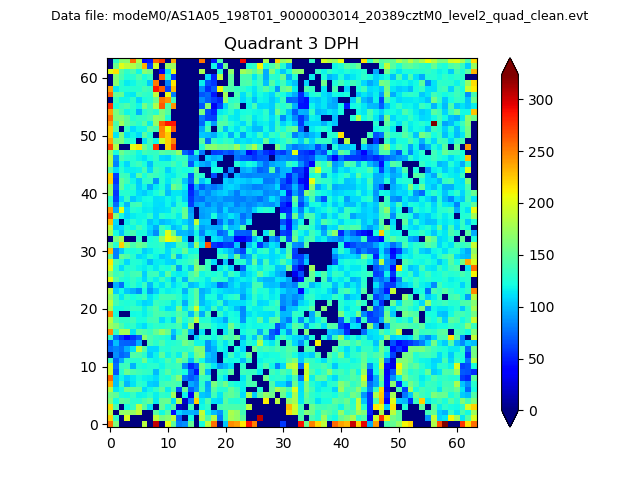 |
 |
Quadrant C |
| Plot type | Count rate plots | Images |
|---|---|---|
| Comparison with Poisson distribution Blue bars denote a histogram of data divided into 1 sec bins. Red curve is a Poisson curve with rate = median count rate of data. |
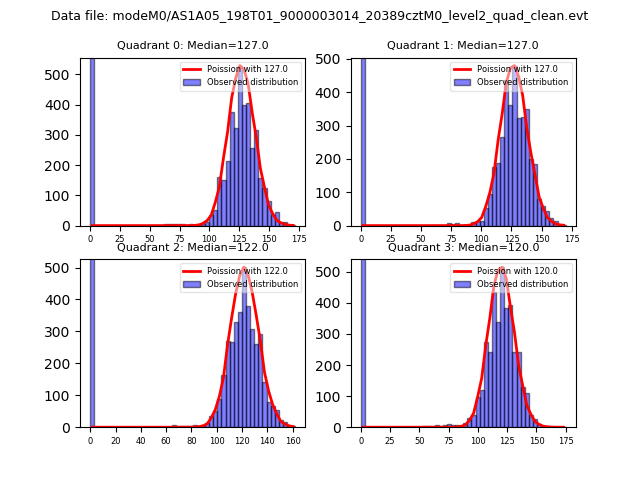 |
 |
| Quadrant-wise count rates Data is divided into 100 sec bins |
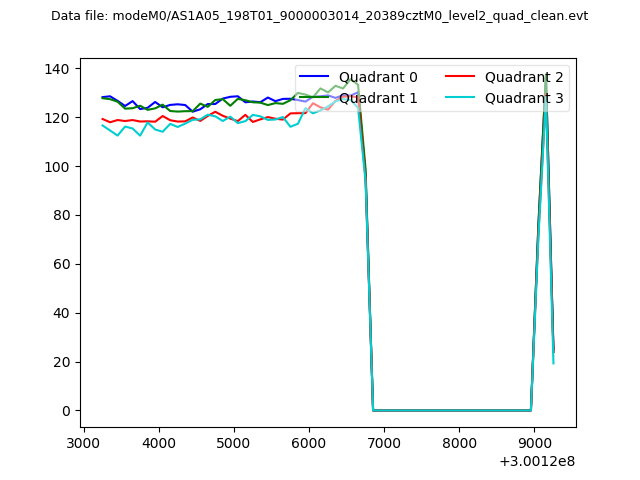 |
|
| Module-wise count rates for Quadrant A Data is divided into 100 sec bins |
 |
 |
| Module-wise count rates for Quadrant B Data is divided into 100 sec bins |
 |
 |
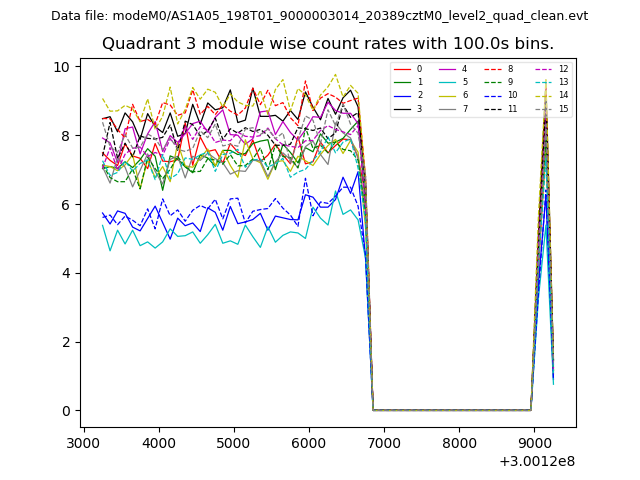
| Module-wise count rates for Quadrant C Data is divided into 100 sec bins |
 |
 |
| Module-wise count rates for Quadrant D Data is divided into 100 sec bins |
 |
 |
| Parameter | Plot |
|---|---|
| CZT HV Monitor |  |
| D_VDD | 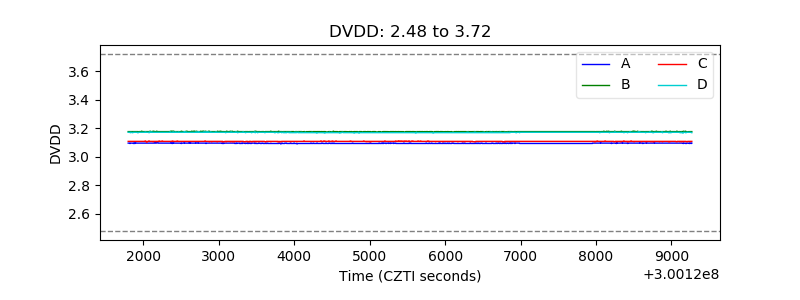 |
| Temperature 1 | 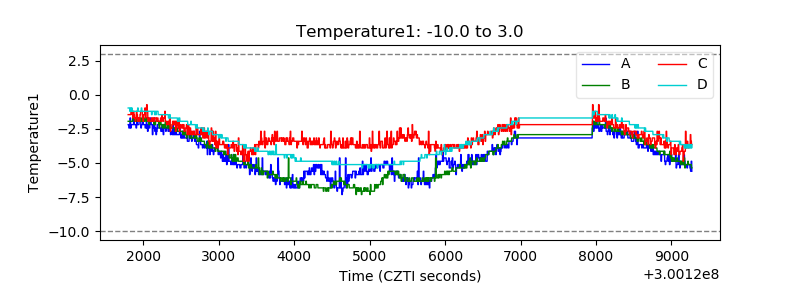 |
| Veto HV Monitor | 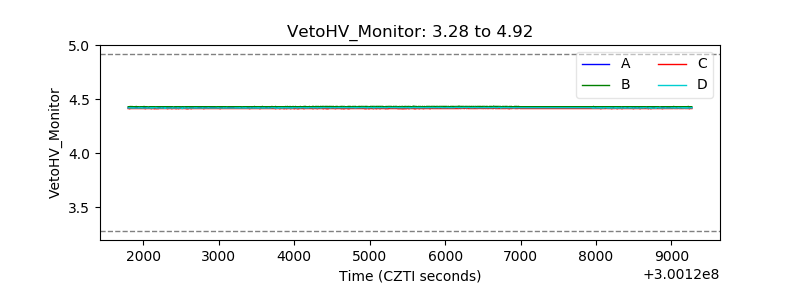 |
| Veto LLD | 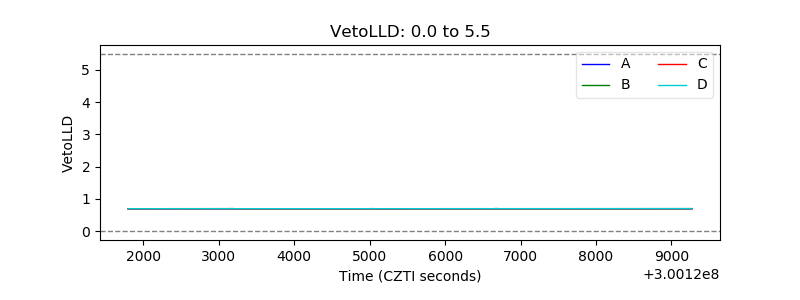 |
| Alpha Counter | 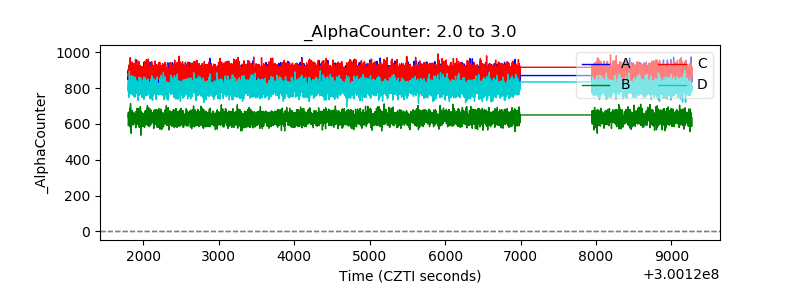 |
| _CPM_Rate | 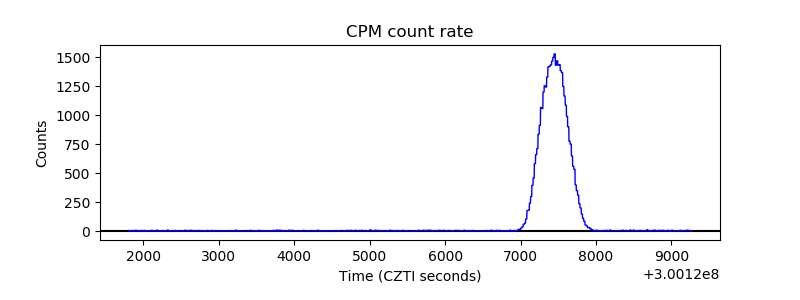 |
| CZT Counter | 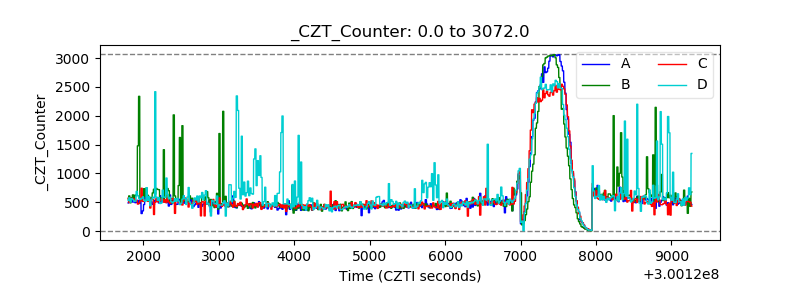 |
| +2.5 Volts monitor |  |
| +5 Volts monitor | 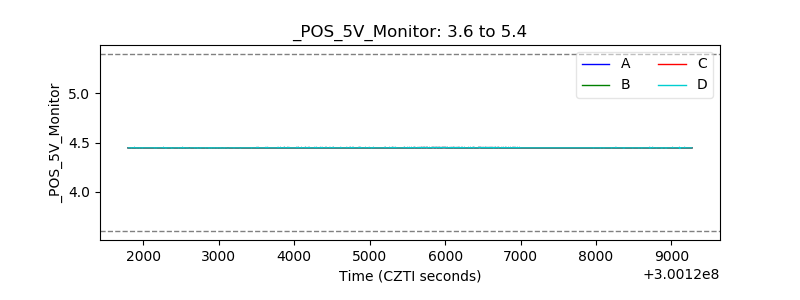 |
| _ROLL_ROT | 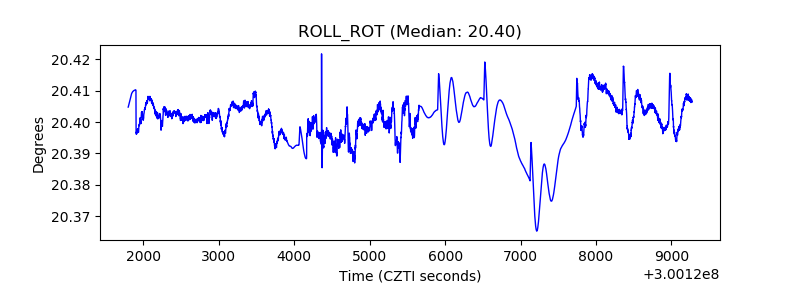 |
| _Roll_DEC | 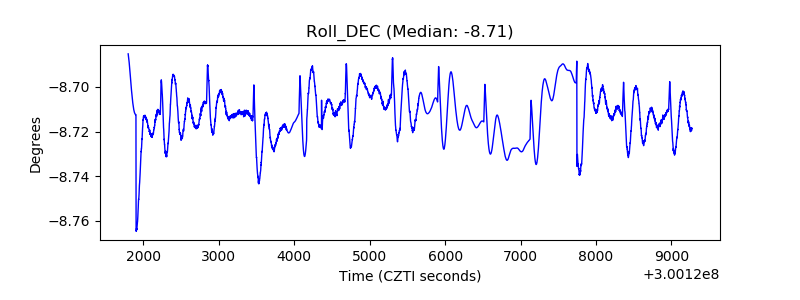 |
| _Roll_RA | 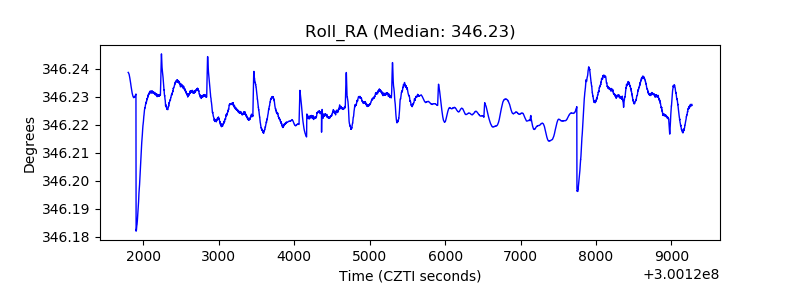 |
| Veto Counter | 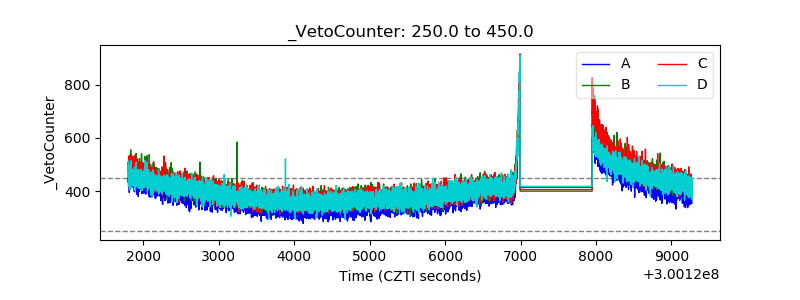 |