| Param | Original file | Final file |
|---|---|---|
| Filename | modeM0/AS1A05_198T01_9000003014_20390cztM0_level2.evt | modeM0/AS1A05_198T01_9000003014_20390cztM0_level2_quad_clean.evt |
| Size (bytes) | 536,065,920 | 88,398,720 |
| Size | 511.2 MB | 84.3 MB |
| Events in quadrant A | 3,376,985 | 565,194 |
| Events in quadrant B | 3,655,079 | 567,137 |
| Events in quadrant C | 3,452,500 | 543,155 |
| Events in quadrant D | 5,290,135 | 528,636 |
| Mode SS | |||
|---|---|---|---|
| Quadrant | BADHDUFLAG | Total packets | Discarded packets |
| A | 0 | 140 | 0 |
| B | 0 | 140 | 0 |
| C | 0 | 140 | 0 |
| D | 0 | 140 | 0 |
| Mode M0 | |||
|---|---|---|---|
| Quadrant | BADHDUFLAG | Total packets | Discarded packets |
| A | 0 | 14402 | 3 |
| B | 0 | 15297 | 2 |
| C | 0 | 14519 | 2 |
| D | 0 | 20104 | 2 |
| Mode M9 | |||
|---|---|---|---|
| Quadrant | BADHDUFLAG | Total packets | Discarded packets |
| A | 0 | 20 | 0 |
| B | 0 | 20 | 0 |
| C | 0 | 20 | 0 |
| D | 0 | 20 | 0 |
| Quadrant | Total seconds | Saturated seconds | Saturation percentage |
|---|---|---|---|
| A | 6782 | 89 | 1.312297% |
| B | 6782 | 148 | 2.182247% |
| C | 6782 | 104 | 1.533471% |
| D | 6783 | 412 | 6.074009% |
Noise dominated data is calculated using 1-second bins in cleaned event files. If a bin has >2000 counts, and if more than 50% of those come from <1% of pixels, then it is considered to be noise-dominated and hence unusable.
| Quadrant | # 1 sec bins | Bins with >0 counts | Bins with >2000 counts | High rate bins dominated by noise | Noise dominated (total time) | Noise dominated (detector-on time) | Marked lightcurve |
|---|---|---|---|---|---|---|---|
| A | 8837 | 6784 | 3 | 3 | 0.03% | 0.04% | 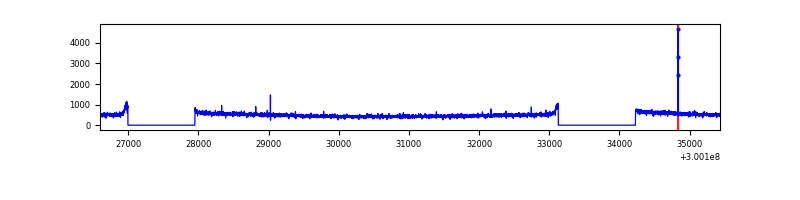 |
| B | 8837 | 6783 | 29 | 29 | 0.33% | 0.43% | 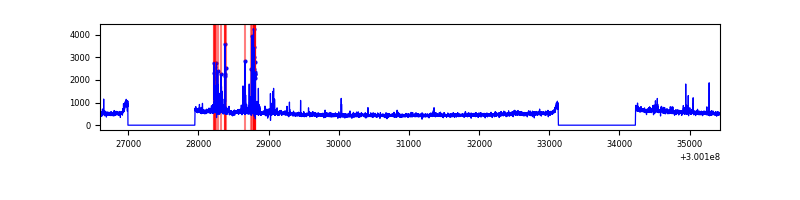 |
| C | 8837 | 6784 | 0 | 0 | 0.00% | 0.00% | 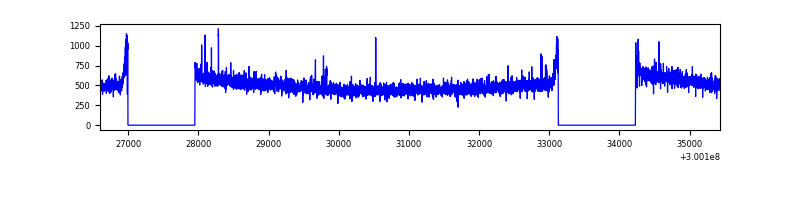 |
| D | 8838 | 6783 | 264 | 264 | 2.99% | 3.89% | 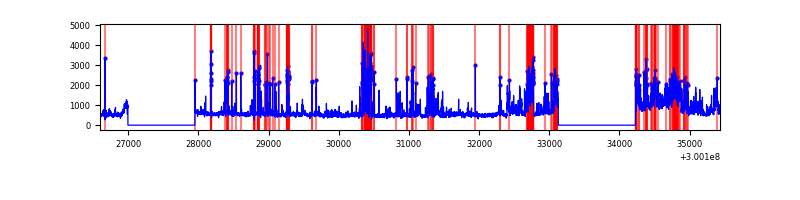 |
Top three noisy pixels from each quadrant. If the there are fewer than three noisy pixels in the level2.evt file, extra rows are filled as -1
| Pixel properties | Quadrant properties | ||||||
|---|---|---|---|---|---|---|---|
| Quadrant | DetID | PixID | Counts | Sigma | Mean | Median | Sigma |
| A | 12 | 96 | 13130 | 69.36 | 873 | 856 | 177.0 |
| A | 0 | 226 | 7505 | 37.57 | 873 | 856 | 177.0 |
| A | 3 | 137 | 7272 | 36.25 | 873 | 856 | 177.0 |
| B | 7 | 220 | 171425 | 1026.14 | 867 | 845 | 166.2 |
| B | 4 | 216 | 23757 | 137.83 | 867 | 845 | 166.2 |
| B | 12 | 111 | 19955 | 114.96 | 867 | 845 | 166.2 |
| C | 14 | 238 | 132020 | 665.16 | 841 | 845 | 197.2 |
| C | 9 | 221 | 29339 | 144.49 | 841 | 845 | 197.2 |
| C | 13 | 61 | 5880 | 25.53 | 841 | 845 | 197.2 |
| D | 1 | 52 | 1430135 | 7009.26 | 839 | 815 | 203.9 |
| D | 13 | 153 | 283327 | 1385.41 | 839 | 815 | 203.9 |
| D | 2 | 184 | 192791 | 941.43 | 839 | 815 | 203.9 |
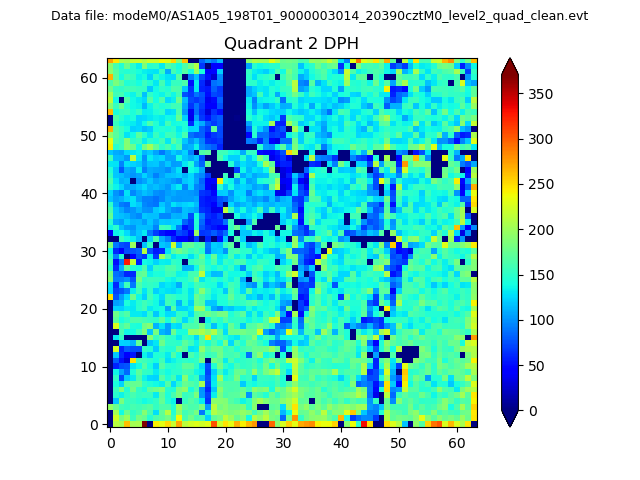
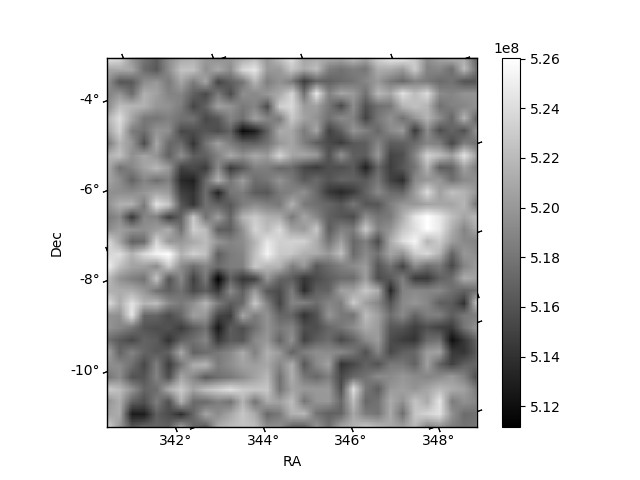
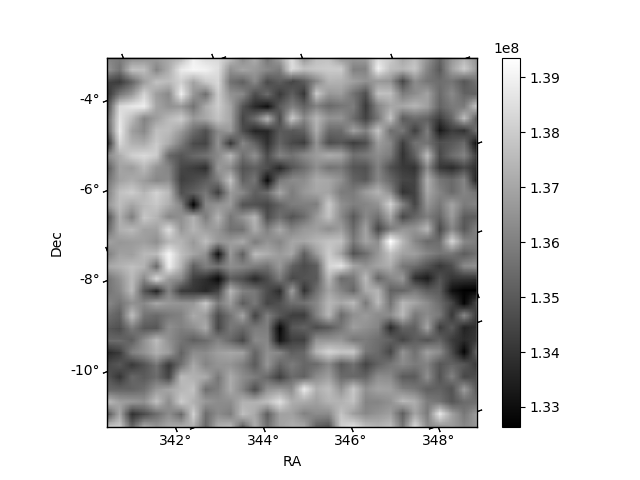
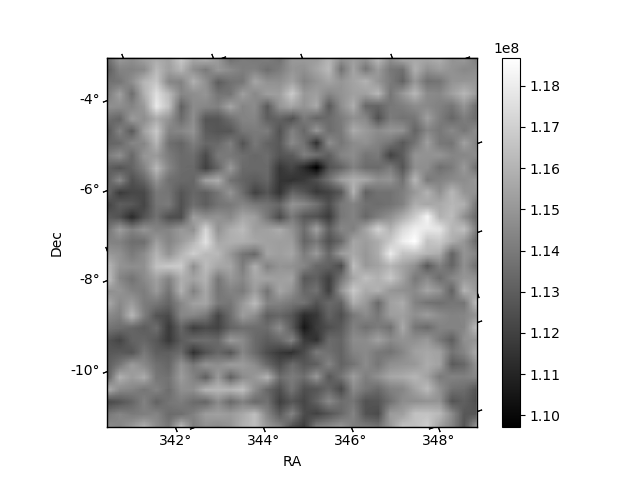
Histogram calculated using DETX and DETY for each event in the final _common_clean file
| Quadrant A | 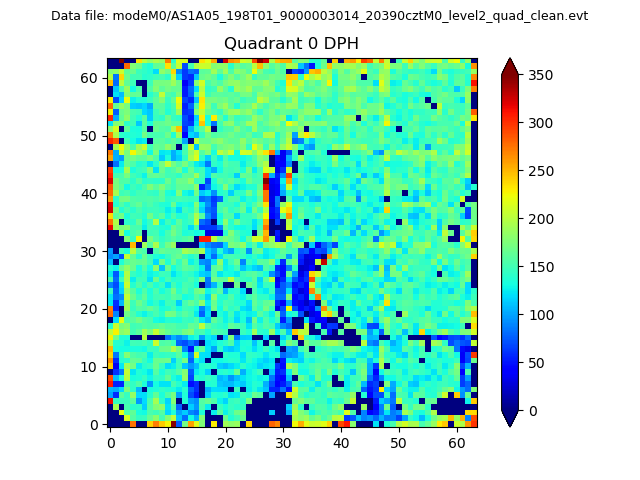 |
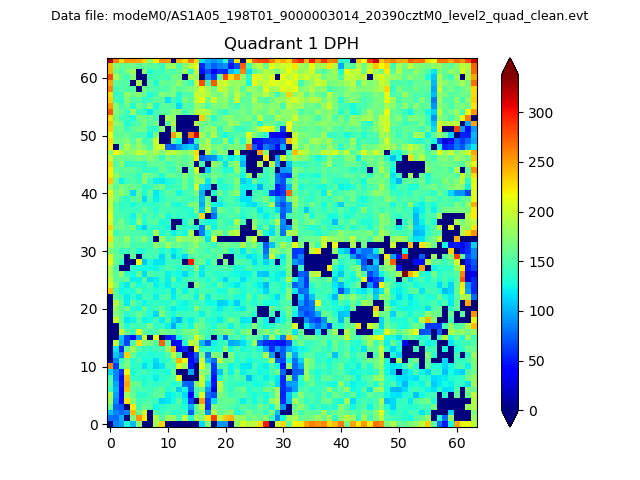 |
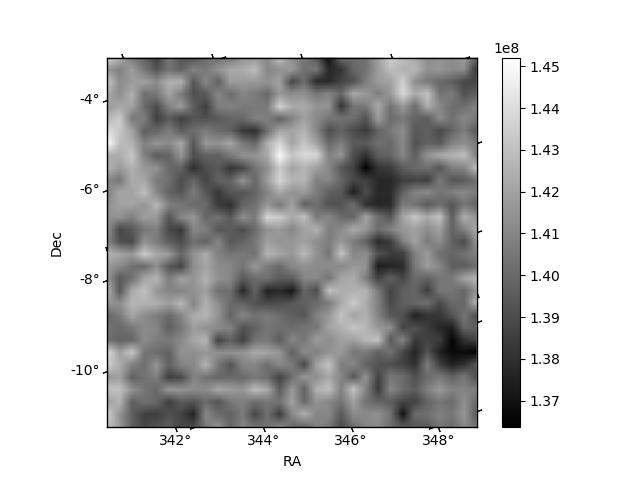
Quadrant B |
|---|---|---|---|
| Quadrant D | 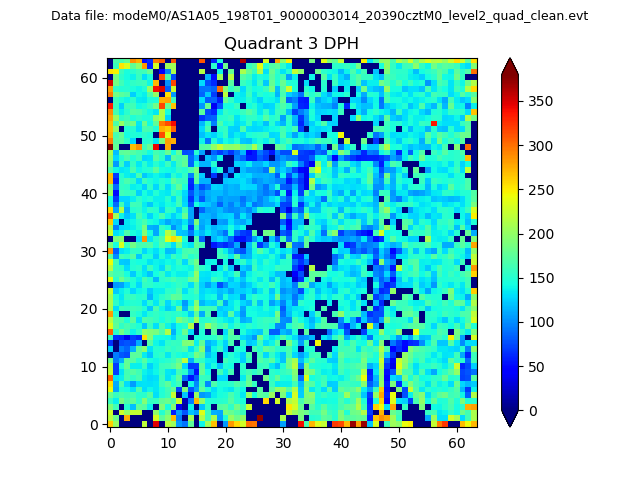 |
 |
Quadrant C |
| Plot type | Count rate plots | Images |
|---|---|---|
| Comparison with Poisson distribution Blue bars denote a histogram of data divided into 1 sec bins. Red curve is a Poisson curve with rate = median count rate of data. |
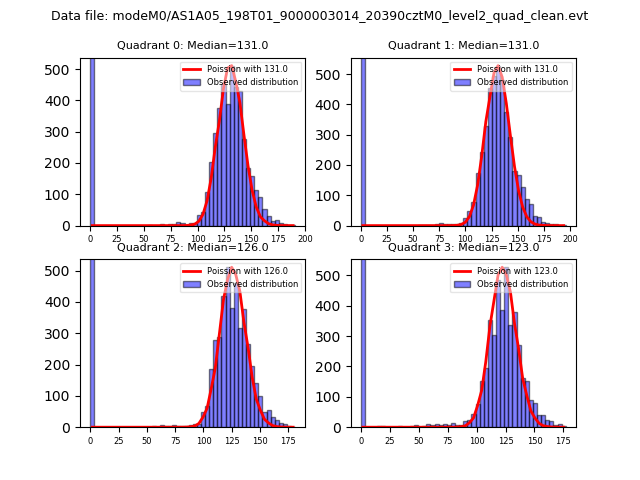 |
 |
| Quadrant-wise count rates Data is divided into 100 sec bins |
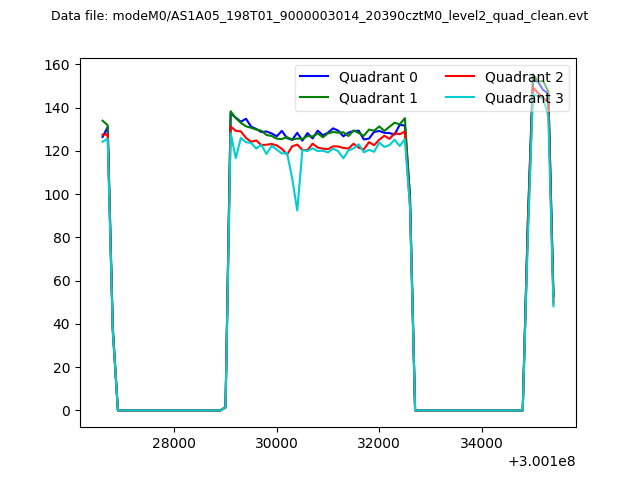 |
|
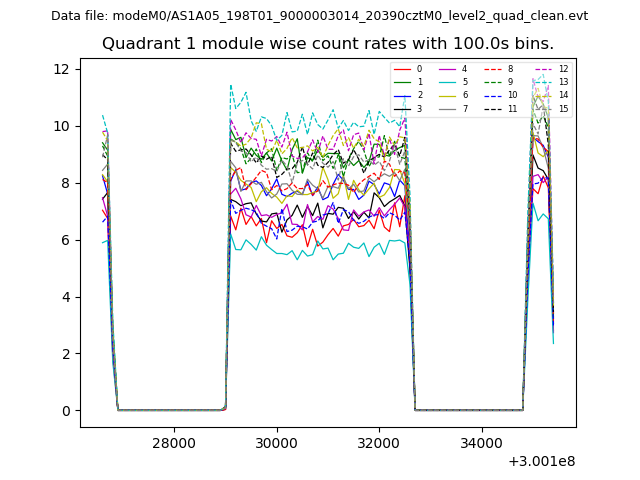
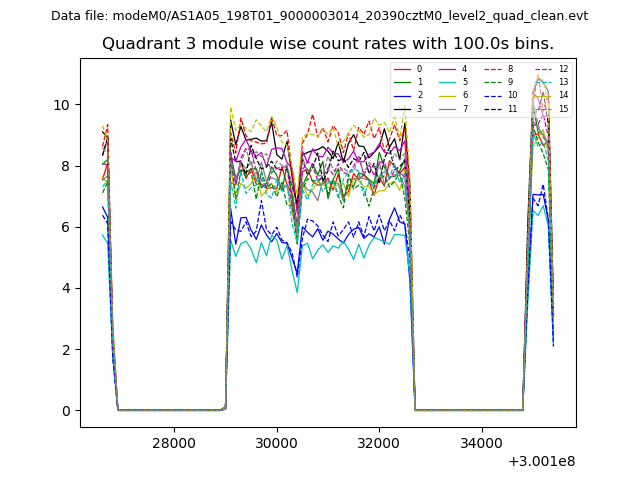
| Module-wise count rates for Quadrant A Data is divided into 100 sec bins |
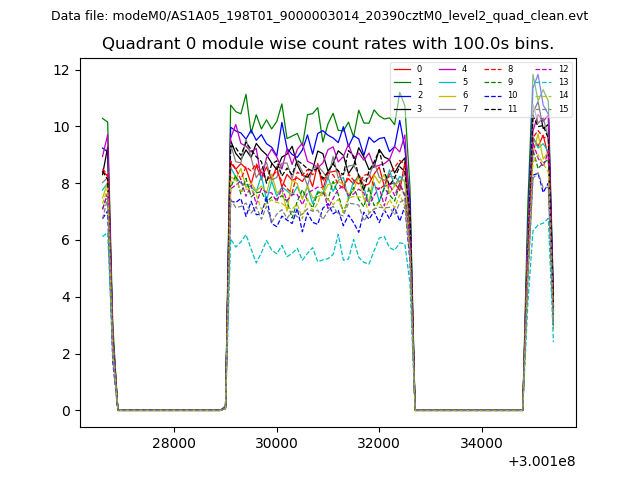 |
 |
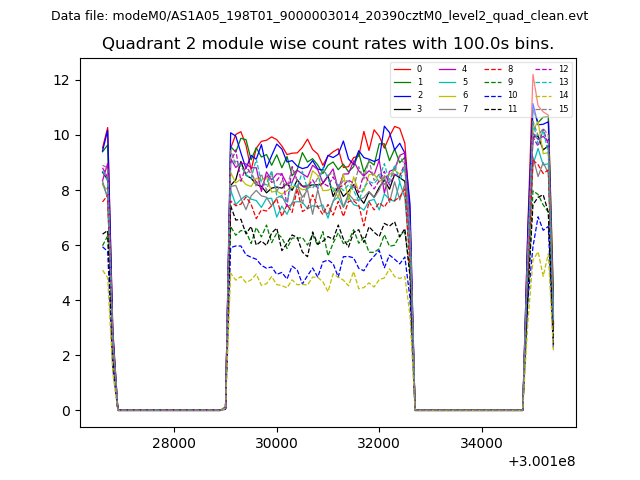
| Module-wise count rates for Quadrant B Data is divided into 100 sec bins |
 |
 |
| Module-wise count rates for Quadrant C Data is divided into 100 sec bins |
 |
 |
| Module-wise count rates for Quadrant D Data is divided into 100 sec bins |
 |
 |
| Parameter | Plot |
|---|---|
| CZT HV Monitor | 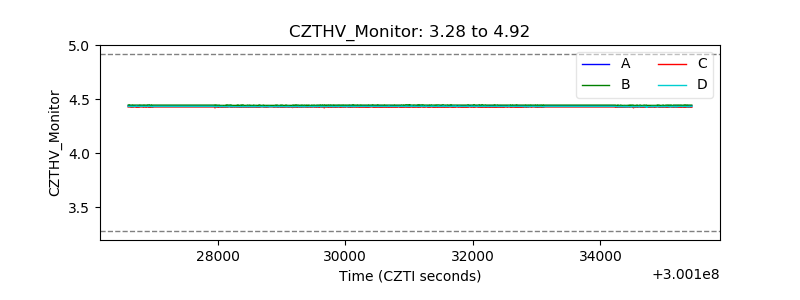 |
| D_VDD | 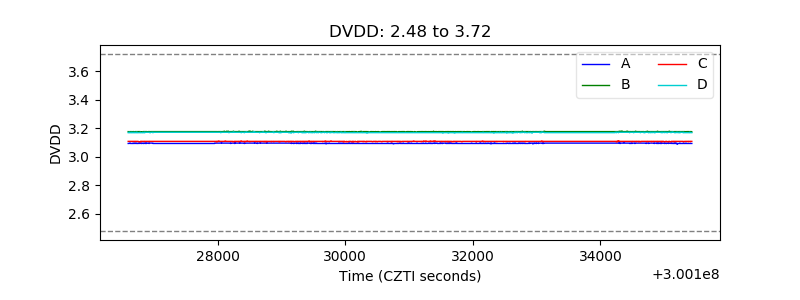 |
| Temperature 1 | 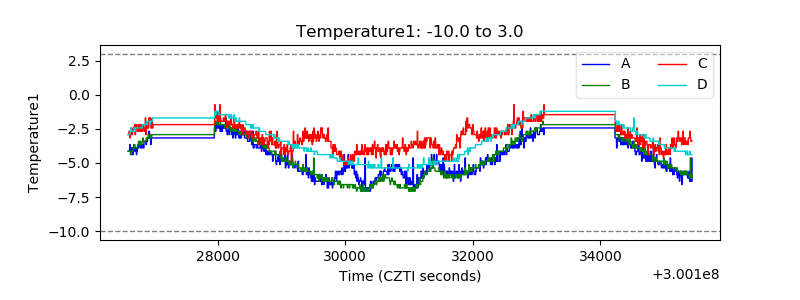 |
| Veto HV Monitor |  |
| Veto LLD | 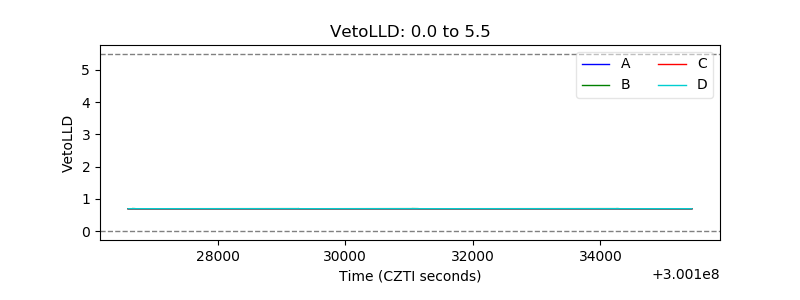 |
| Alpha Counter | 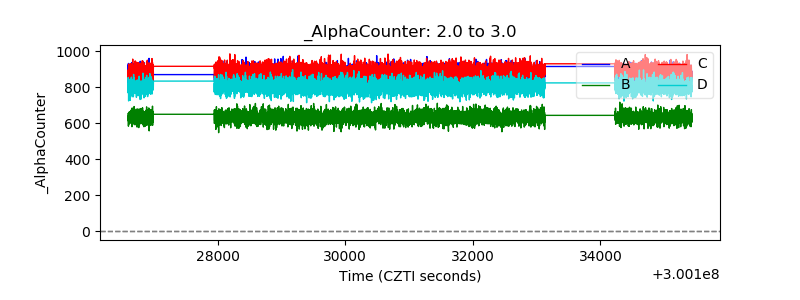 |
| _CPM_Rate | 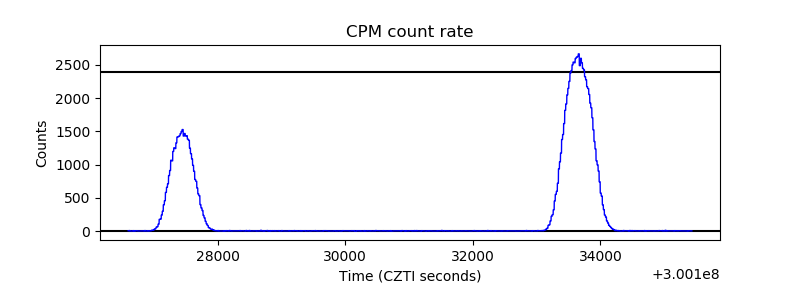 |
| CZT Counter | 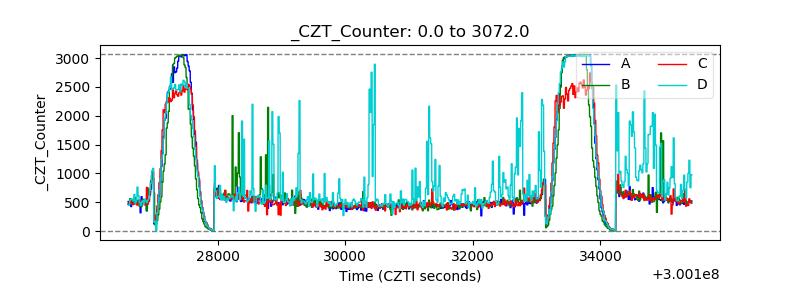 |
| +2.5 Volts monitor |  |
| +5 Volts monitor |  |
| _ROLL_ROT | 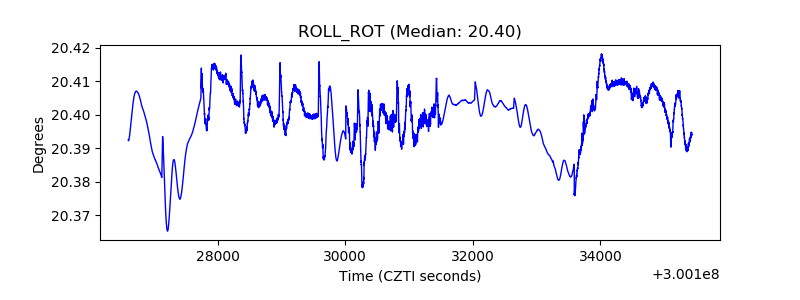 |
| _Roll_DEC | 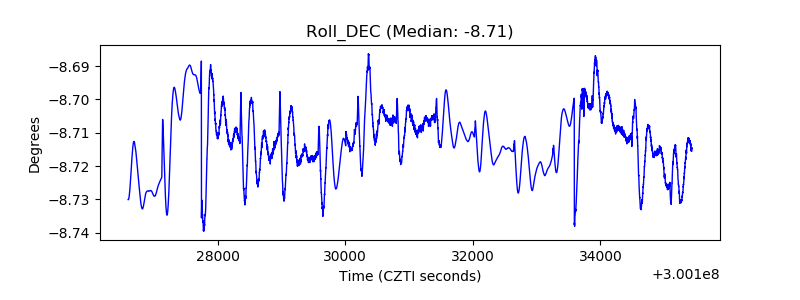 |
| _Roll_RA | 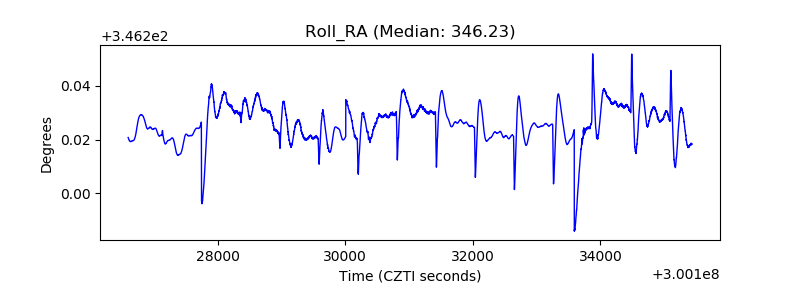 |
| Veto Counter | 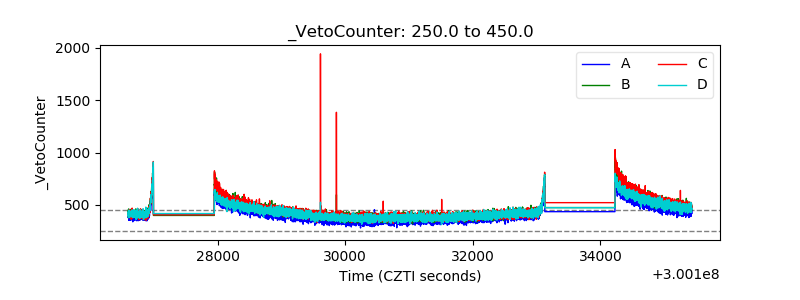 |