| Param | Original file | Final file |
|---|---|---|
| Filename | modeM0/AS1A05_198T01_9000003014_20393cztM0_level2.evt | modeM0/AS1A05_198T01_9000003014_20393cztM0_level2_quad_clean.evt |
| Size (bytes) | 577,589,760 | 108,492,480 |
| Size | 550.8 MB | 103.5 MB |
| Events in quadrant A | 3,320,042 | 735,450 |
| Events in quadrant B | 3,335,317 | 758,027 |
| Events in quadrant C | 3,332,028 | 728,545 |
| Events in quadrant D | 7,087,628 | 633,564 |
| Mode SS | |||
|---|---|---|---|
| Quadrant | BADHDUFLAG | Total packets | Discarded packets |
| A | 0 | 126 | 0 |
| B | 0 | 126 | 0 |
| C | 0 | 126 | 0 |
| D | 0 | 126 | 0 |
| Mode M0 | |||
|---|---|---|---|
| Quadrant | BADHDUFLAG | Total packets | Discarded packets |
| A | 0 | 13752 | 2 |
| B | 0 | 13851 | 2 |
| C | 0 | 13847 | 2 |
| D | 0 | 25211 | 2 |
| Mode M9 | |||
|---|---|---|---|
| Quadrant | BADHDUFLAG | Total packets | Discarded packets |
| A | 0 | 23 | 0 |
| B | 0 | 24 | 0 |
| C | 0 | 24 | 0 |
| D | 0 | 24 | 0 |
| Quadrant | Total seconds | Saturated seconds | Saturation percentage |
|---|---|---|---|
| A | 6156 | 46 | 0.747238% |
| B | 6156 | 61 | 0.990903% |
| C | 6156 | 80 | 1.299545% |
| D | 6156 | 1431 | 23.245614% |
Noise dominated data is calculated using 1-second bins in cleaned event files. If a bin has >2000 counts, and if more than 50% of those come from <1% of pixels, then it is considered to be noise-dominated and hence unusable.
| Quadrant | # 1 sec bins | Bins with >0 counts | Bins with >2000 counts | High rate bins dominated by noise | Noise dominated (total time) | Noise dominated (detector-on time) | Marked lightcurve |
|---|---|---|---|---|---|---|---|
| A | 7491 | 6157 | 22 | 22 | 0.29% | 0.36% | 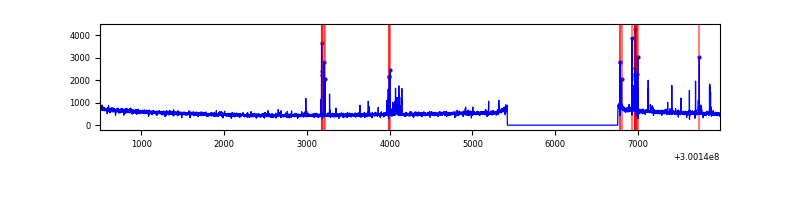 |
| B | 7491 | 6157 | 6 | 6 | 0.08% | 0.10% | 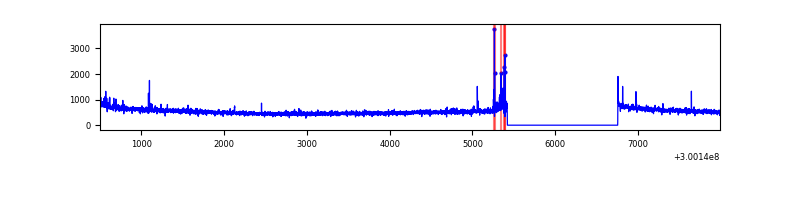 |
| C | 7491 | 6157 | 2 | 2 | 0.03% | 0.03% | 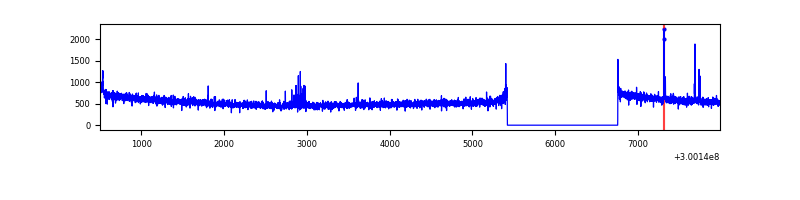 |
| D | 7491 | 6156 | 1228 | 1228 | 16.39% | 19.95% | 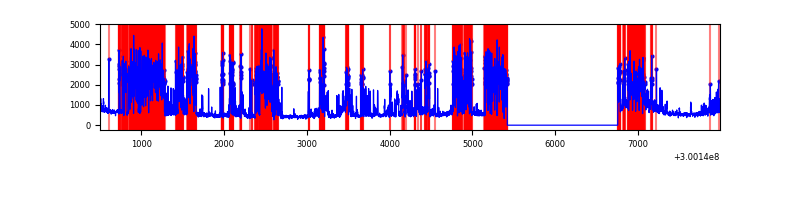 |
Top three noisy pixels from each quadrant. If the there are fewer than three noisy pixels in the level2.evt file, extra rows are filled as -1
| Pixel properties | Quadrant properties | ||||||
|---|---|---|---|---|---|---|---|
| Quadrant | DetID | PixID | Counts | Sigma | Mean | Median | Sigma |
| A | 12 | 96 | 149870 | 911.82 | 822 | 807 | 163.5 |
| A | 0 | 226 | 7149 | 38.79 | 822 | 807 | 163.5 |
| A | 11 | 29 | 6655 | 35.77 | 822 | 807 | 163.5 |
| B | 7 | 220 | 45284 | 290.17 | 829 | 811 | 153.3 |
| B | 12 | 111 | 18057 | 112.53 | 829 | 811 | 153.3 |
| B | 11 | 111 | 15955 | 98.81 | 829 | 811 | 153.3 |
| C | 14 | 238 | 126768 | 670.28 | 810 | 820 | 187.9 |
| C | 9 | 221 | 39169 | 204.09 | 810 | 820 | 187.9 |
| C | 13 | 61 | 5570 | 25.28 | 810 | 820 | 187.9 |
| D | 1 | 52 | 4198719 | 23697.45 | 734 | 716 | 177.1 |
| D | 13 | 153 | 70657 | 394.81 | 734 | 716 | 177.1 |
| D | 2 | 234 | 23423 | 128.18 | 734 | 716 | 177.1 |
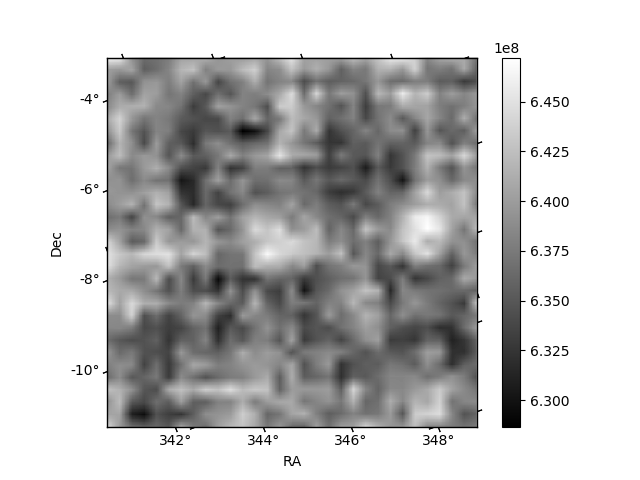
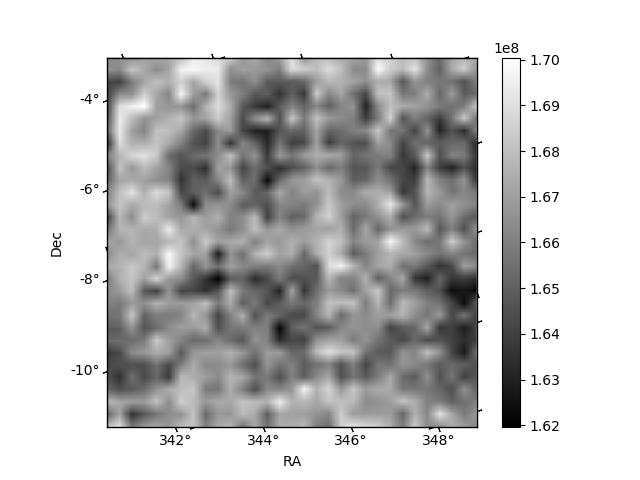
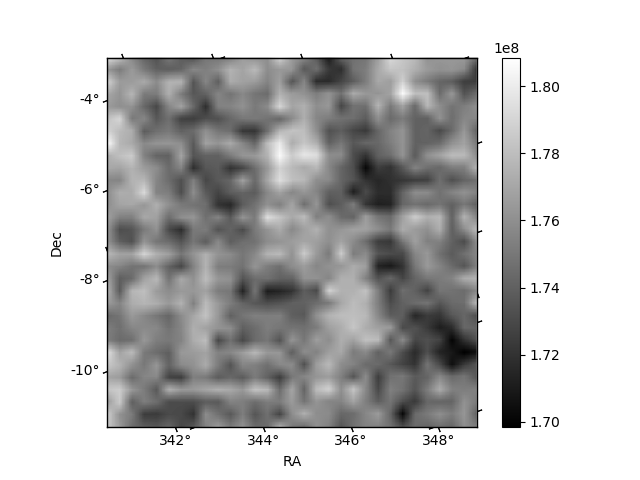
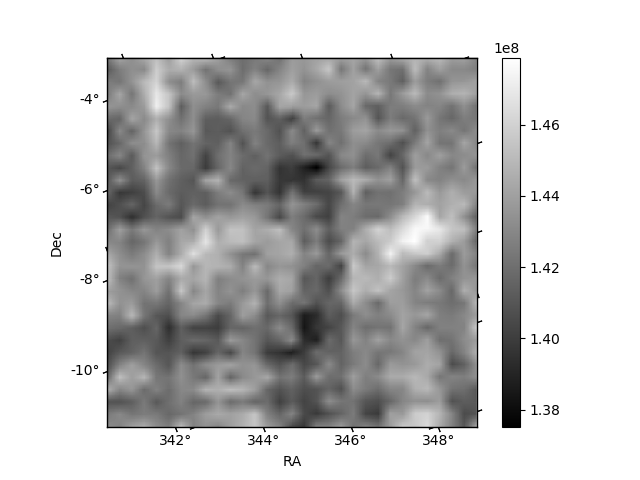
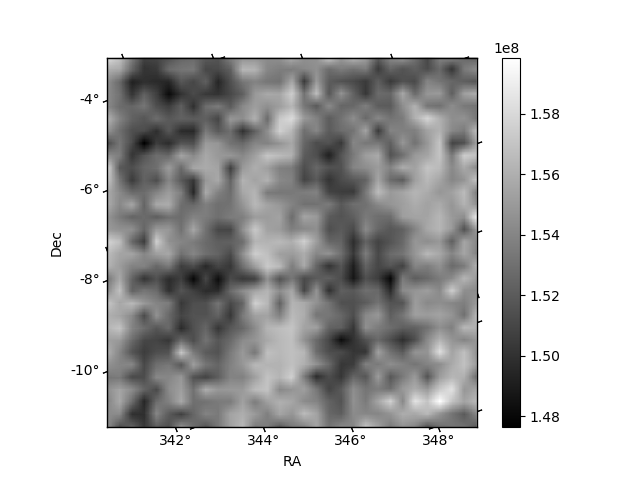
Histogram calculated using DETX and DETY for each event in the final _common_clean file
| Quadrant A |  |
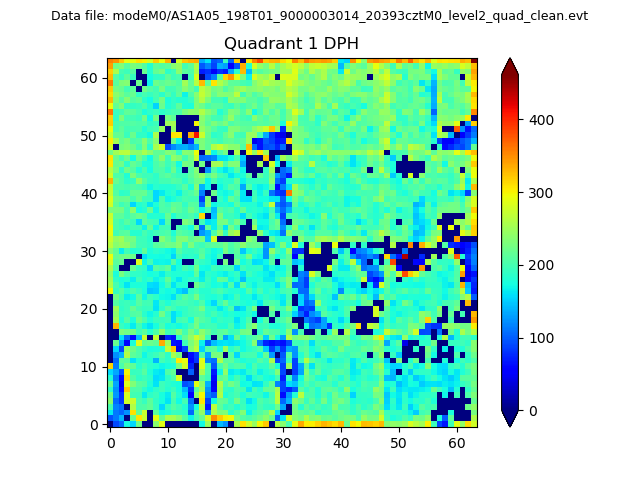 |
Quadrant B |
|---|---|---|---|
| Quadrant D | 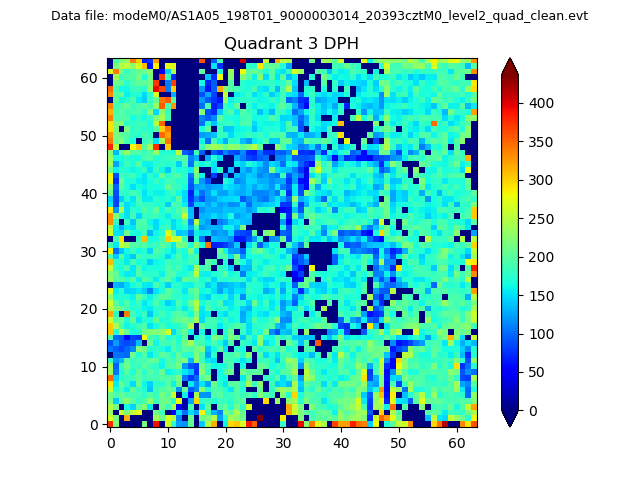 |
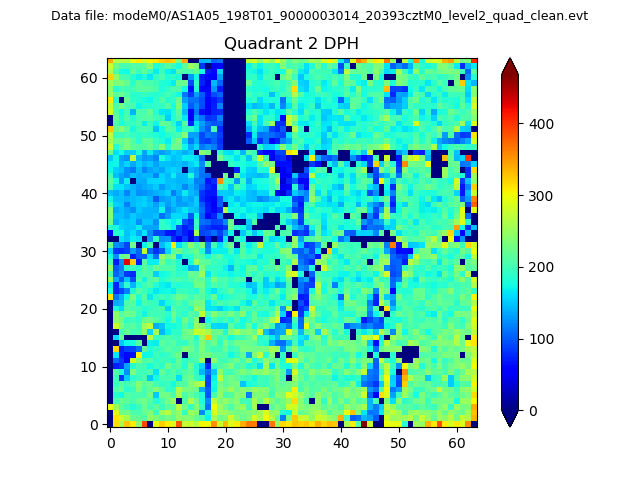 |
Quadrant C |
| Plot type | Count rate plots | Images |
|---|---|---|
| Comparison with Poisson distribution Blue bars denote a histogram of data divided into 1 sec bins. Red curve is a Poisson curve with rate = median count rate of data. |
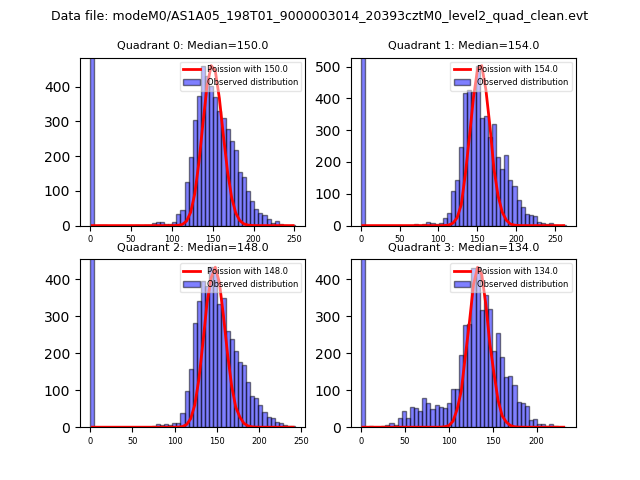 |
 |
| Quadrant-wise count rates Data is divided into 100 sec bins |
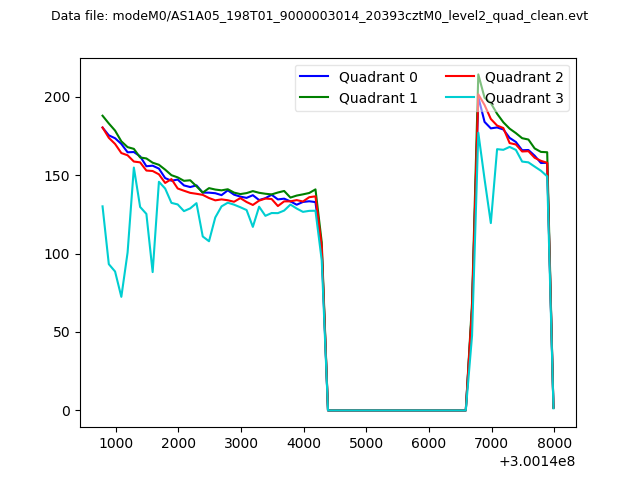 |
|
| Module-wise count rates for Quadrant A Data is divided into 100 sec bins |
 |
 |
| Module-wise count rates for Quadrant B Data is divided into 100 sec bins |
 |
 |
| Module-wise count rates for Quadrant C Data is divided into 100 sec bins |
 |
 |
| Module-wise count rates for Quadrant D Data is divided into 100 sec bins |
 |
 |
| Parameter | Plot |
|---|---|
| CZT HV Monitor |  |
| D_VDD | 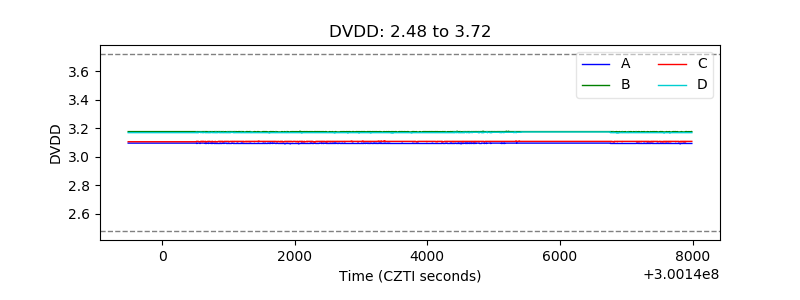 |
| Temperature 1 | 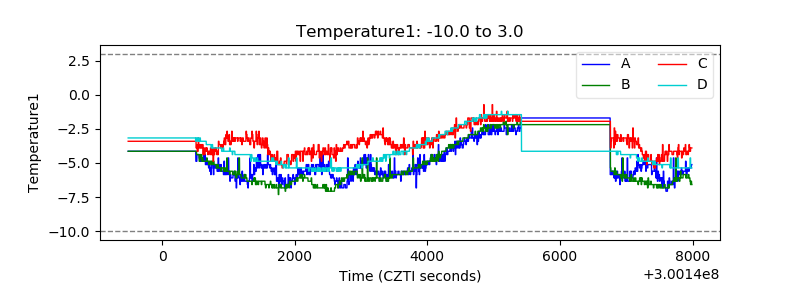 |
| Veto HV Monitor | 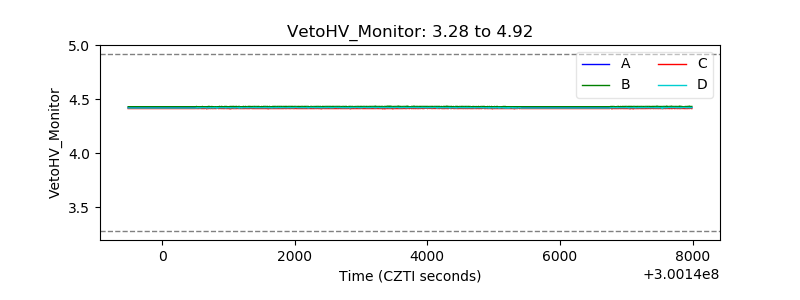 |
| Veto LLD | 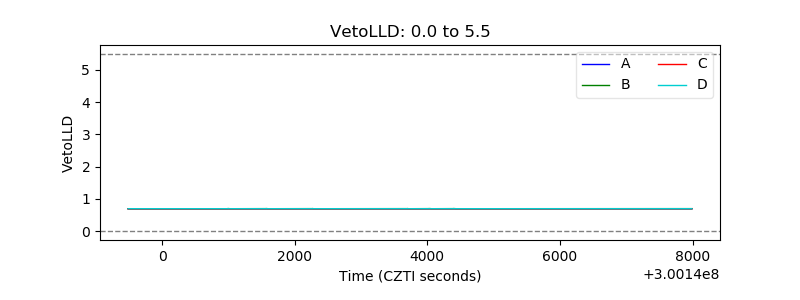 |
| Alpha Counter | 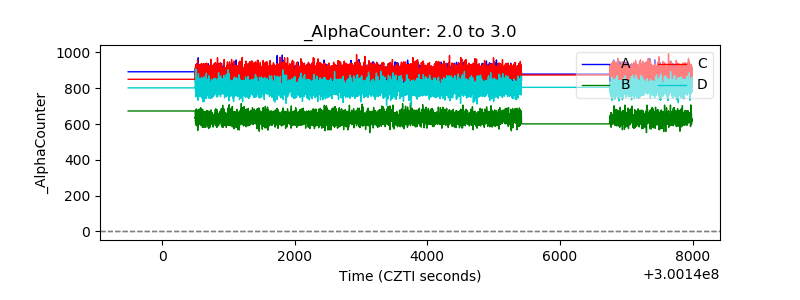 |
| _CPM_Rate | 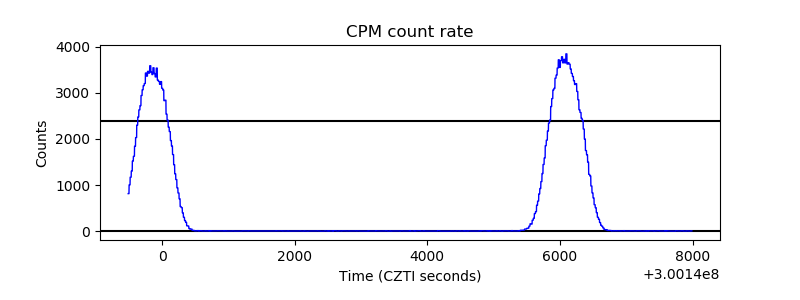 |
| CZT Counter | 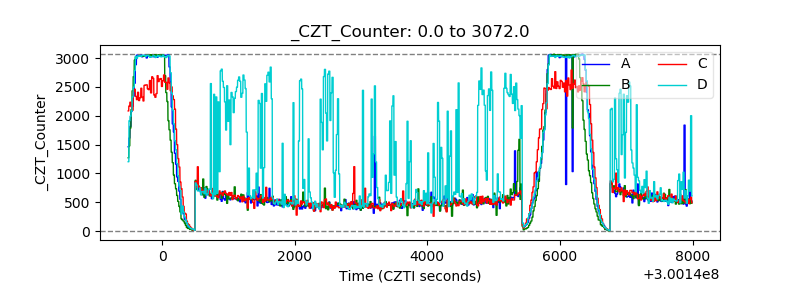 |
| +2.5 Volts monitor |  |
| +5 Volts monitor | 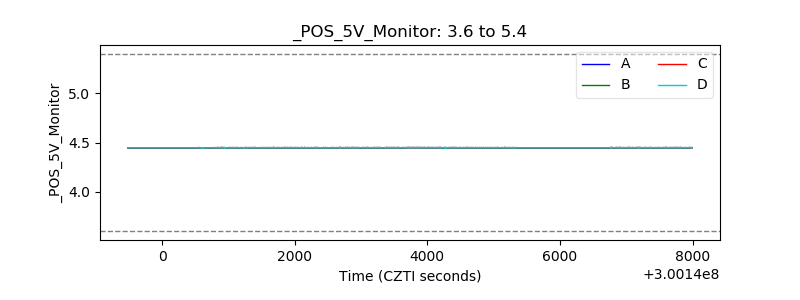 |
| _ROLL_ROT |  |
| _Roll_DEC | 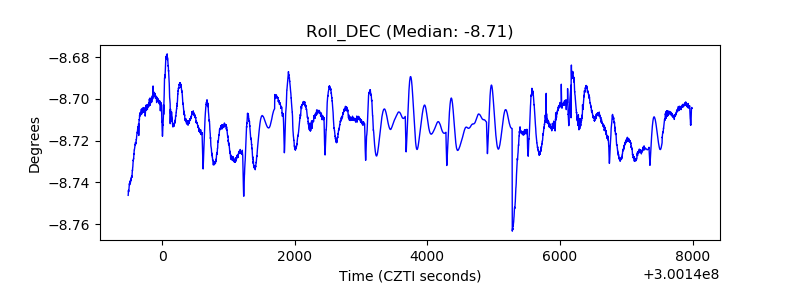 |
| _Roll_RA | 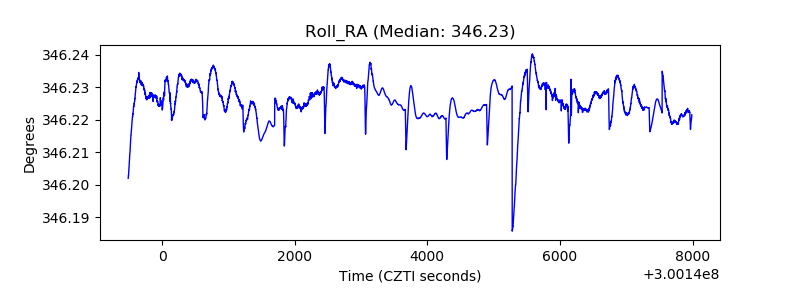 |
| Veto Counter | 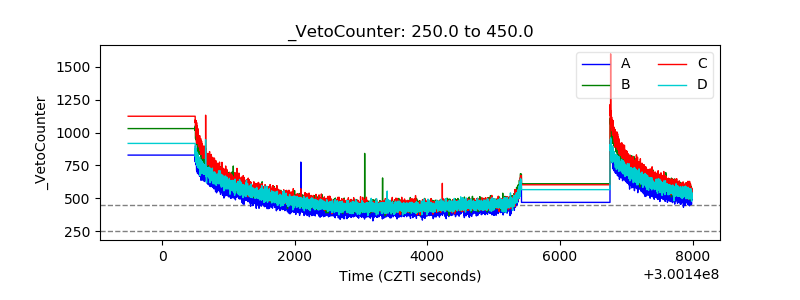 |