| Param | Original file | Final file |
|---|---|---|
| Filename | modeM0/AS1A05_198T01_9000003014_20398cztM0_level2.evt | modeM0/AS1A05_198T01_9000003014_20398cztM0_level2_quad_clean.evt |
| Size (bytes) | 868,728,960 | 153,141,120 |
| Size | 828.5 MB | 146.0 MB |
| Events in quadrant A | 5,808,764 | 970,178 |
| Events in quadrant B | 6,413,848 | 979,664 |
| Events in quadrant C | 5,809,854 | 942,062 |
| Events in quadrant D | 7,462,057 | 913,331 |
| Mode SS | |||
|---|---|---|---|
| Quadrant | BADHDUFLAG | Total packets | Discarded packets |
| A | 0 | 244 | 0 |
| B | 0 | 244 | 0 |
| C | 0 | 244 | 0 |
| D | 0 | 244 | 0 |
| Mode M0 | |||
|---|---|---|---|
| Quadrant | BADHDUFLAG | Total packets | Discarded packets |
| A | 0 | 24880 | 2 |
| B | 0 | 26770 | 2 |
| C | 0 | 24780 | 2 |
| D | 0 | 30202 | 2 |
| Mode M9 | |||
|---|---|---|---|
| Quadrant | BADHDUFLAG | Total packets | Discarded packets |
| A | 0 | 13 | 0 |
| B | 0 | 13 | 0 |
| C | 0 | 13 | 0 |
| D | 0 | 13 | 0 |
| Quadrant | Total seconds | Saturated seconds | Saturation percentage |
|---|---|---|---|
| A | 12041 | 153 | 1.270659% |
| B | 12041 | 257 | 2.134374% |
| C | 12041 | 166 | 1.378623% |
| D | 12041 | 598 | 4.966365% |
Noise dominated data is calculated using 1-second bins in cleaned event files. If a bin has >2000 counts, and if more than 50% of those come from <1% of pixels, then it is considered to be noise-dominated and hence unusable.
| Quadrant | # 1 sec bins | Bins with >0 counts | Bins with >2000 counts | High rate bins dominated by noise | Noise dominated (total time) | Noise dominated (detector-on time) | Marked lightcurve |
|---|---|---|---|---|---|---|---|
| A | 13346 | 12043 | 12 | 12 | 0.09% | 0.10% | 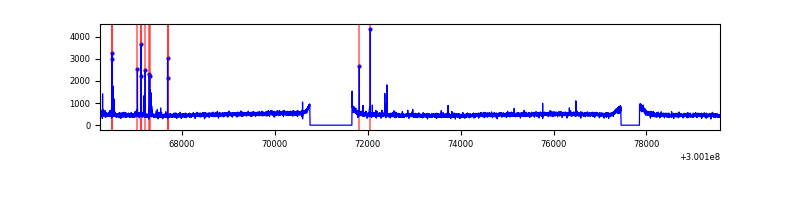 |
| B | 13346 | 12043 | 54 | 54 | 0.40% | 0.45% | 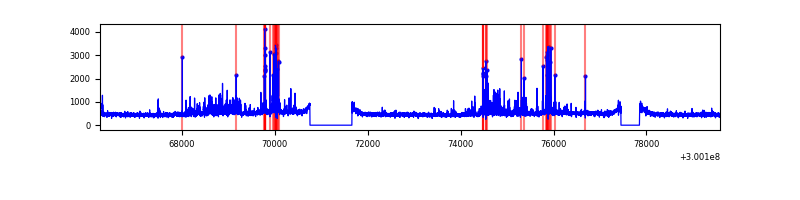 |
| C | 13346 | 12043 | 0 | 0 | 0.00% | 0.00% | 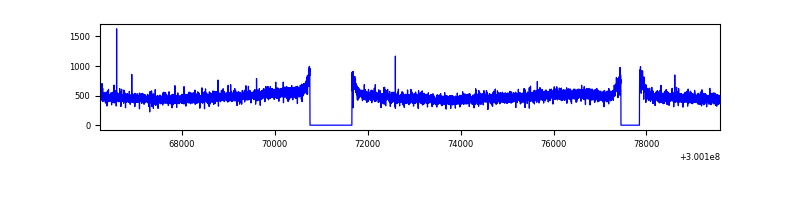 |
| D | 13346 | 12043 | 389 | 389 | 2.91% | 3.23% | 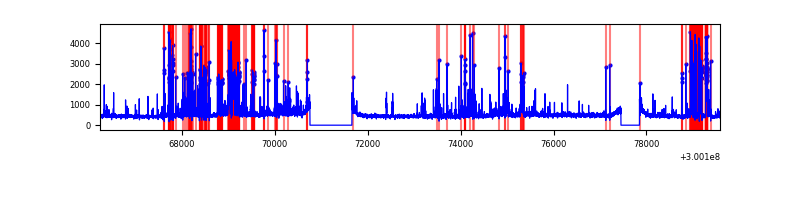 |
Top three noisy pixels from each quadrant. If the there are fewer than three noisy pixels in the level2.evt file, extra rows are filled as -1
| Pixel properties | Quadrant properties | ||||||
|---|---|---|---|---|---|---|---|
| Quadrant | DetID | PixID | Counts | Sigma | Mean | Median | Sigma |
| A | 12 | 96 | 91388 | 302.33 | 1482 | 1448 | 297.5 |
| A | 0 | 226 | 12626 | 37.57 | 1482 | 1448 | 297.5 |
| A | 3 | 137 | 12136 | 35.93 | 1482 | 1448 | 297.5 |
| B | 7 | 220 | 304757 | 1088.86 | 1465 | 1428 | 278.6 |
| B | 0 | 189 | 250297 | 893.37 | 1465 | 1428 | 278.6 |
| B | 12 | 111 | 34301 | 118.0 | 1465 | 1428 | 278.6 |
| C | 14 | 238 | 221055 | 658.3 | 1422 | 1430 | 333.6 |
| C | 9 | 221 | 25112 | 70.98 | 1422 | 1430 | 333.6 |
| C | 13 | 61 | 9895 | 25.37 | 1422 | 1430 | 333.6 |
| D | 1 | 52 | 1907311 | 5474.86 | 1429 | 1389 | 348.1 |
| D | 13 | 153 | 61407 | 172.4 | 1429 | 1389 | 348.1 |
| D | 2 | 234 | 47975 | 133.82 | 1429 | 1389 | 348.1 |
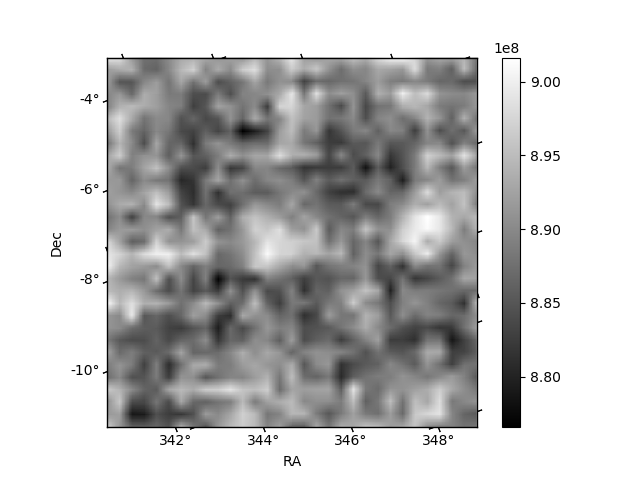
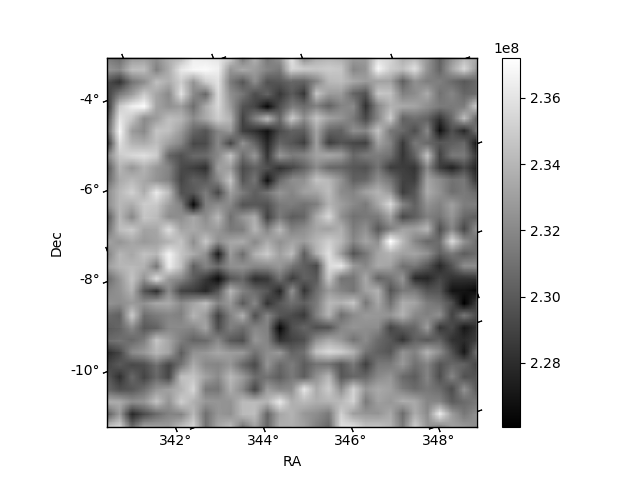
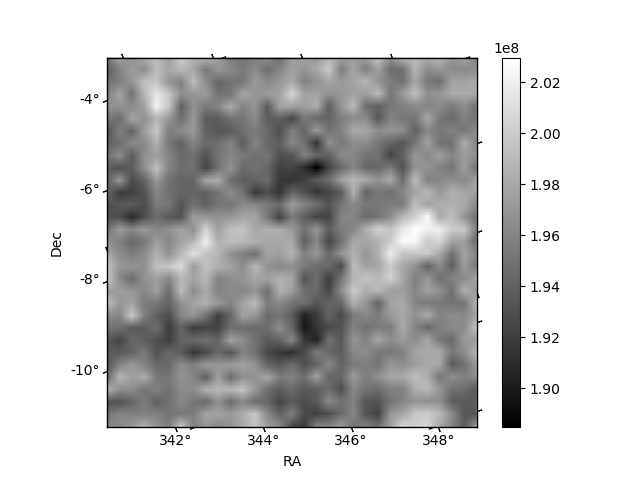
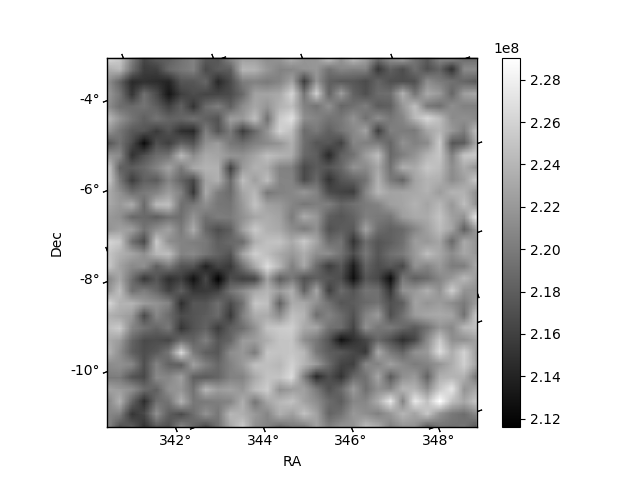
Histogram calculated using DETX and DETY for each event in the final _common_clean file
| Quadrant A | 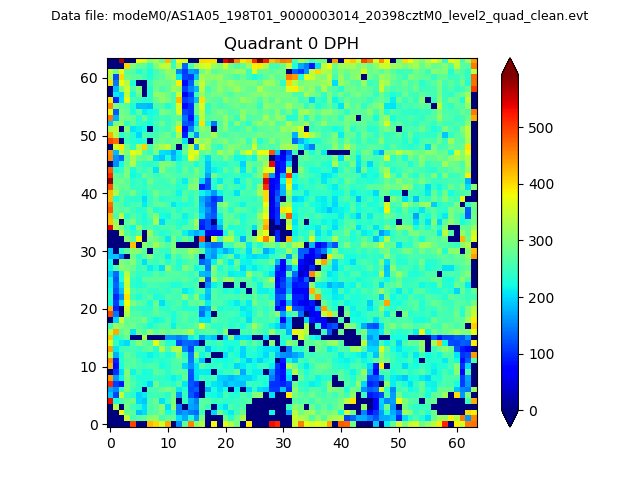 |
 |
Quadrant B |
|---|---|---|---|
| Quadrant D | 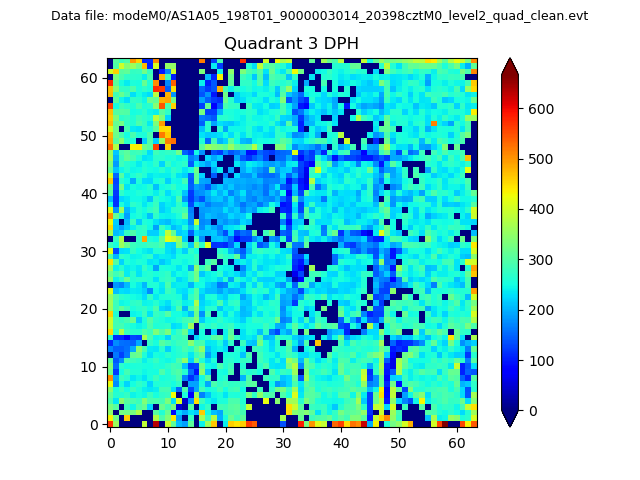 |
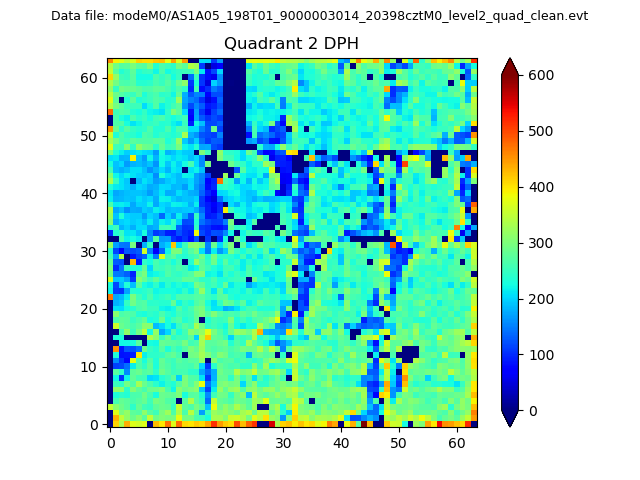 |
Quadrant C |
| Plot type | Count rate plots | Images |
|---|---|---|
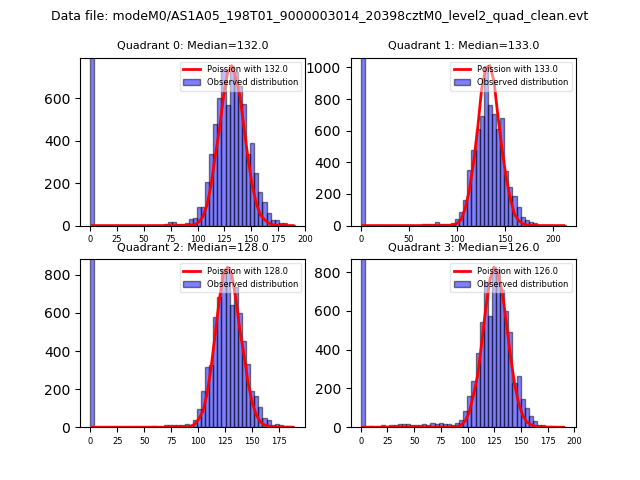
| Comparison with Poisson distribution Blue bars denote a histogram of data divided into 1 sec bins. Red curve is a Poisson curve with rate = median count rate of data. |
 |
 |
| Quadrant-wise count rates Data is divided into 100 sec bins |
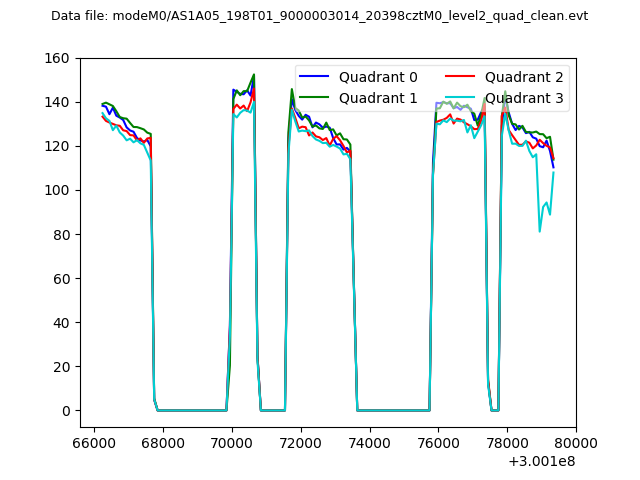 |
|
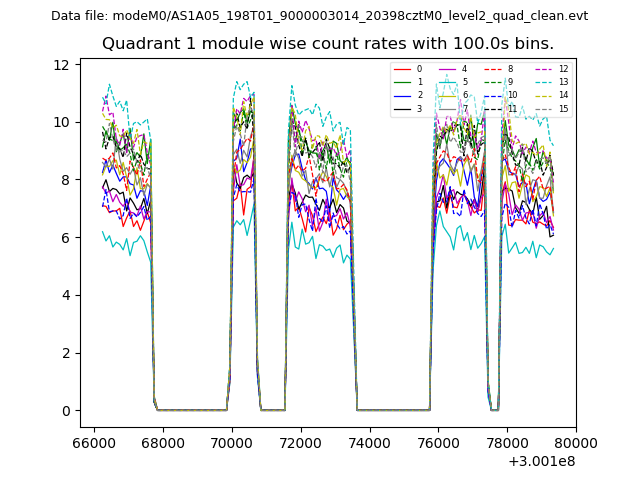
| Module-wise count rates for Quadrant A Data is divided into 100 sec bins |
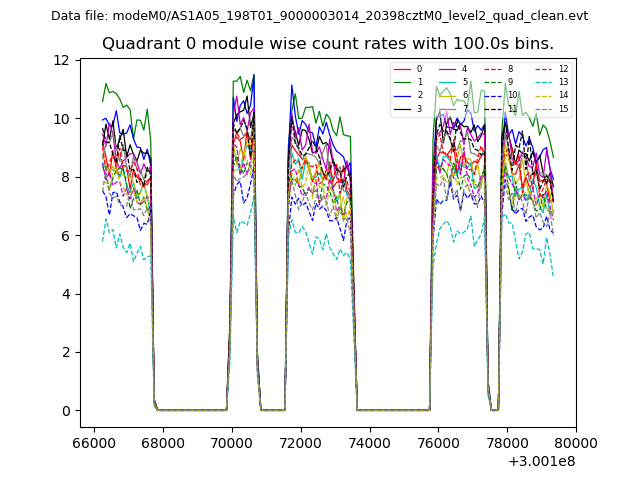 |
 |
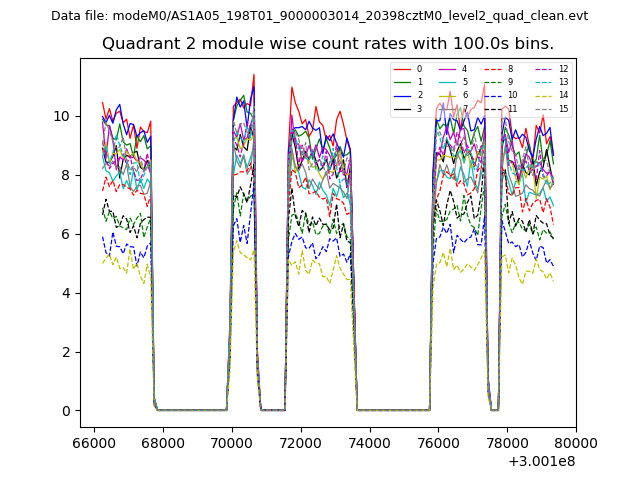
| Module-wise count rates for Quadrant B Data is divided into 100 sec bins |
 |
 |
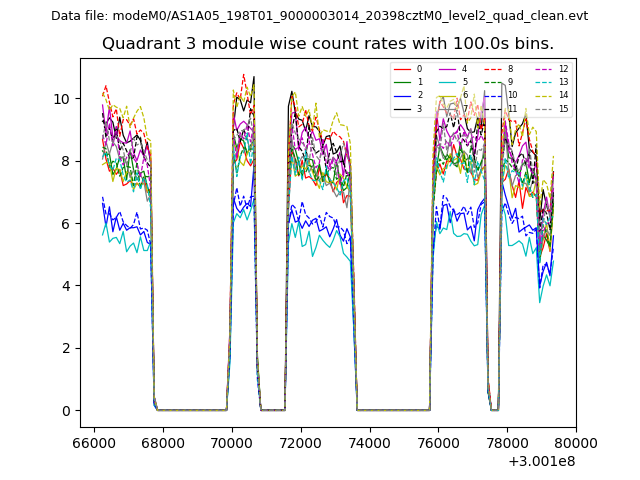
| Module-wise count rates for Quadrant C Data is divided into 100 sec bins |
 |
 |
| Module-wise count rates for Quadrant D Data is divided into 100 sec bins |
 |
 |
| Parameter | Plot |
|---|---|
| CZT HV Monitor | 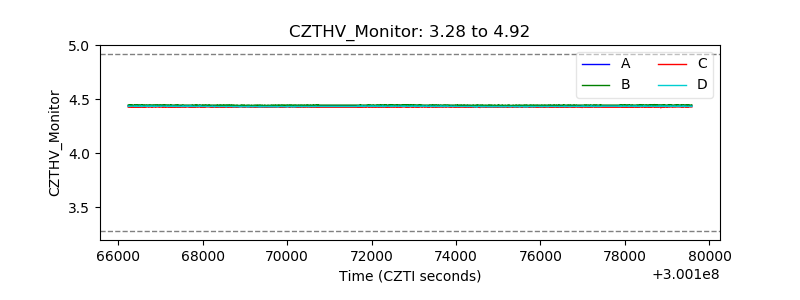 |
| D_VDD | 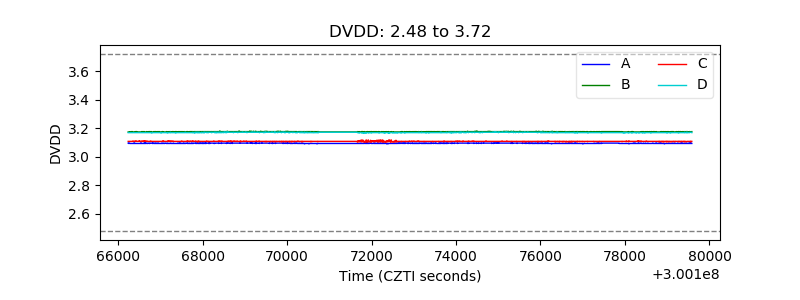 |
| Temperature 1 | 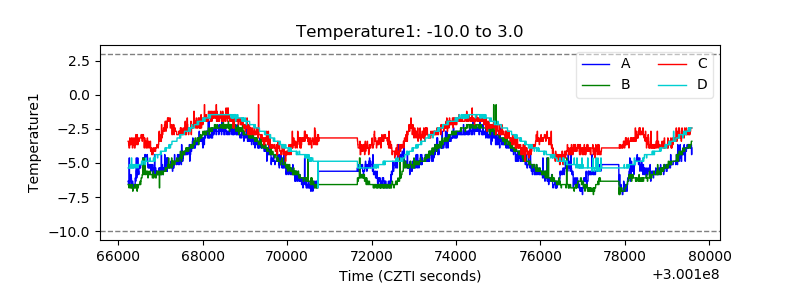 |
| Veto HV Monitor | 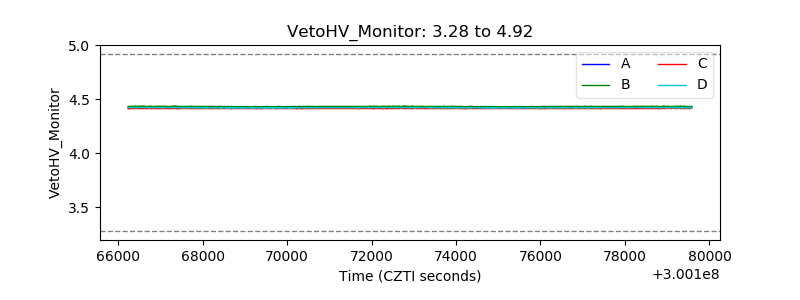 |
| Veto LLD | 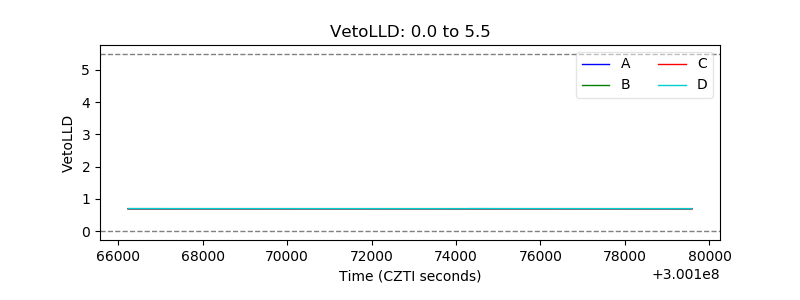 |
| Alpha Counter |  |
| _CPM_Rate | 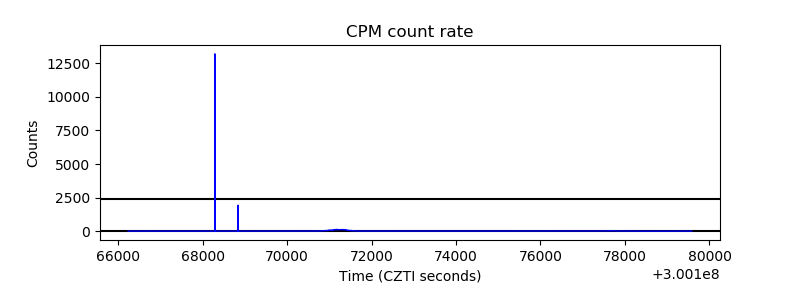 |
| CZT Counter | 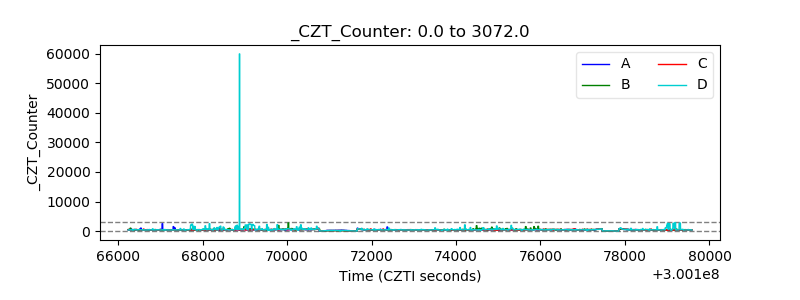 |
| +2.5 Volts monitor |  |
| +5 Volts monitor |  |
| _ROLL_ROT | 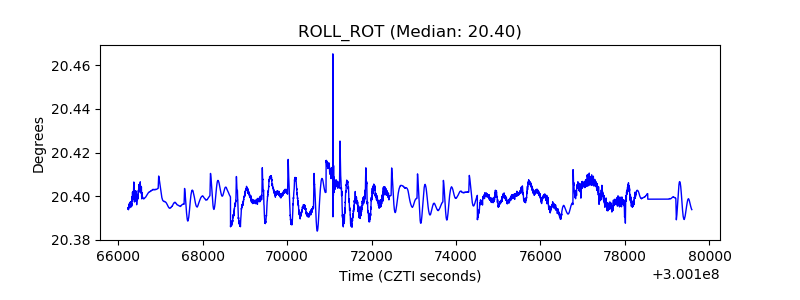 |
| _Roll_DEC | 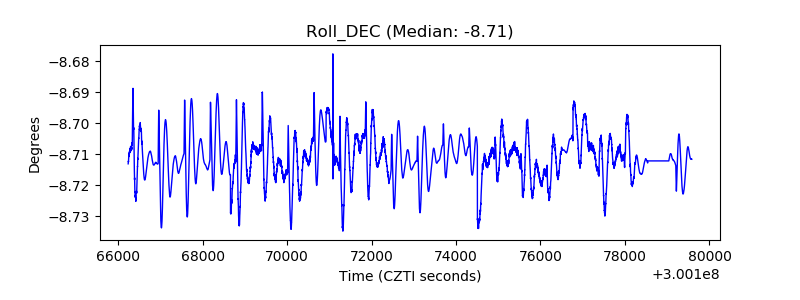 |
| _Roll_RA | 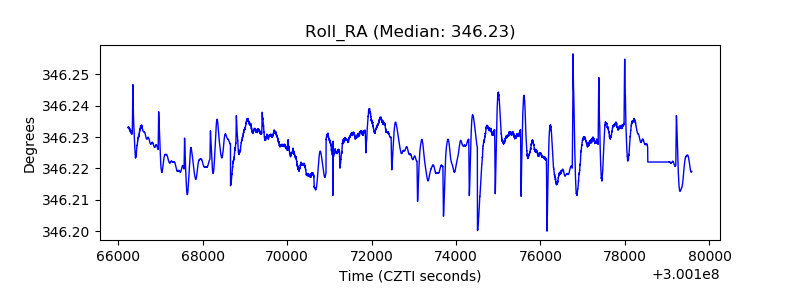 |
| Veto Counter | 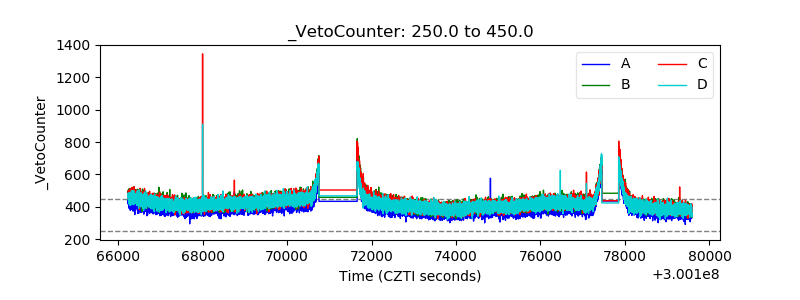 |