| Param | Original file | Final file |
|---|---|---|
| Filename | modeM0/AS1A05_198T01_9000003014_20402cztM0_level2.evt | modeM0/AS1A05_198T01_9000003014_20402cztM0_level2_quad_clean.evt |
| Size (bytes) | 373,893,120 | 69,053,760 |
| Size | 356.6 MB | 65.9 MB |
| Events in quadrant A | 2,611,205 | 435,393 |
| Events in quadrant B | 2,924,560 | 434,741 |
| Events in quadrant C | 2,659,028 | 414,913 |
| Events in quadrant D | 2,744,541 | 411,436 |
| Mode SS | |||
|---|---|---|---|
| Quadrant | BADHDUFLAG | Total packets | Discarded packets |
| A | 0 | 114 | 0 |
| B | 0 | 114 | 0 |
| C | 0 | 114 | 0 |
| D | 0 | 114 | 0 |
| Mode M0 | |||
|---|---|---|---|
| Quadrant | BADHDUFLAG | Total packets | Discarded packets |
| A | 0 | 11435 | 2 |
| B | 0 | 12223 | 1 |
| C | 0 | 11439 | 1 |
| D | 0 | 12051 | 1 |
| Quadrant | Total seconds | Saturated seconds | Saturation percentage |
|---|---|---|---|
| A | 5633 | 30 | 0.532576% |
| B | 5634 | 69 | 1.224707% |
| C | 5634 | 40 | 0.709975% |
| D | 5634 | 76 | 1.348953% |
Noise dominated data is calculated using 1-second bins in cleaned event files. If a bin has >2000 counts, and if more than 50% of those come from <1% of pixels, then it is considered to be noise-dominated and hence unusable.
| Quadrant | # 1 sec bins | Bins with >0 counts | Bins with >2000 counts | High rate bins dominated by noise | Noise dominated (total time) | Noise dominated (detector-on time) | Marked lightcurve |
|---|---|---|---|---|---|---|---|
| A | 5633 | 5633 | 0 | 0 | 0.00% | 0.00% | 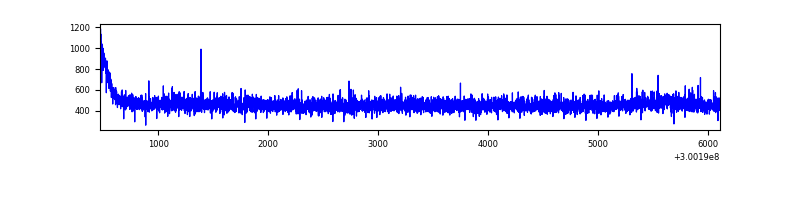 |
| B | 5634 | 5634 | 21 | 21 | 0.37% | 0.37% | 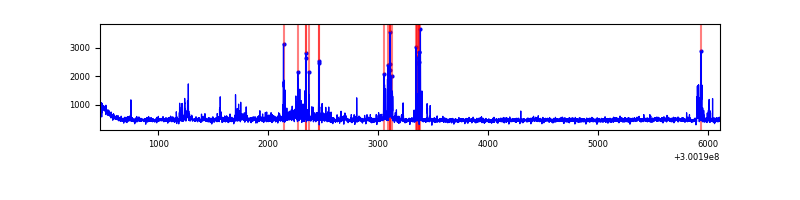 |
| C | 5634 | 5634 | 0 | 0 | 0.00% | 0.00% | 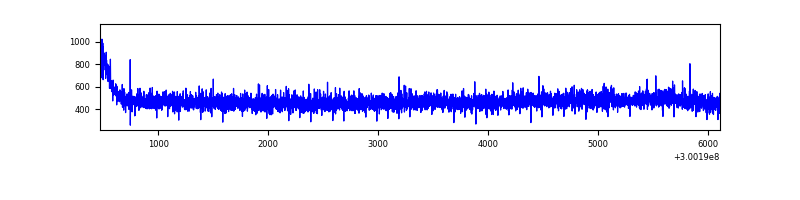 |
| D | 5634 | 5634 | 54 | 54 | 0.96% | 0.96% | 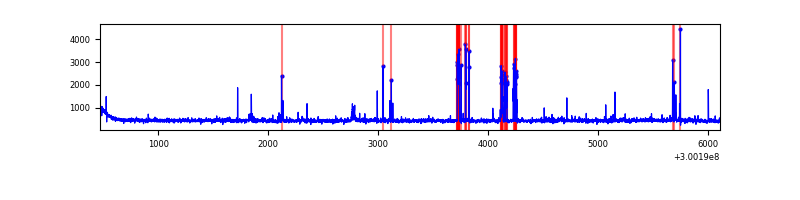 |
Top three noisy pixels from each quadrant. If the there are fewer than three noisy pixels in the level2.evt file, extra rows are filled as -1
| Pixel properties | Quadrant properties | ||||||
|---|---|---|---|---|---|---|---|
| Quadrant | DetID | PixID | Counts | Sigma | Mean | Median | Sigma |
| A | 0 | 226 | 5777 | 37.36 | 676 | 660 | 137.0 |
| A | 3 | 137 | 5754 | 37.19 | 676 | 660 | 137.0 |
| A | 13 | 254 | 5402 | 34.62 | 676 | 660 | 137.0 |
| B | 7 | 220 | 153521 | 1181.09 | 668 | 648 | 129.4 |
| B | 0 | 189 | 88417 | 678.1 | 668 | 648 | 129.4 |
| B | 10 | 245 | 29456 | 222.57 | 668 | 648 | 129.4 |
| C | 14 | 238 | 100958 | 651.69 | 648 | 651 | 153.9 |
| C | 8 | 128 | 14561 | 90.37 | 648 | 651 | 153.9 |
| C | 8 | 112 | 6153 | 35.75 | 648 | 651 | 153.9 |
| D | 1 | 52 | 237908 | 1463.95 | 658 | 636 | 162.1 |
| D | 2 | 234 | 23074 | 138.44 | 658 | 636 | 162.1 |
| D | 2 | 120 | 16678 | 98.98 | 658 | 636 | 162.1 |
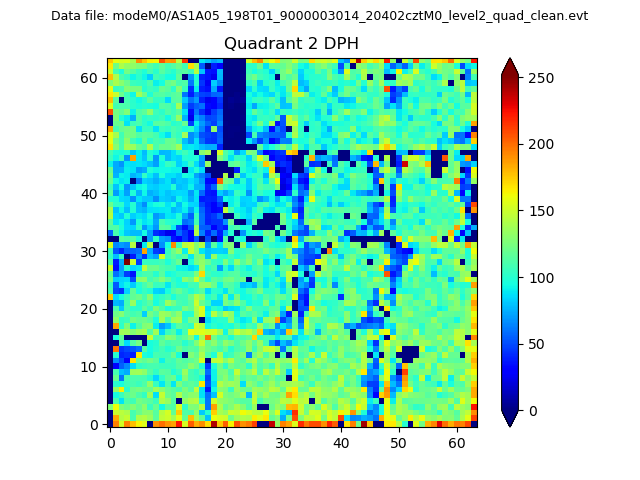
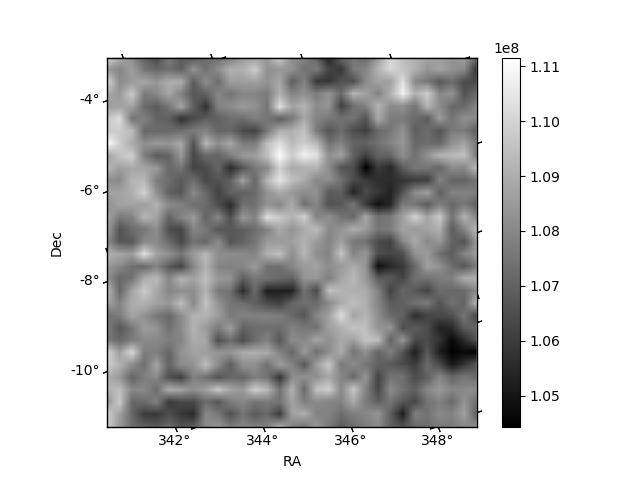
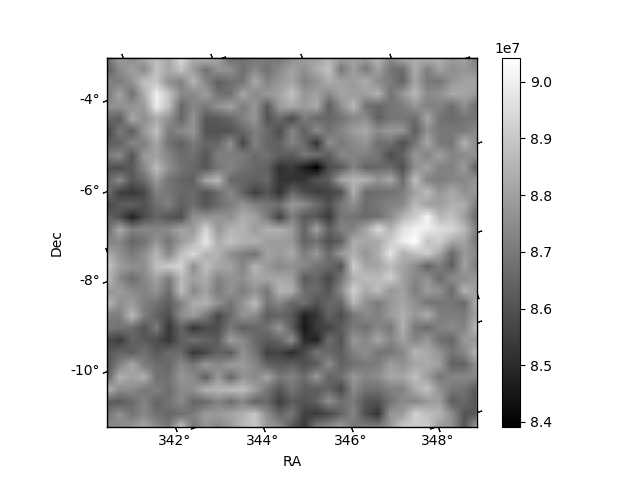
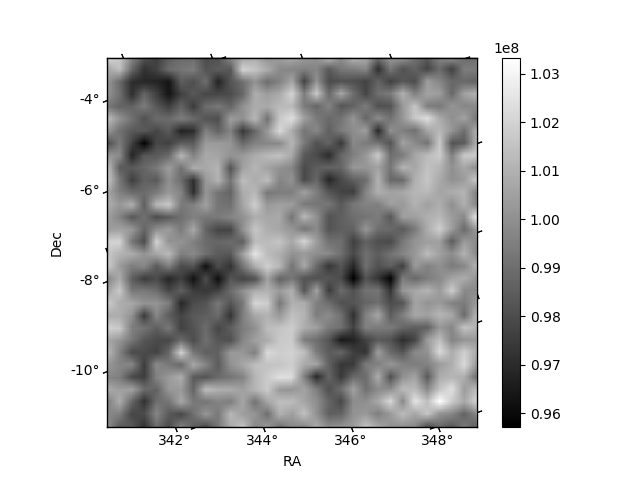
Histogram calculated using DETX and DETY for each event in the final _common_clean file
| Quadrant A | 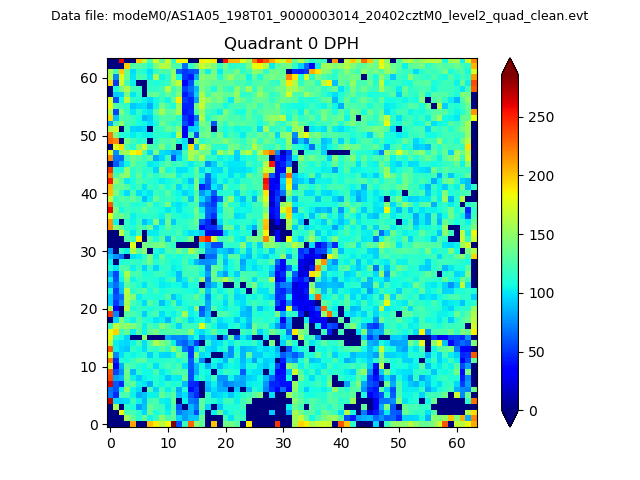 |
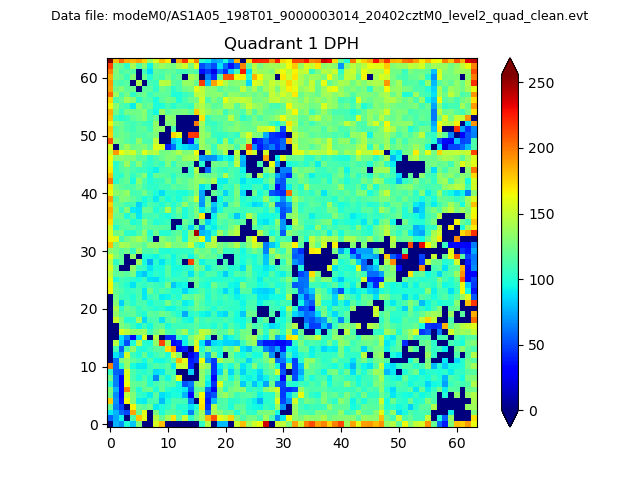 |
Quadrant B |
|---|---|---|---|
| Quadrant D | 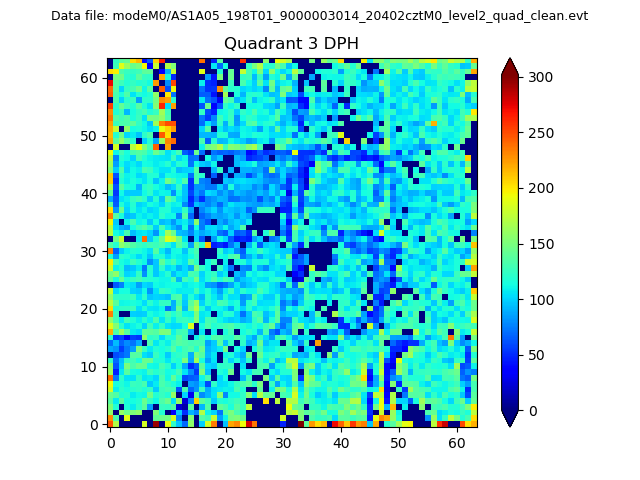 |
 |
Quadrant C |
| Plot type | Count rate plots | Images |
|---|---|---|
| Comparison with Poisson distribution Blue bars denote a histogram of data divided into 1 sec bins. Red curve is a Poisson curve with rate = median count rate of data. |
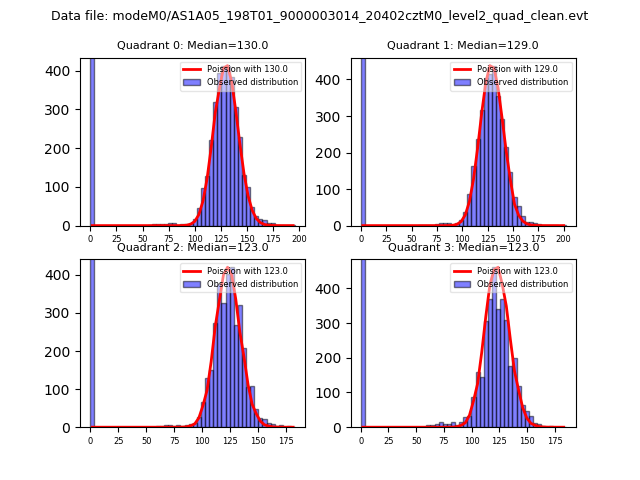 |
 |
| Quadrant-wise count rates Data is divided into 100 sec bins |
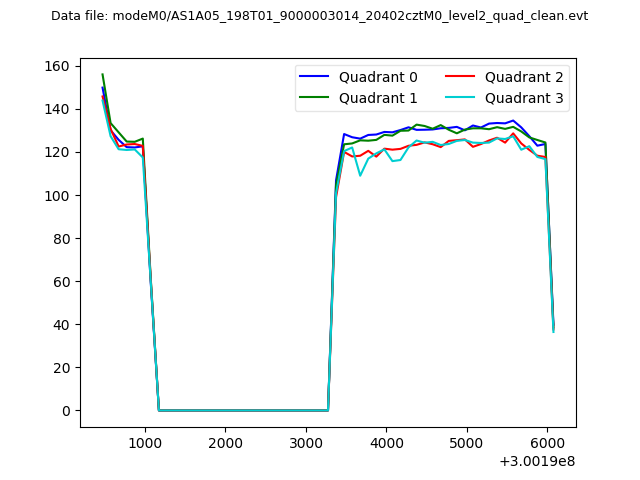 |
|
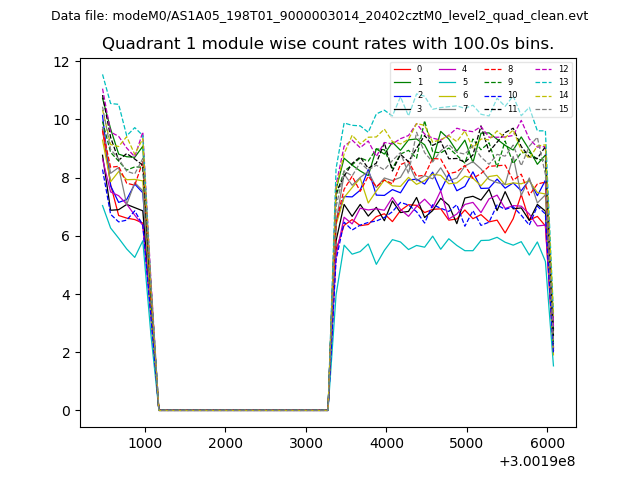
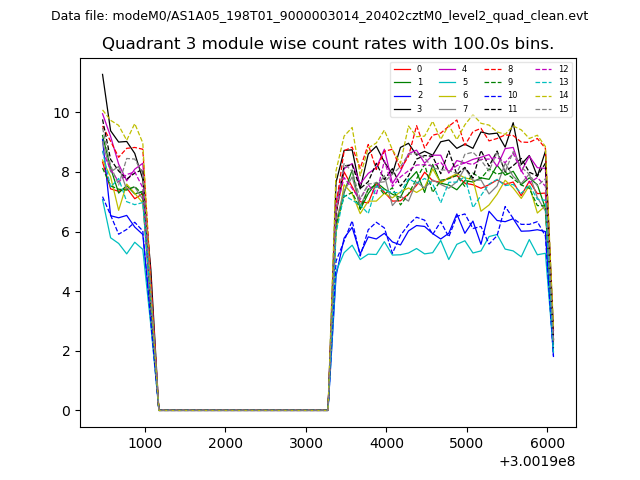
| Module-wise count rates for Quadrant A Data is divided into 100 sec bins |
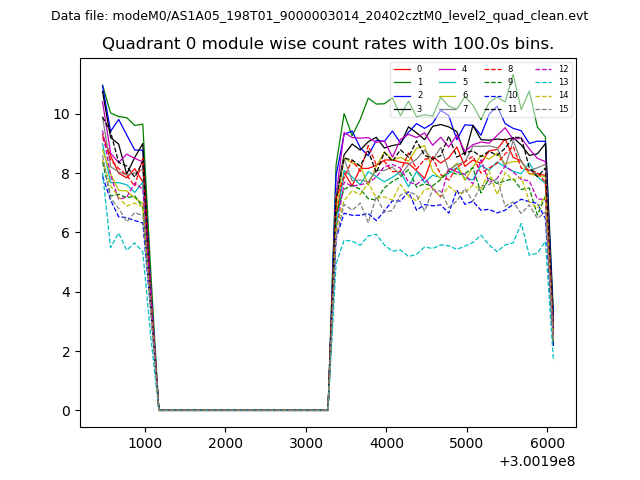 |
 |
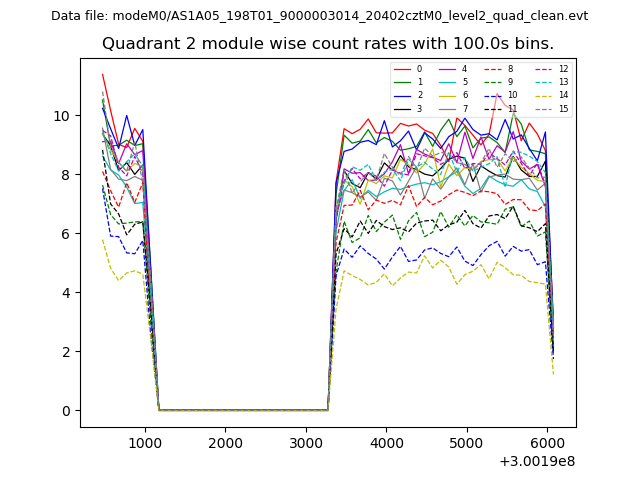
| Module-wise count rates for Quadrant B Data is divided into 100 sec bins |
 |
 |
| Module-wise count rates for Quadrant C Data is divided into 100 sec bins |
 |
 |
| Module-wise count rates for Quadrant D Data is divided into 100 sec bins |
 |
 |
| Parameter | Plot |
|---|---|
| CZT HV Monitor | 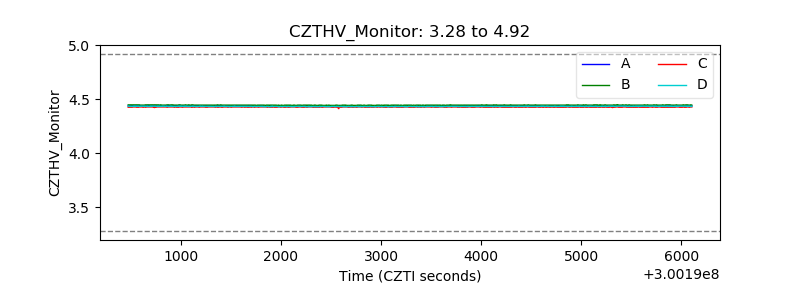 |
| D_VDD | 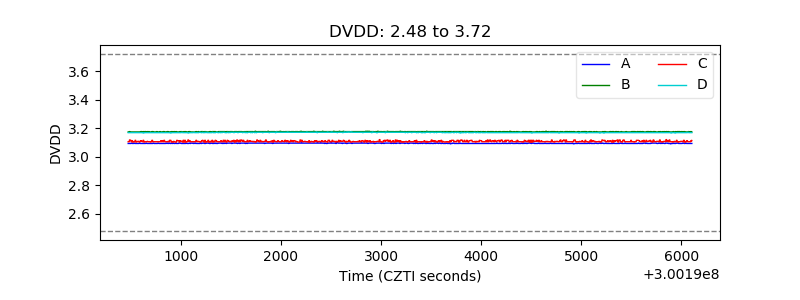 |
| Temperature 1 | 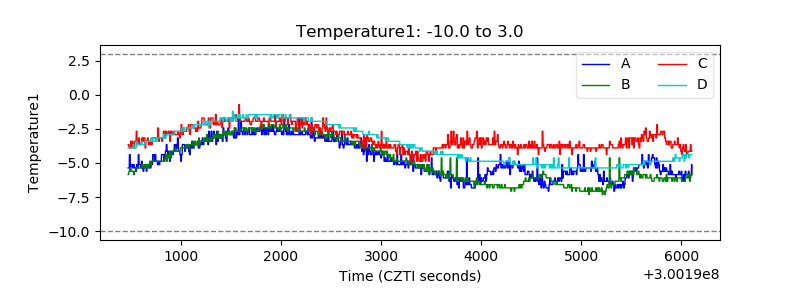 |
| Veto HV Monitor | 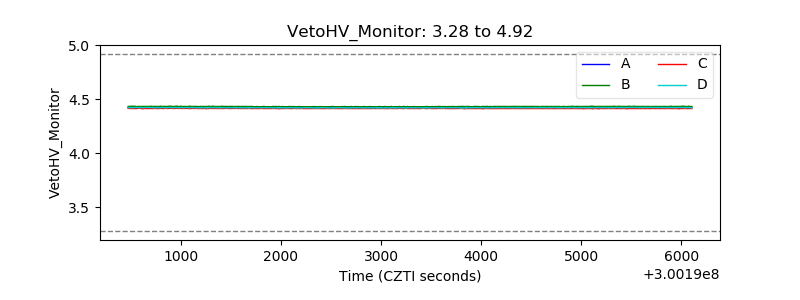 |
| Veto LLD | 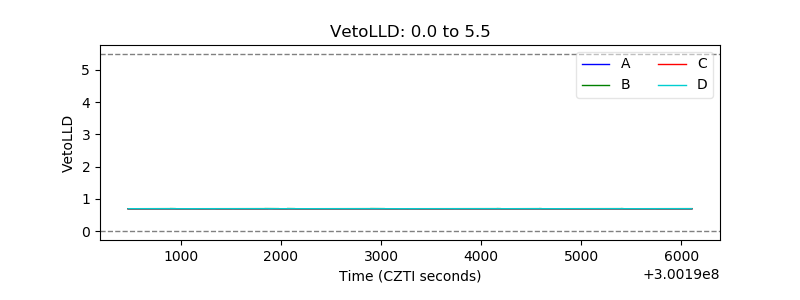 |
| Alpha Counter |  |
| _CPM_Rate | 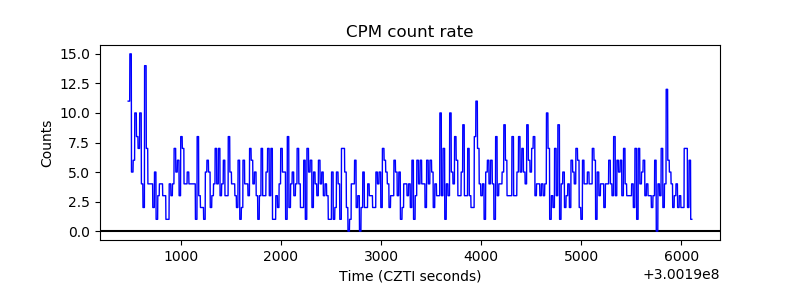 |
| CZT Counter |  |
| +2.5 Volts monitor |  |
| +5 Volts monitor |  |
| _ROLL_ROT | 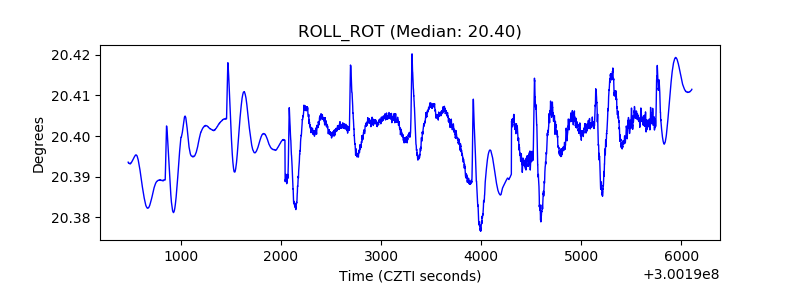 |
| _Roll_DEC | 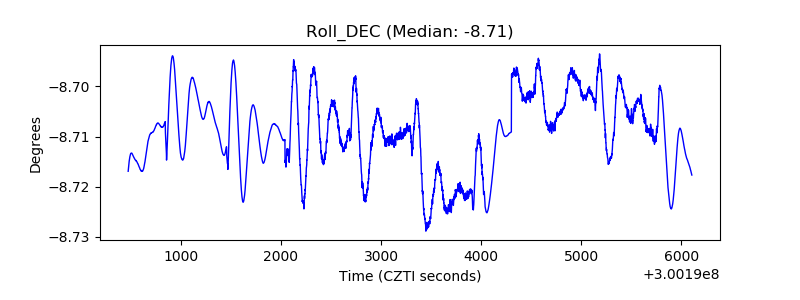 |
| _Roll_RA |  |
| Veto Counter | 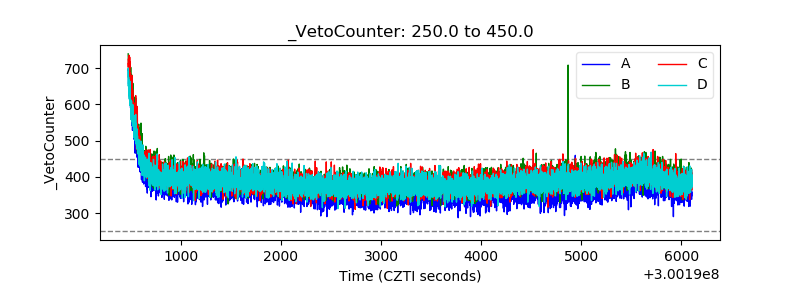 |