| Param | Original file | Final file |
|---|---|---|
| Filename | modeM0/AS1A05_198T01_9000003014_20403cztM0_level2.evt | modeM0/AS1A05_198T01_9000003014_20403cztM0_level2_quad_clean.evt |
| Size (bytes) | 1,372,273,920 | 218,511,360 |
| Size | 1.3 GB | 208.4 MB |
| Events in quadrant A | 9,149,846 | 1,360,178 |
| Events in quadrant B | 10,338,204 | 1,352,974 |
| Events in quadrant C | 9,177,964 | 1,295,554 |
| Events in quadrant D | 11,586,788 | 1,277,454 |
| Mode SS | |||
|---|---|---|---|
| Quadrant | BADHDUFLAG | Total packets | Discarded packets |
| A | 0 | 394 | 0 |
| B | 0 | 394 | 0 |
| C | 0 | 394 | 0 |
| D | 0 | 394 | 0 |
| Mode M0 | |||
|---|---|---|---|
| Quadrant | BADHDUFLAG | Total packets | Discarded packets |
| A | 0 | 39721 | 4 |
| B | 0 | 42835 | 4 |
| C | 0 | 39515 | 4 |
| D | 0 | 47705 | 4 |
| Mode M9 | |||
|---|---|---|---|
| Quadrant | BADHDUFLAG | Total packets | Discarded packets |
| A | 0 | 14 | 0 |
| B | 0 | 14 | 0 |
| C | 0 | 14 | 0 |
| D | 0 | 14 | 0 |
| Quadrant | Total seconds | Saturated seconds | Saturation percentage |
|---|---|---|---|
| A | 19321 | 274 | 1.418146% |
| B | 19322 | 455 | 2.354829% |
| C | 19322 | 310 | 1.604389% |
| D | 19322 | 1040 | 5.382466% |
Noise dominated data is calculated using 1-second bins in cleaned event files. If a bin has >2000 counts, and if more than 50% of those come from <1% of pixels, then it is considered to be noise-dominated and hence unusable.
| Quadrant | # 1 sec bins | Bins with >0 counts | Bins with >2000 counts | High rate bins dominated by noise | Noise dominated (total time) | Noise dominated (detector-on time) | Marked lightcurve |
|---|---|---|---|---|---|---|---|
| A | 20776 | 19323 | 6 | 6 | 0.03% | 0.03% | 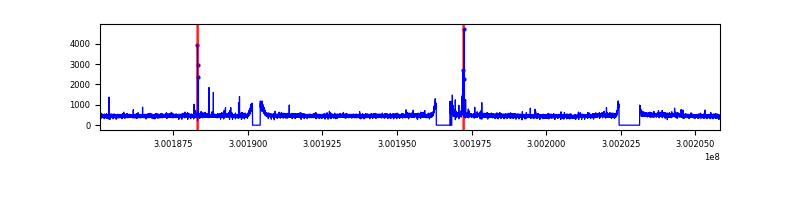 |
| B | 20777 | 19325 | 97 | 97 | 0.47% | 0.50% | 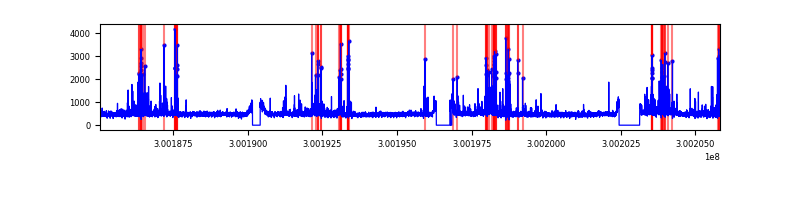 |
| C | 20777 | 19326 | 0 | 0 | 0.00% | 0.00% | 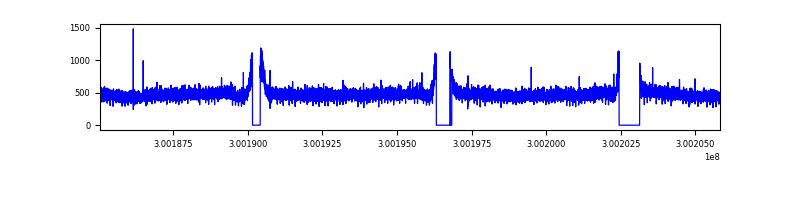 |
| D | 20777 | 19326 | 685 | 685 | 3.30% | 3.54% | 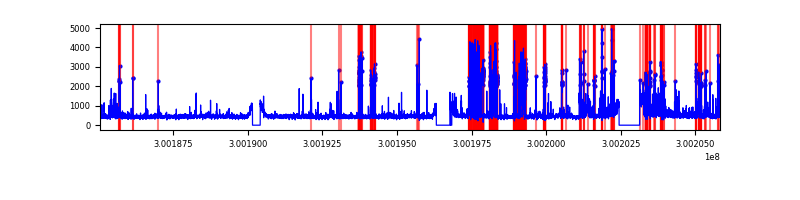 |
Top three noisy pixels from each quadrant. If the there are fewer than three noisy pixels in the level2.evt file, extra rows are filled as -1
| Pixel properties | Quadrant properties | ||||||
|---|---|---|---|---|---|---|---|
| Quadrant | DetID | PixID | Counts | Sigma | Mean | Median | Sigma |
| A | 5 | 16 | 73985 | 151.49 | 2353 | 2301 | 473.2 |
| A | 0 | 226 | 20046 | 37.5 | 2353 | 2301 | 473.2 |
| A | 3 | 137 | 19969 | 37.34 | 2353 | 2301 | 473.2 |
| B | 7 | 220 | 566841 | 1266.37 | 2321 | 2255 | 445.8 |
| B | 10 | 245 | 264915 | 589.15 | 2321 | 2255 | 445.8 |
| B | 0 | 189 | 244031 | 542.3 | 2321 | 2255 | 445.8 |
| C | 14 | 238 | 348680 | 653.03 | 2250 | 2260 | 530.5 |
| C | 7 | 220 | 24529 | 41.98 | 2250 | 2260 | 530.5 |
| C | 8 | 128 | 19551 | 32.59 | 2250 | 2260 | 530.5 |
| D | 1 | 52 | 2926198 | 5372.61 | 2251 | 2186 | 544.2 |
| D | 13 | 153 | 84028 | 150.38 | 2251 | 2186 | 544.2 |
| D | 2 | 234 | 79144 | 141.4 | 2251 | 2186 | 544.2 |
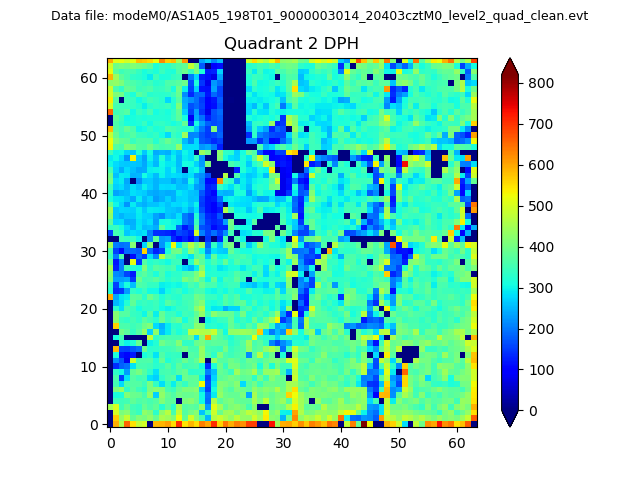
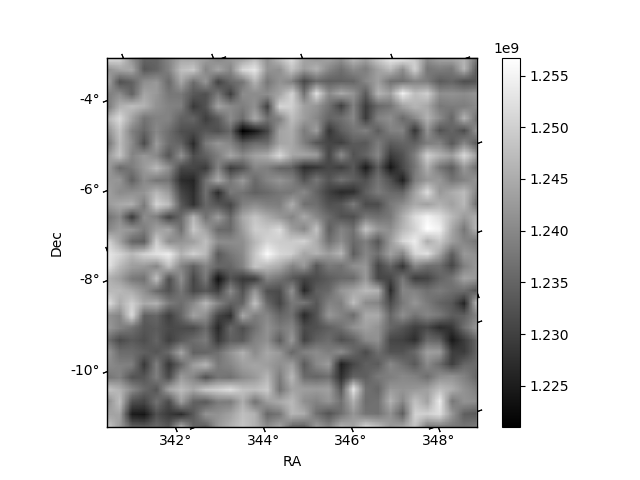
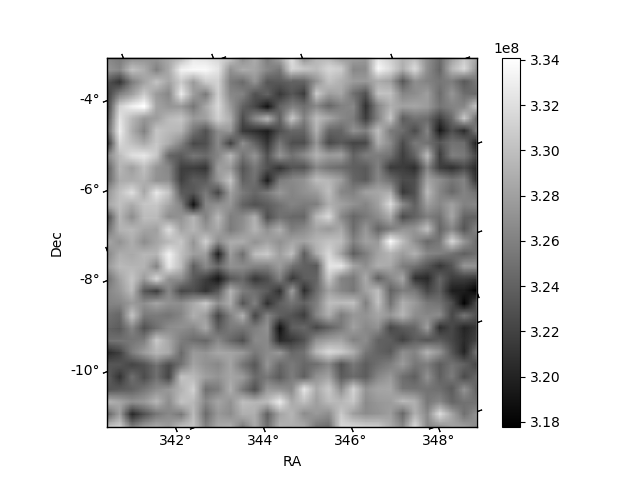
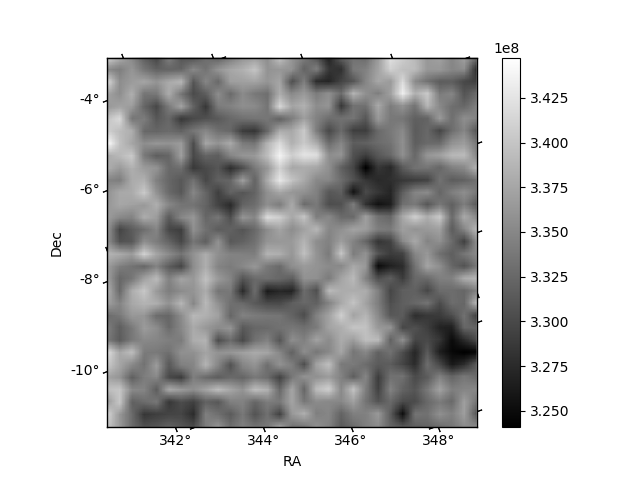
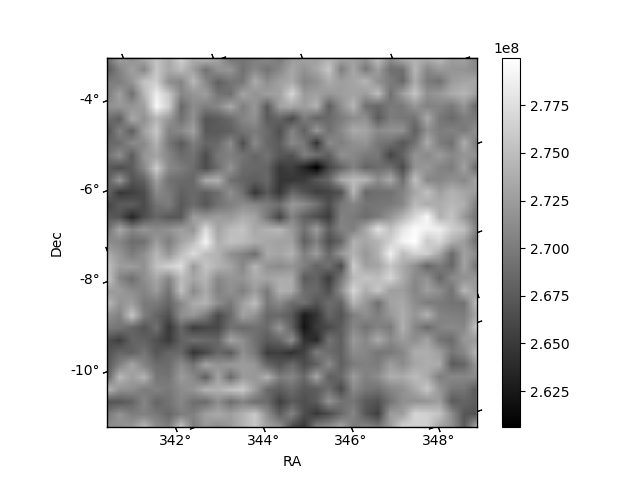
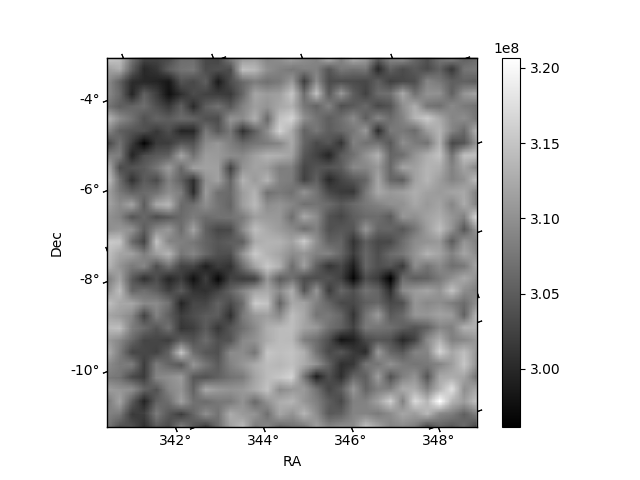
Histogram calculated using DETX and DETY for each event in the final _common_clean file
| Quadrant A | 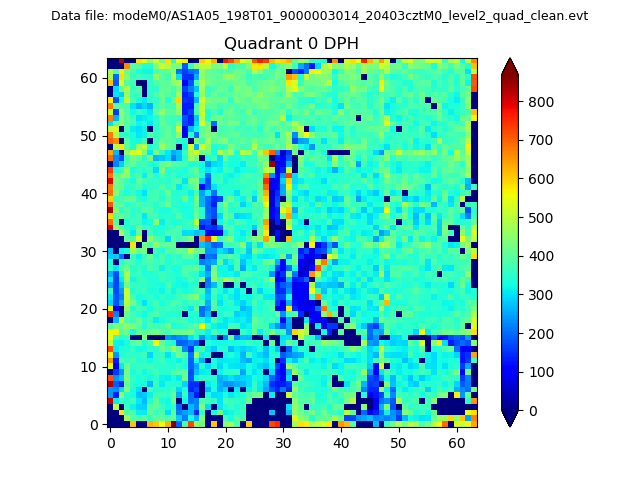 |
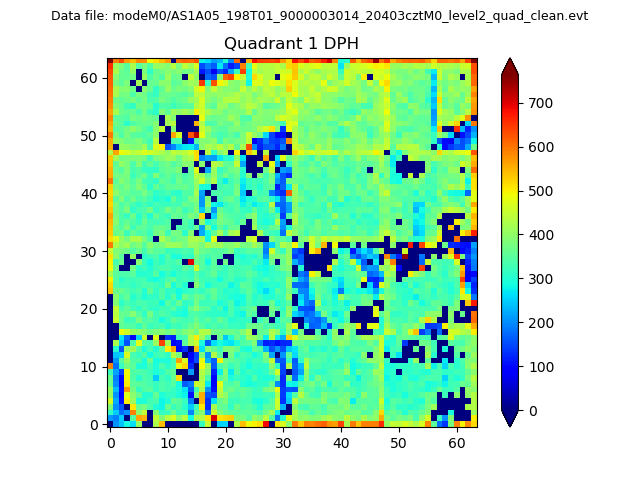 |
Quadrant B |
|---|---|---|---|
| Quadrant D | 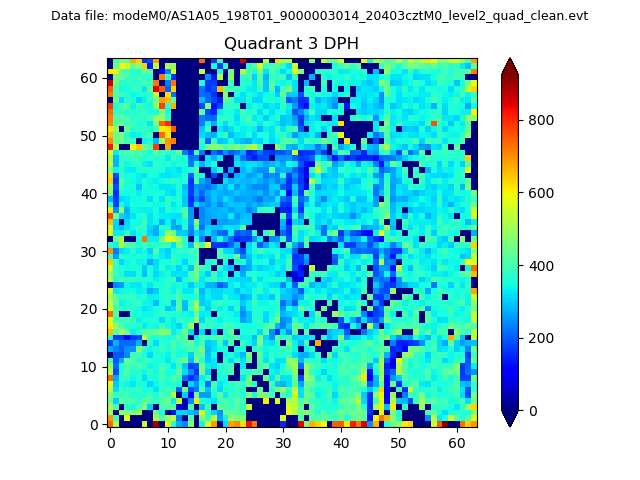 |
 |
Quadrant C |
| Plot type | Count rate plots | Images |
|---|---|---|
| Comparison with Poisson distribution Blue bars denote a histogram of data divided into 1 sec bins. Red curve is a Poisson curve with rate = median count rate of data. |
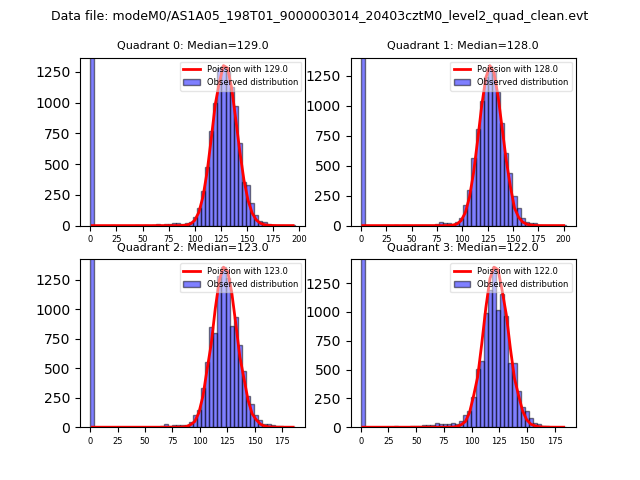 |
 |
| Quadrant-wise count rates Data is divided into 100 sec bins |
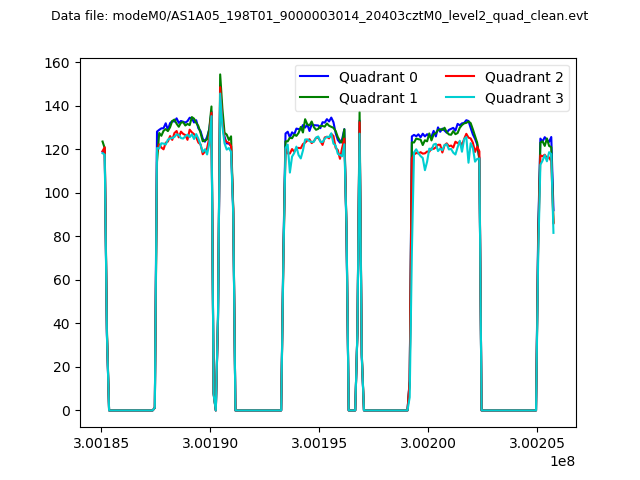 |
|
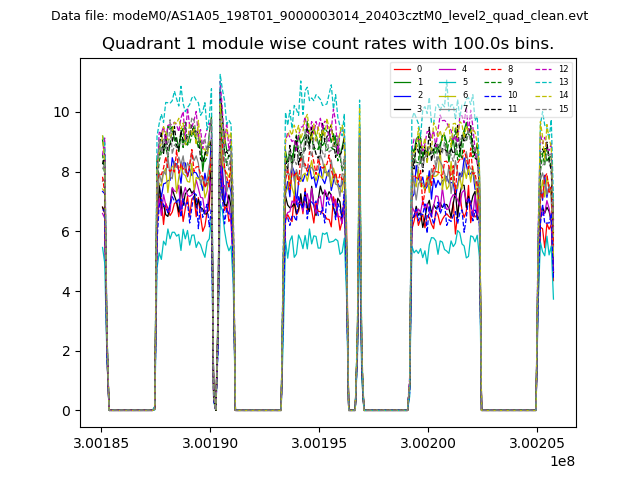
| Module-wise count rates for Quadrant A Data is divided into 100 sec bins |
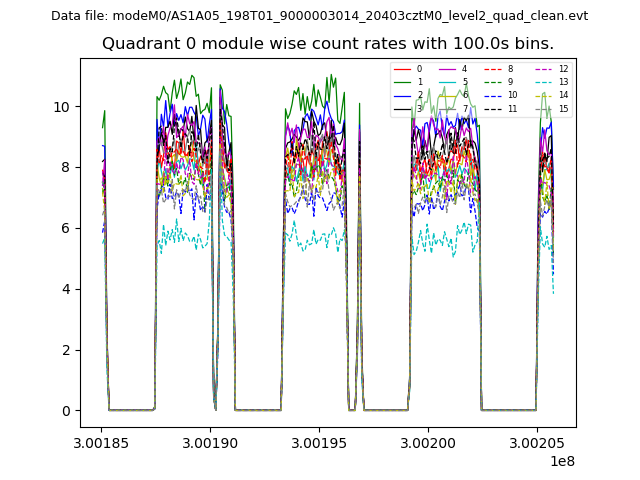 |
 |
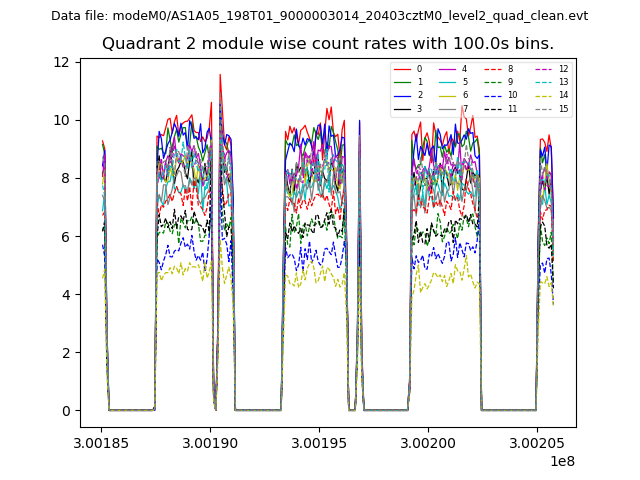
| Module-wise count rates for Quadrant B Data is divided into 100 sec bins |
 |
 |
| Module-wise count rates for Quadrant C Data is divided into 100 sec bins |
 |
 |
| Module-wise count rates for Quadrant D Data is divided into 100 sec bins |
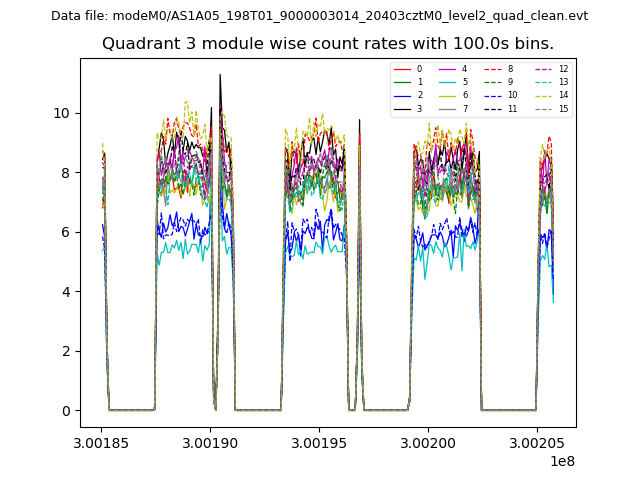 |
 |
| Parameter | Plot |
|---|---|
| CZT HV Monitor | 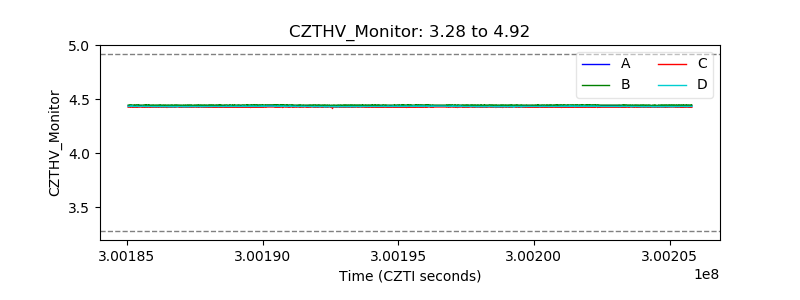 |
| D_VDD | 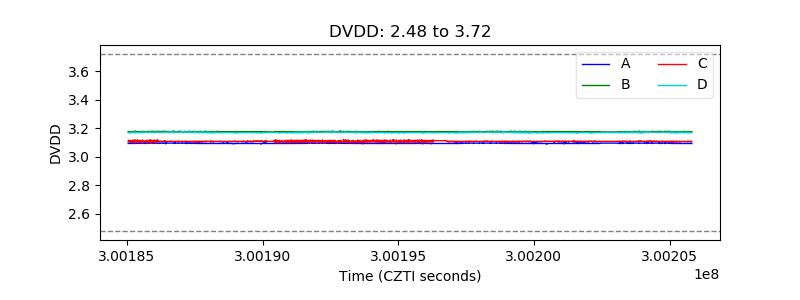 |
| Temperature 1 | 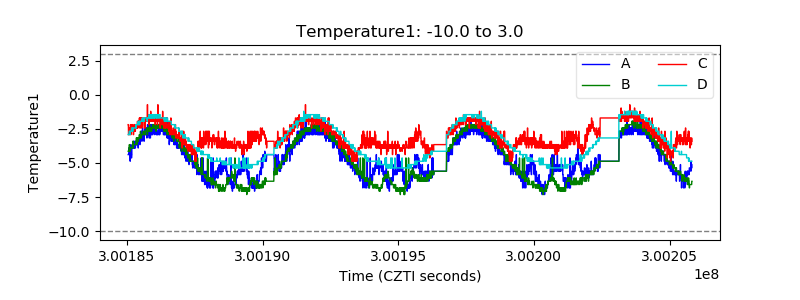 |
| Veto HV Monitor | 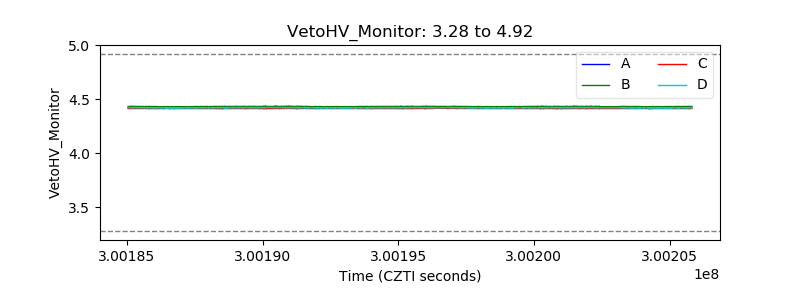 |
| Veto LLD | 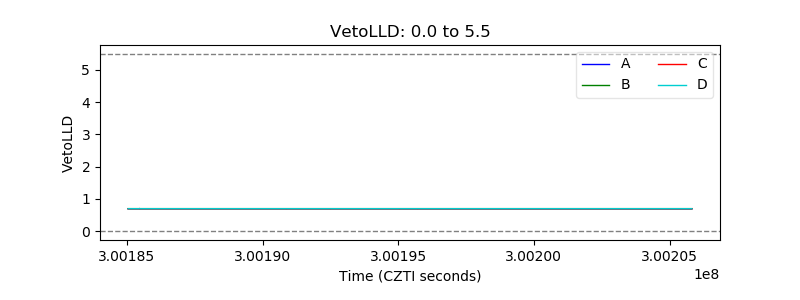 |
| Alpha Counter | 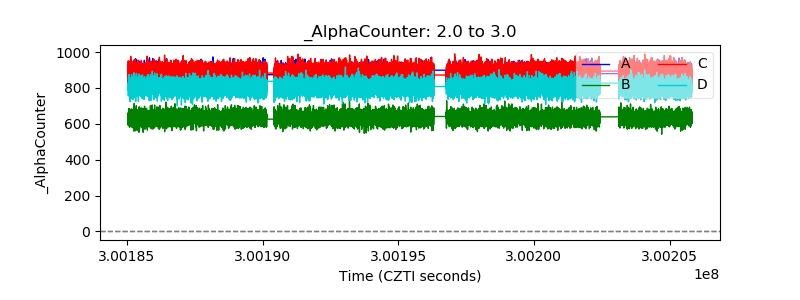 |
| _CPM_Rate | 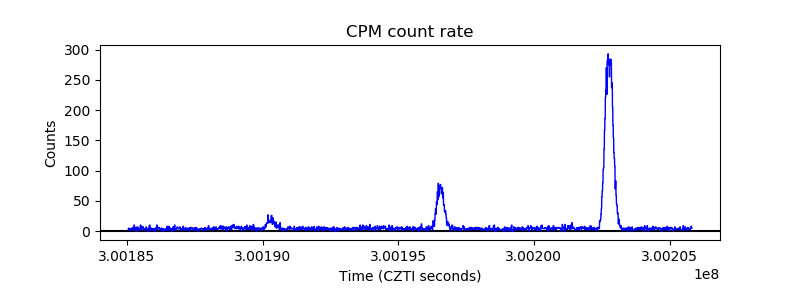 |
| CZT Counter | 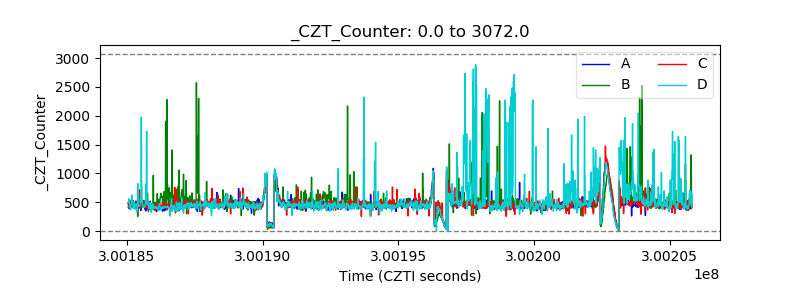 |
| +2.5 Volts monitor |  |
| +5 Volts monitor |  |
| _ROLL_ROT | 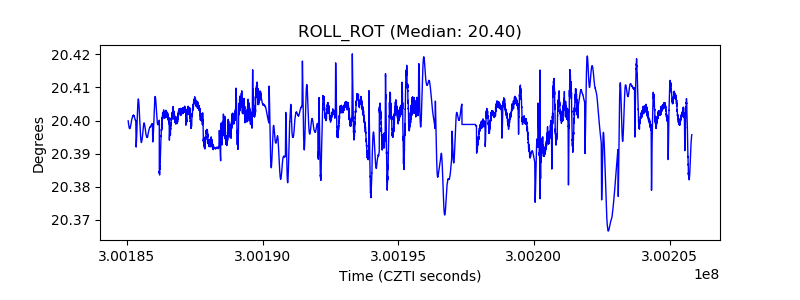 |
| _Roll_DEC | 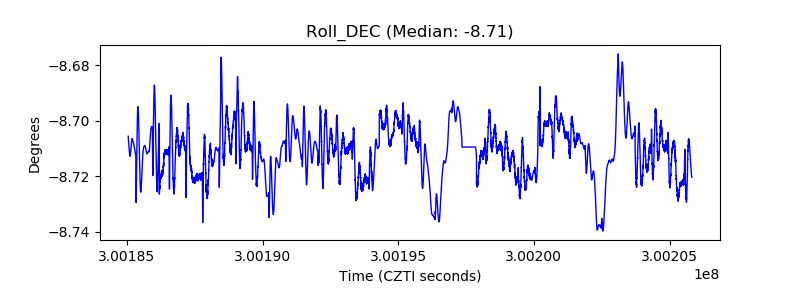 |
| _Roll_RA | 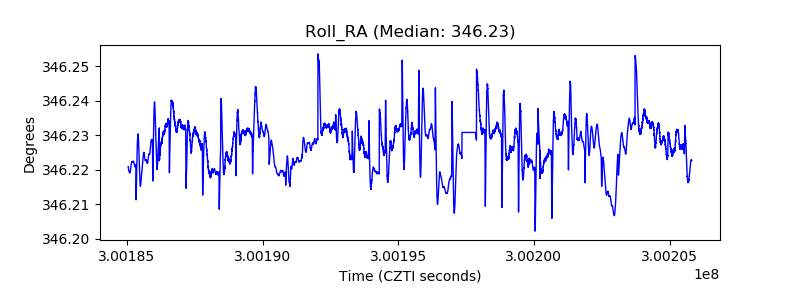 |
| Veto Counter | 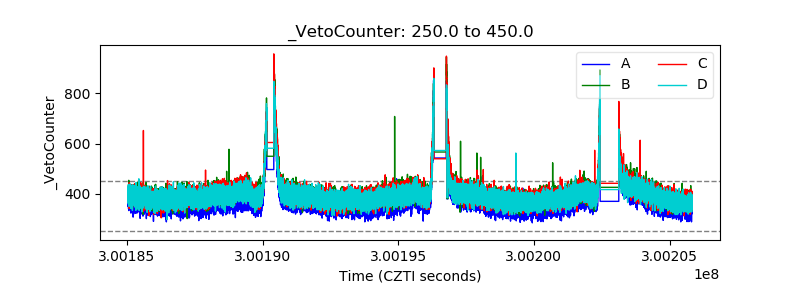 |