| Param | Original file | Final file |
|---|---|---|
| Filename | modeM0/AS1A05_198T01_9000003014_20576cztM0_level2.evt | modeM0/AS1A05_198T01_9000003014_20576cztM0_level2_quad_clean.evt |
| Size (bytes) | 182,704,320 | 30,110,400 |
| Size | 174.2 MB | 28.7 MB |
| Events in quadrant A | 1,146,567 | 188,844 |
| Events in quadrant B | 1,275,873 | 189,352 |
| Events in quadrant C | 1,149,032 | 183,250 |
| Events in quadrant D | 1,792,365 | 173,567 |
| Mode SS | |||
|---|---|---|---|
| Quadrant | BADHDUFLAG | Total packets | Discarded packets |
| A | 0 | 87 | 32 |
| B | 0 | 88 | 36 |
| C | 0 | 89 | 35 |
| D | 0 | 84 | 36 |
| Mode M0 | |||
|---|---|---|---|
| Quadrant | BADHDUFLAG | Total packets | Discarded packets |
| A | 0 | 8828 | 3741 |
| B | 0 | 9455 | 4045 |
| C | 0 | 8882 | 3789 |
| D | 0 | 14551 | 7620 |
| Mode M9 | |||
|---|---|---|---|
| Quadrant | BADHDUFLAG | Total packets | Discarded packets |
| A | 0 | 5 | 0 |
| B | 0 | 5 | 0 |
| C | 0 | 5 | 0 |
| D | 0 | 6 | 1 |
| Quadrant | Total seconds | Saturated seconds | Saturation percentage |
|---|---|---|---|
| A | 2468 | 25 | 1.012966% |
| B | 2475 | 52 | 2.101010% |
| C | 2469 | 47 | 1.903605% |
| D | 2385 | 172 | 7.211740% |
Noise dominated data is calculated using 1-second bins in cleaned event files. If a bin has >2000 counts, and if more than 50% of those come from <1% of pixels, then it is considered to be noise-dominated and hence unusable.
| Quadrant | # 1 sec bins | Bins with >0 counts | Bins with >2000 counts | High rate bins dominated by noise | Noise dominated (total time) | Noise dominated (detector-on time) | Marked lightcurve |
|---|---|---|---|---|---|---|---|
| A | 5508 | 2709 | 0 | 0 | 0.00% | 0.00% |  |
| B | 5594 | 2689 | 4 | 4 | 0.07% | 0.15% | 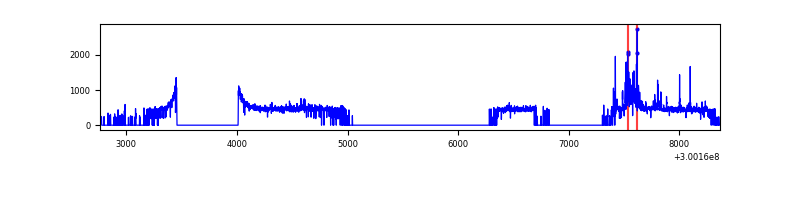 |
| C | 5584 | 2699 | 0 | 0 | 0.00% | 0.00% | 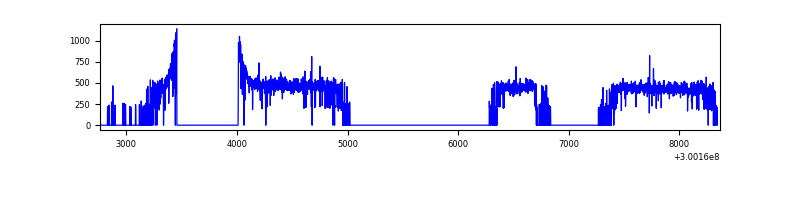 |
| D | 5440 | 2592 | 132 | 132 | 2.43% | 5.09% | 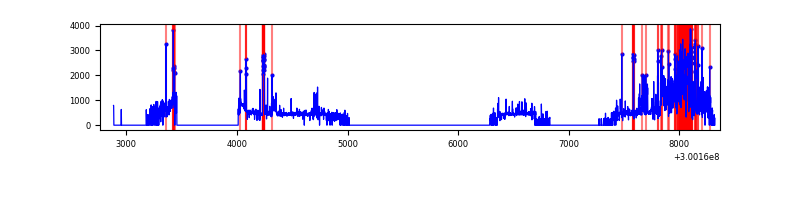 |
Top three noisy pixels from each quadrant. If the there are fewer than three noisy pixels in the level2.evt file, extra rows are filled as -1
| Pixel properties | Quadrant properties | ||||||
|---|---|---|---|---|---|---|---|
| Quadrant | DetID | PixID | Counts | Sigma | Mean | Median | Sigma |
| A | 0 | 226 | 2549 | 36.44 | 297 | 290 | 62.0 |
| A | 3 | 137 | 2490 | 35.49 | 297 | 290 | 62.0 |
| A | 12 | 194 | 2179 | 30.47 | 297 | 290 | 62.0 |
| B | 7 | 220 | 54448 | 925.98 | 296 | 288 | 58.5 |
| B | 0 | 197 | 26676 | 451.16 | 296 | 288 | 58.5 |
| B | 0 | 190 | 8436 | 139.31 | 296 | 288 | 58.5 |
| C | 14 | 238 | 44152 | 640.97 | 283 | 285 | 68.4 |
| C | 13 | 61 | 2027 | 25.45 | 283 | 285 | 68.4 |
| C | 8 | 208 | 1151 | 12.65 | 283 | 285 | 68.4 |
| D | 1 | 52 | 271702 | 4026.69 | 270 | 262 | 67.4 |
| D | 7 | 96 | 217651 | 3224.87 | 270 | 262 | 67.4 |
| D | 5 | 222 | 202811 | 3004.72 | 270 | 262 | 67.4 |
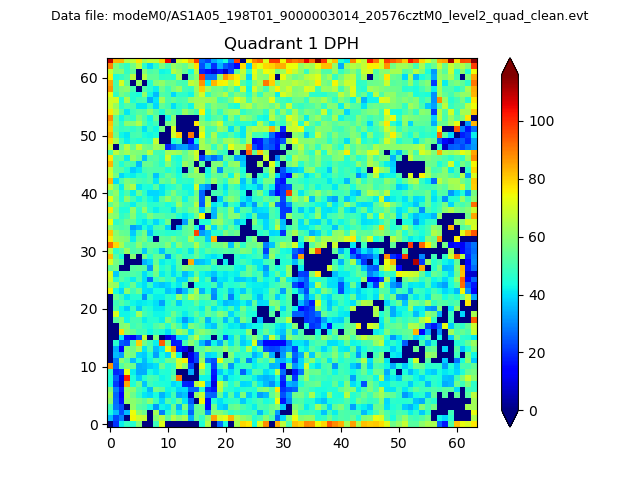
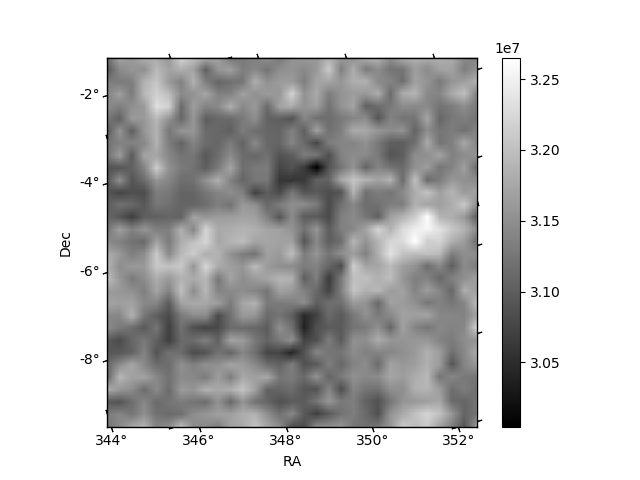
Histogram calculated using DETX and DETY for each event in the final _common_clean file
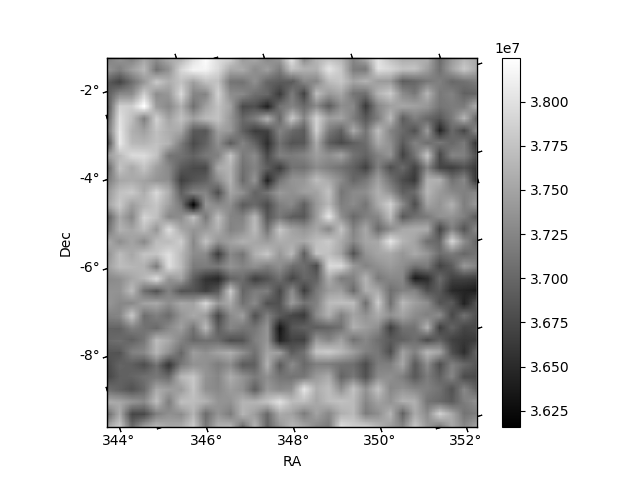
| Quadrant A | 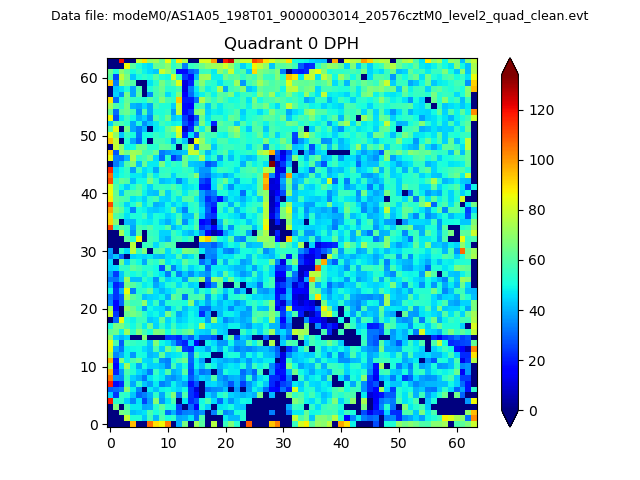 |
 |
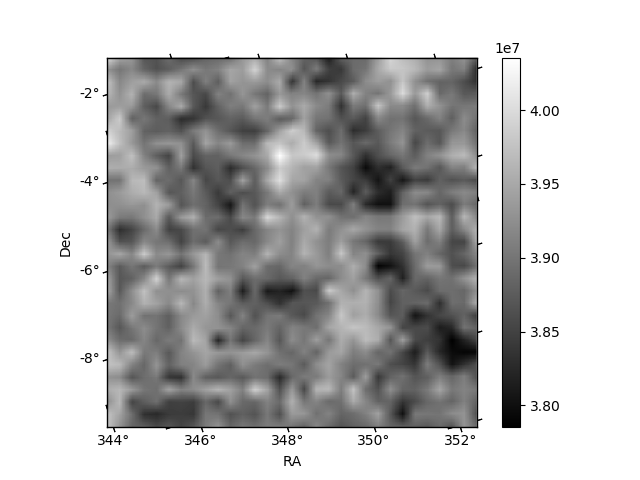
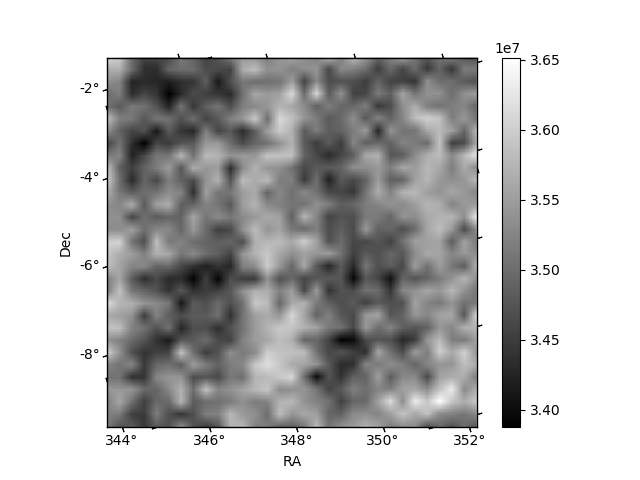
Quadrant B |
|---|---|---|---|
| Quadrant D | 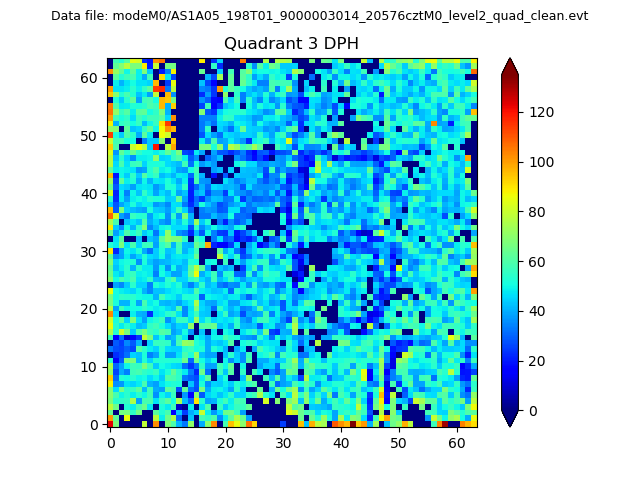 |
 |
Quadrant C |
| Plot type | Count rate plots | Images |
|---|---|---|
| Comparison with Poisson distribution Blue bars denote a histogram of data divided into 1 sec bins. Red curve is a Poisson curve with rate = median count rate of data. |
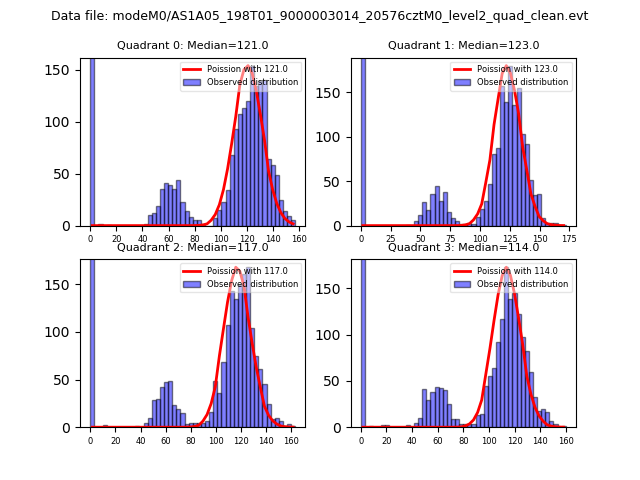 |
 |
| Quadrant-wise count rates Data is divided into 100 sec bins |
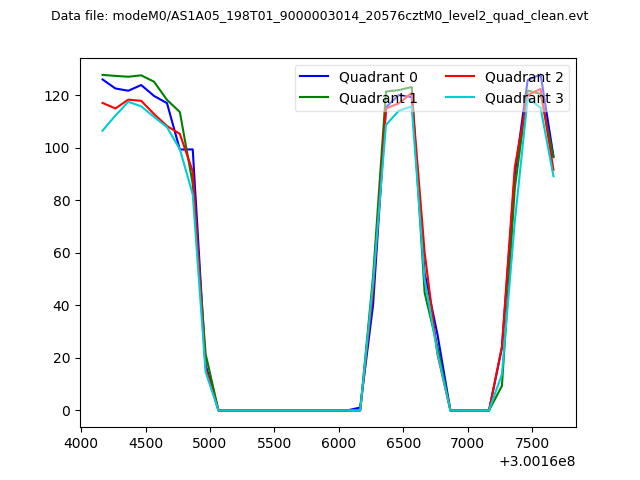 |
|
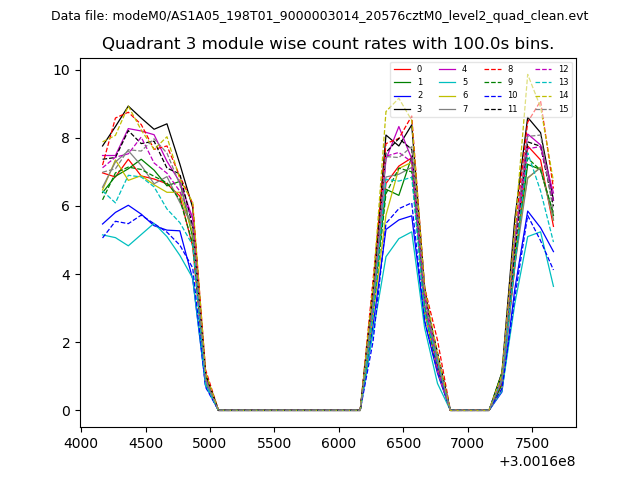
| Module-wise count rates for Quadrant A Data is divided into 100 sec bins |
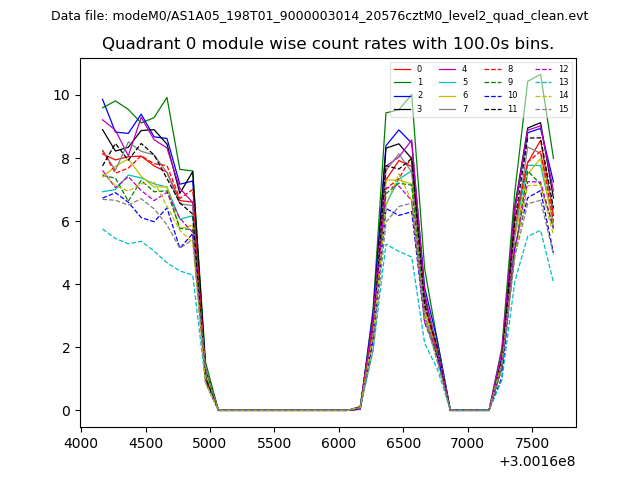 |
 |
| Module-wise count rates for Quadrant B Data is divided into 100 sec bins |
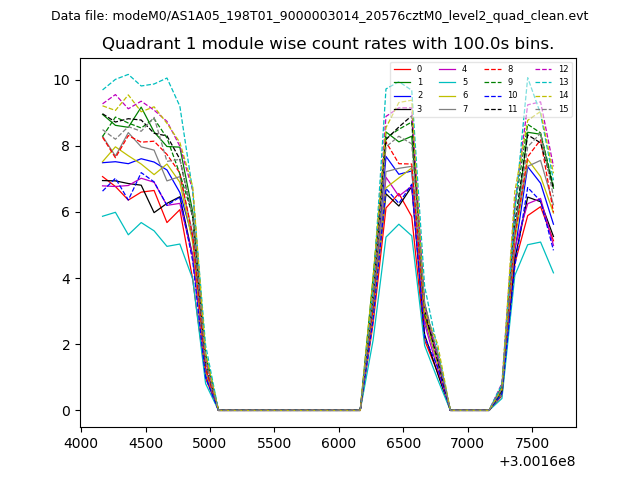 |
 |
| Module-wise count rates for Quadrant C Data is divided into 100 sec bins |
 |
 |
| Module-wise count rates for Quadrant D Data is divided into 100 sec bins |
 |
 |
| Parameter | Plot |
|---|---|
| CZT HV Monitor | 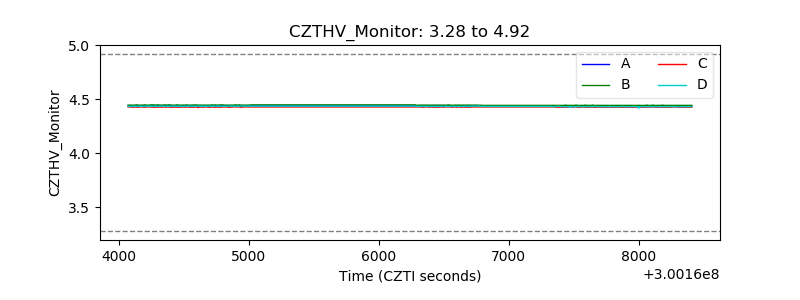 |
| D_VDD | 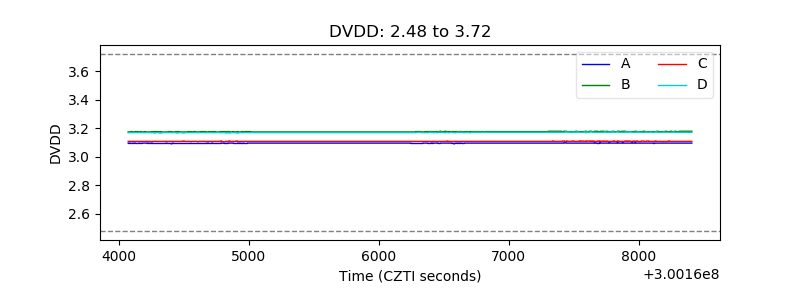 |
| Temperature 1 | 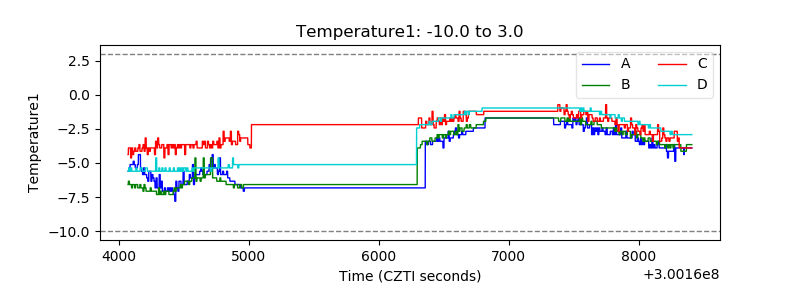 |
| Veto HV Monitor | 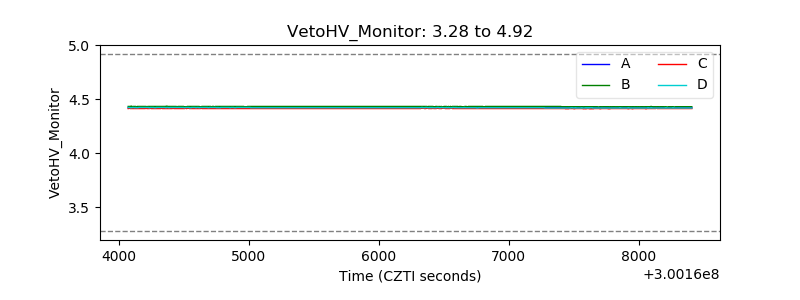 |
| Veto LLD | 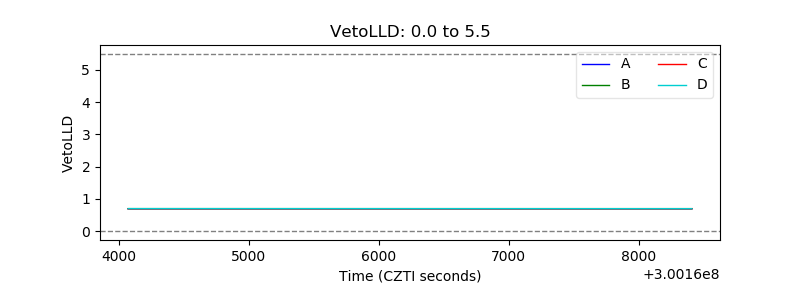 |
| Alpha Counter |  |
| _CPM_Rate | 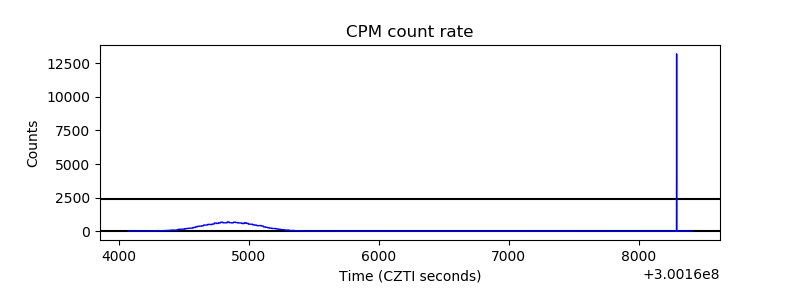 |
| CZT Counter | 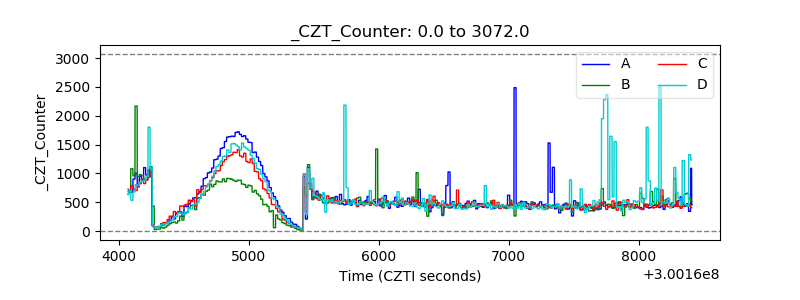 |
| +2.5 Volts monitor | 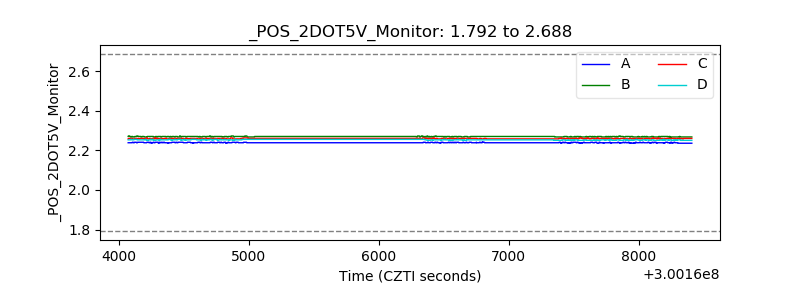 |
| +5 Volts monitor |  |
| _ROLL_ROT | 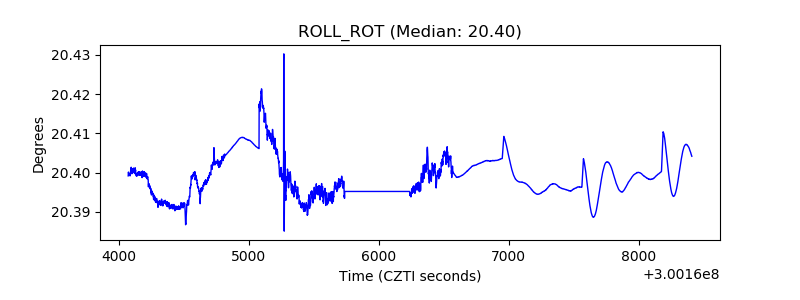 |
| _Roll_DEC | 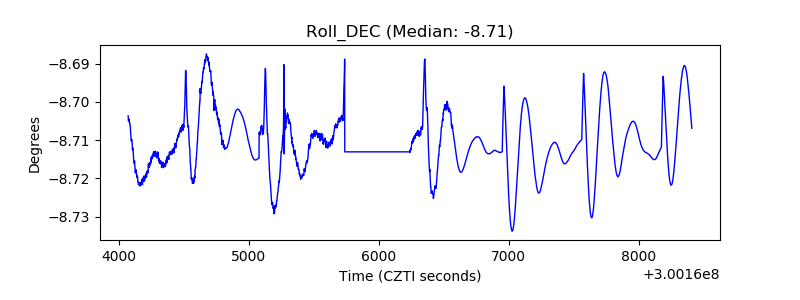 |
| _Roll_RA | 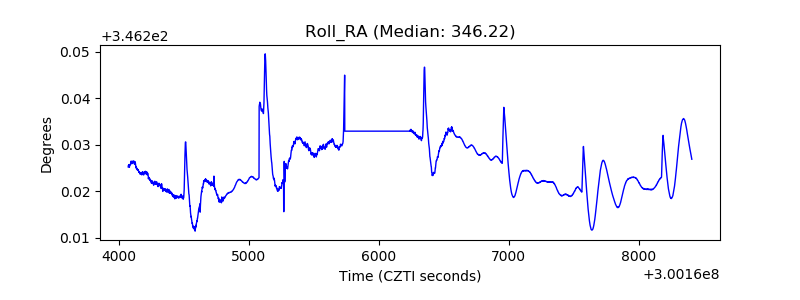 |
| Veto Counter | 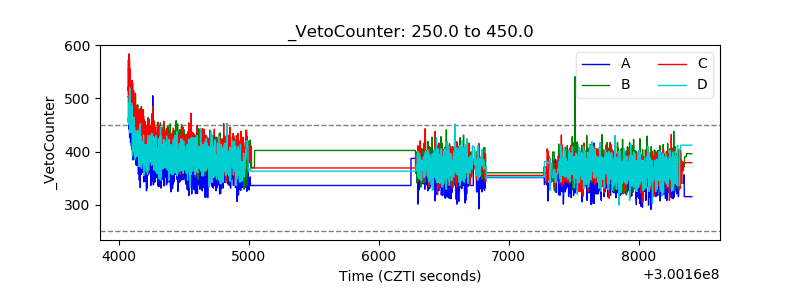 |