| Param | Original file | Final file |
|---|---|---|
| Filename | modeM0/AS1A05_140T01_9000003016cztM0_level2.fits | modeM0/AS1A05_140T01_9000003016cztM0_level2_quad_clean.evt |
| Size (bytes) | 786,905,280 | 700,554,240 |
| Size | 750.5 MB | 668.1 MB |
| Events in quadrant A | 4,875,234 | 4,175,531 |
| Events in quadrant B | 4,678,490 | 4,111,899 |
| Events in quadrant C | 4,752,842 | 3,918,629 |
| Events in quadrant D | 4,141,904 | 3,625,644 |
| Mode SS | |||
|---|---|---|---|
| Quadrant | BADHDUFLAG | Total packets | Discarded packets |
| A | 0 | 1600 | 0 |
| B | 0 | 1600 | 0 |
| C | 0 | 1600 | 0 |
| D | 0 | 1600 | 0 |
| Mode M9 | |||
|---|---|---|---|
| Quadrant | BADHDUFLAG | Total packets | Discarded packets |
| A | 0 | 132 | 0 |
| B | 0 | 132 | 0 |
| C | 0 | 132 | 0 |
| D | 0 | 132 | 0 |
| Mode M0 | |||
|---|---|---|---|
| Quadrant | BADHDUFLAG | Total packets | Discarded packets |
| A | 0 | 163607 | 0 |
| B | 0 | 168497 | 0 |
| C | 0 | 163126 | 0 |
| D | 0 | 180275 | 0 |
| Quadrant | Total seconds | Saturated seconds | Saturation percentage |
|---|---|---|---|
| A | 78520 | 823 | 1.048141% |
| B | 78520 | 1108 | 1.411105% |
| C | 78520 | 1194 | 1.520632% |
| D | 78520 | 1683 | 2.143403% |
Noise dominated data is calculated using 1-second bins in cleaned event files. If a bin has >2000 counts, and if more than 50% of those come from <1% of pixels, then it is considered to be noise-dominated and hence unusable.
| Quadrant | # 1 sec bins | Bins with >0 counts | Bins with >2000 counts | High rate bins dominated by noise | Noise dominated (total time) | Noise dominated (detector-on time) | Marked lightcurve |
|---|---|---|---|---|---|---|---|
| A | 91676 | 78519 | 0 | 0 | 0.00% | 0.00% |  |
| B | 91676 | 78517 | 0 | 0 | 0.00% | 0.00% |  |
| C | 91676 | 78518 | 0 | 0 | 0.00% | 0.00% |  |
| D | 91676 | 78467 | 0 | 0 | 0.00% | 0.00% |  |
Top three noisy pixels from each quadrant. If the there are fewer than three noisy pixels in the level2.evt file, extra rows are filled as -1
| Pixel properties | Quadrant properties | ||||||
|---|---|---|---|---|---|---|---|
| Quadrant | DetID | PixID | Counts | Sigma | Mean | Median | Sigma |
| A | 0 | 29 | 4649 | 11.17 | 1268 | 1192 | 309.4 |
| A | 7 | 110 | 3937 | 8.87 | 1268 | 1192 | 309.4 |
| A | 0 | 30 | 3628 | 7.87 | 1268 | 1192 | 309.4 |
| B | 2 | 9 | 3767 | 10.72 | 1236 | 1183 | 241.0 |
| B | 2 | 8 | 3141 | 8.12 | 1236 | 1183 | 241.0 |
| B | 5 | 128 | 3100 | 7.95 | 1236 | 1183 | 241.0 |
| C | 1 | 80 | 3661 | 7.83 | 1254 | 1173 | 317.7 |
| C | 1 | 81 | 3608 | 7.66 | 1254 | 1173 | 317.7 |
| C | 12 | 241 | 3260 | 6.57 | 1254 | 1173 | 317.7 |
| D | 3 | 14 | 2965 | 6.02 | 1183 | 1080 | 313.3 |
| D | 10 | 189 | 2943 | 5.95 | 1183 | 1080 | 313.3 |
| D | 6 | 67 | 2899 | 5.81 | 1183 | 1080 | 313.3 |
Histogram calculated using DETX and DETY for each event in the final _common_clean file
| Quadrant A |  |
 |
Quadrant B |
|---|---|---|---|
| Quadrant D | 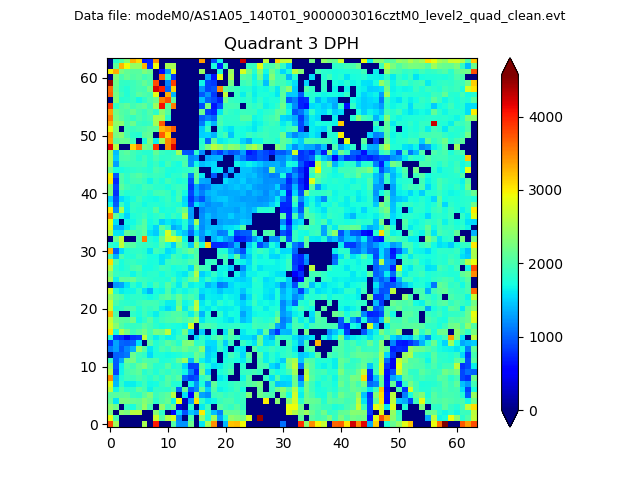 |
 |
Quadrant C |
| Plot type | Count rate plots | Images |
|---|---|---|
| Comparison with Poisson distribution Blue bars denote a histogram of data divided into 1 sec bins. Red curve is a Poisson curve with rate = median count rate of data. |
 |
 |
| Quadrant-wise count rates Data is divided into 100 sec bins |
 |
|
| Module-wise count rates for Quadrant A Data is divided into 100 sec bins |
 |
 |
| Module-wise count rates for Quadrant B Data is divided into 100 sec bins |
 |
 |
| Module-wise count rates for Quadrant C Data is divided into 100 sec bins |
 |
 |
| Module-wise count rates for Quadrant D Data is divided into 100 sec bins |
 |
 |
| Parameter | Plot |
|---|---|
| CZT HV Monitor |  |
| D_VDD |  |
| Temperature 1 |  |
| Veto HV Monitor |  |
| Veto LLD |  |
| Alpha Counter |  |
| _CPM_Rate |  |
| CZT Counter |  |
| +2.5 Volts monitor |  |
| +5 Volts monitor |  |
| _ROLL_ROT |  |
| _Roll_DEC |  |
| _Roll_RA |  |
| Veto Counter |  |