| Param | Original file | Final file |
|---|---|---|
| Filename | modeM0/AS1A05_140T01_9000003016_20404cztM0_level2.evt | modeM0/AS1A05_140T01_9000003016_20404cztM0_level2_quad_clean.evt |
| Size (bytes) | 405,564,480 | 85,524,480 |
| Size | 386.8 MB | 81.6 MB |
| Events in quadrant A | 2,889,803 | 554,003 |
| Events in quadrant B | 3,008,239 | 553,335 |
| Events in quadrant C | 2,865,690 | 528,147 |
| Events in quadrant D | 3,100,910 | 525,665 |
| Mode SS | |||
|---|---|---|---|
| Quadrant | BADHDUFLAG | Total packets | Discarded packets |
| A | 0 | 126 | 0 |
| B | 0 | 126 | 0 |
| C | 0 | 126 | 0 |
| D | 0 | 126 | 0 |
| Mode M9 | |||
|---|---|---|---|
| Quadrant | BADHDUFLAG | Total packets | Discarded packets |
| A | 0 | 10 | 0 |
| B | 0 | 10 | 0 |
| C | 0 | 10 | 0 |
| D | 0 | 10 | 0 |
| Mode M0 | |||
|---|---|---|---|
| Quadrant | BADHDUFLAG | Total packets | Discarded packets |
| A | 0 | 12555 | 1 |
| B | 0 | 12838 | 1 |
| C | 0 | 12498 | 1 |
| D | 0 | 13303 | 1 |
| Quadrant | Total seconds | Saturated seconds | Saturation percentage |
|---|---|---|---|
| A | 6137 | 19 | 0.309598% |
| B | 6137 | 27 | 0.439954% |
| C | 6138 | 34 | 0.553926% |
| D | 6138 | 24 | 0.391007% |
Noise dominated data is calculated using 1-second bins in cleaned event files. If a bin has >2000 counts, and if more than 50% of those come from <1% of pixels, then it is considered to be noise-dominated and hence unusable.
| Quadrant | # 1 sec bins | Bins with >0 counts | Bins with >2000 counts | High rate bins dominated by noise | Noise dominated (total time) | Noise dominated (detector-on time) | Marked lightcurve |
|---|---|---|---|---|---|---|---|
| A | 7177 | 6138 | 2 | 2 | 0.03% | 0.03% | 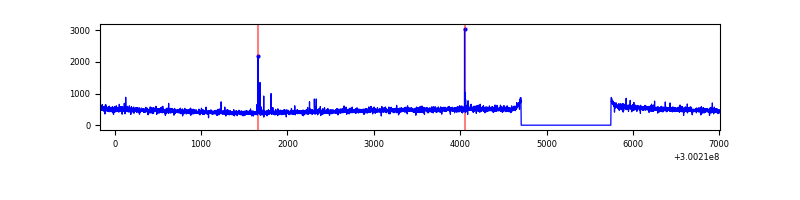 |
| B | 7177 | 6138 | 2 | 2 | 0.03% | 0.03% | 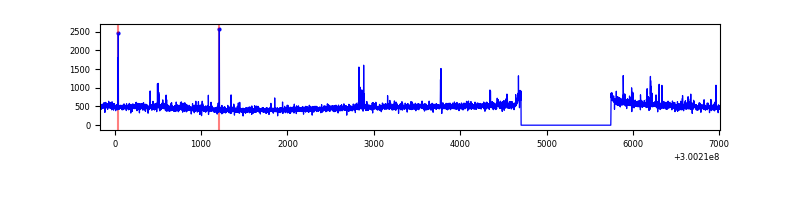 |
| C | 7178 | 6139 | 0 | 0 | 0.00% | 0.00% | 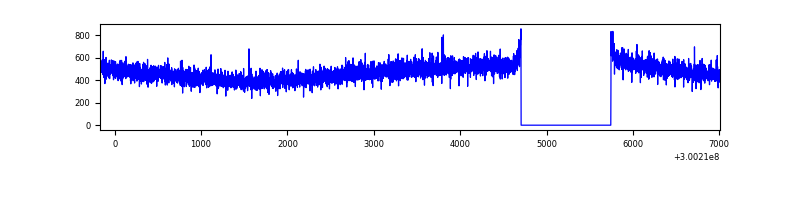 |
| D | 7178 | 6139 | 18 | 18 | 0.25% | 0.29% | 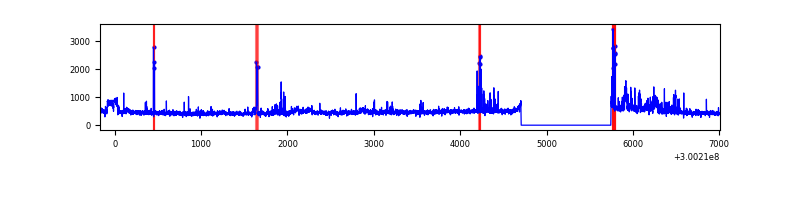 |
Top three noisy pixels from each quadrant. If the there are fewer than three noisy pixels in the level2.evt file, extra rows are filled as -1
| Pixel properties | Quadrant properties | ||||||
|---|---|---|---|---|---|---|---|
| Quadrant | DetID | PixID | Counts | Sigma | Mean | Median | Sigma |
| A | 5 | 16 | 17781 | 113.36 | 745 | 729 | 150.4 |
| A | 3 | 137 | 6532 | 38.58 | 745 | 729 | 150.4 |
| A | 0 | 226 | 6422 | 37.85 | 745 | 729 | 150.4 |
| B | 0 | 189 | 46054 | 319.25 | 739 | 721 | 142.0 |
| B | 10 | 245 | 28251 | 193.88 | 739 | 721 | 142.0 |
| B | 12 | 111 | 17311 | 116.83 | 739 | 721 | 142.0 |
| C | 14 | 238 | 110752 | 664.37 | 704 | 709 | 165.6 |
| C | 7 | 220 | 6380 | 34.24 | 704 | 709 | 165.6 |
| C | 13 | 61 | 4889 | 25.24 | 704 | 709 | 165.6 |
| D | 1 | 52 | 367950 | 2118.46 | 715 | 693 | 173.4 |
| D | 2 | 165 | 28654 | 161.29 | 715 | 693 | 173.4 |
| D | 2 | 234 | 25234 | 141.56 | 715 | 693 | 173.4 |
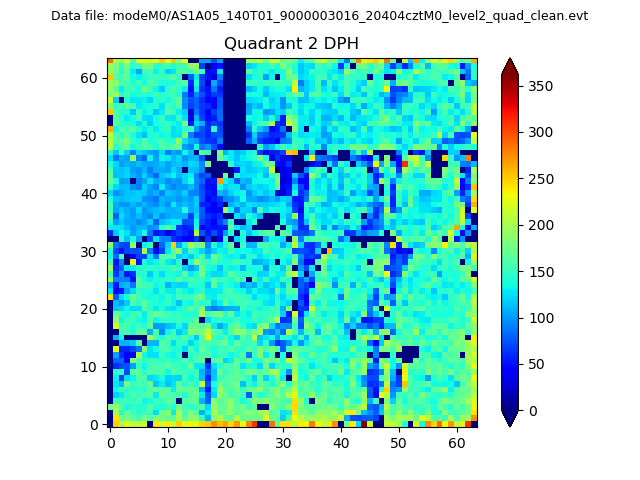
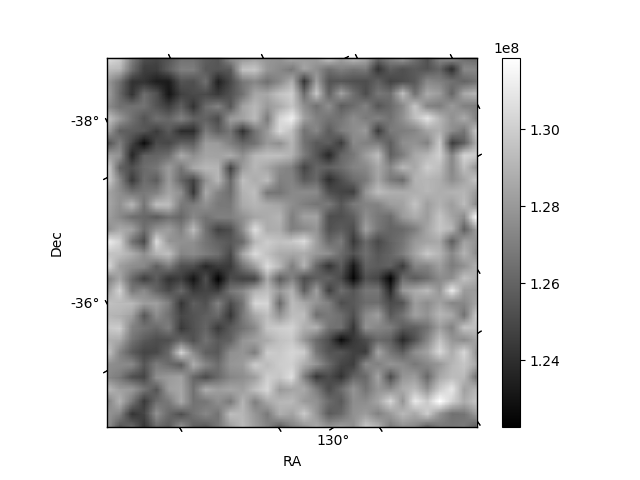
Histogram calculated using DETX and DETY for each event in the final _common_clean file
| Quadrant A | 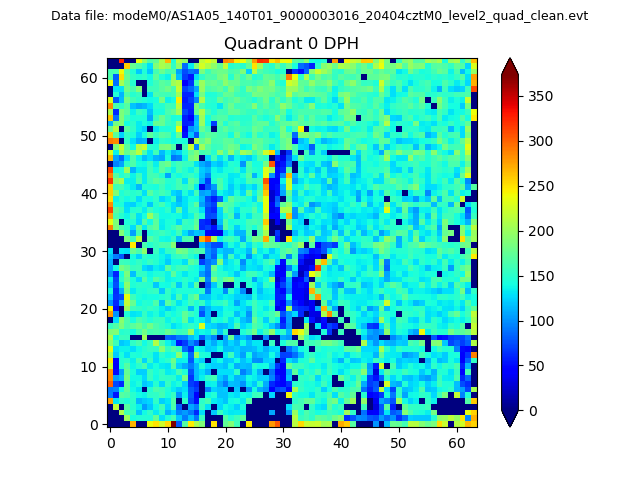 |
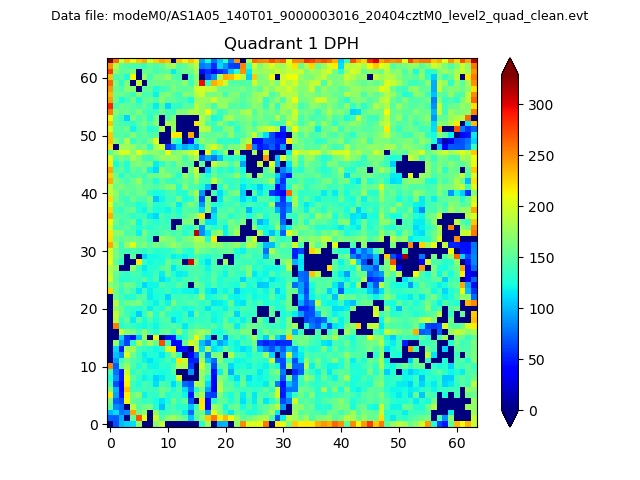 |
Quadrant B |
|---|---|---|---|
| Quadrant D | 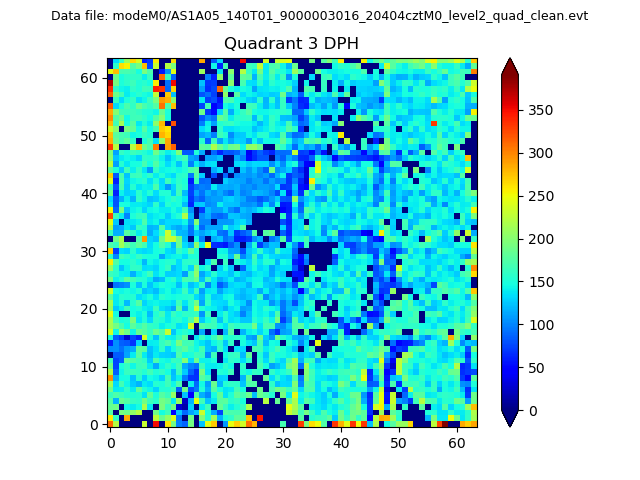 |
 |
Quadrant C |
| Plot type | Count rate plots | Images |
|---|---|---|
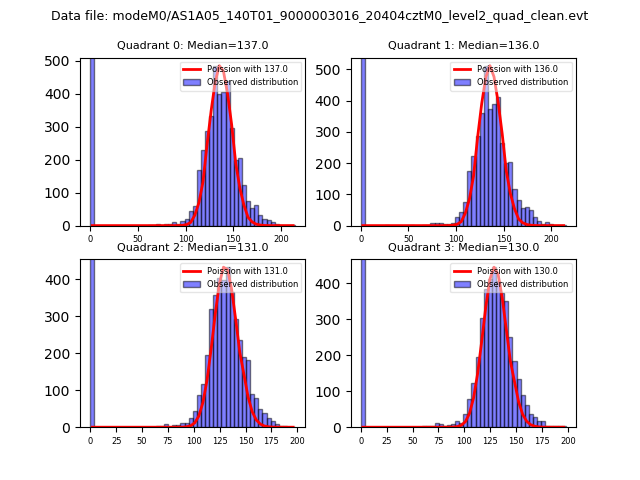
| Comparison with Poisson distribution Blue bars denote a histogram of data divided into 1 sec bins. Red curve is a Poisson curve with rate = median count rate of data. |
 |
 |
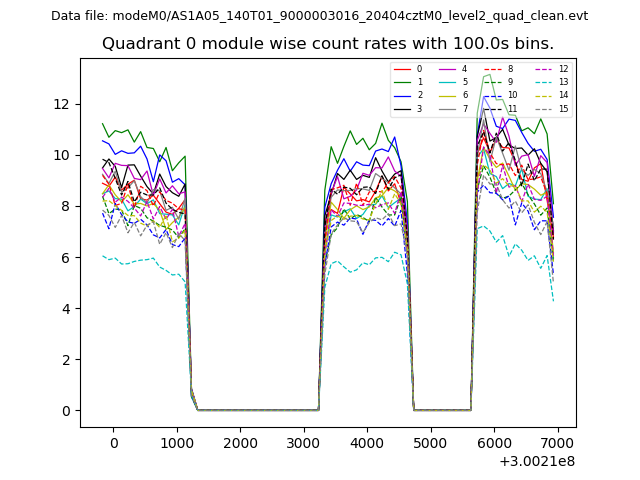
| Quadrant-wise count rates Data is divided into 100 sec bins |
 |
|
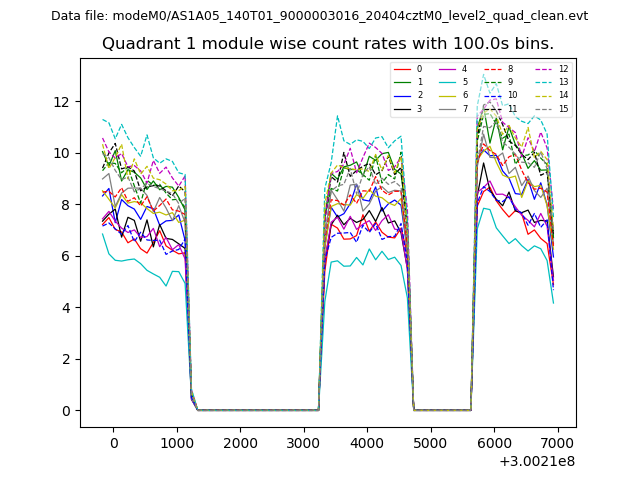
| Module-wise count rates for Quadrant A Data is divided into 100 sec bins |
 |
 |
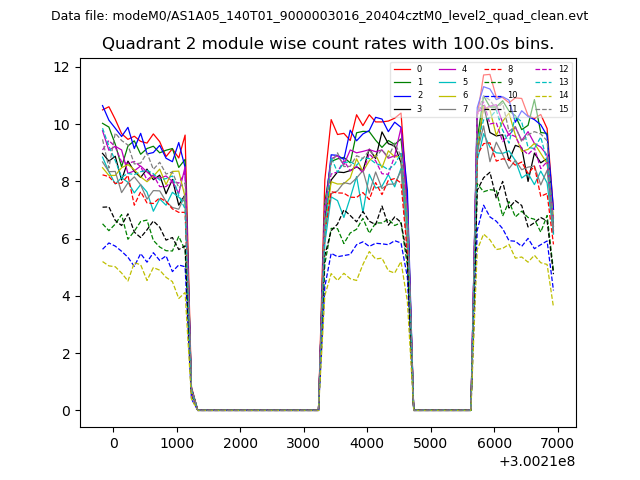
| Module-wise count rates for Quadrant B Data is divided into 100 sec bins |
 |
 |
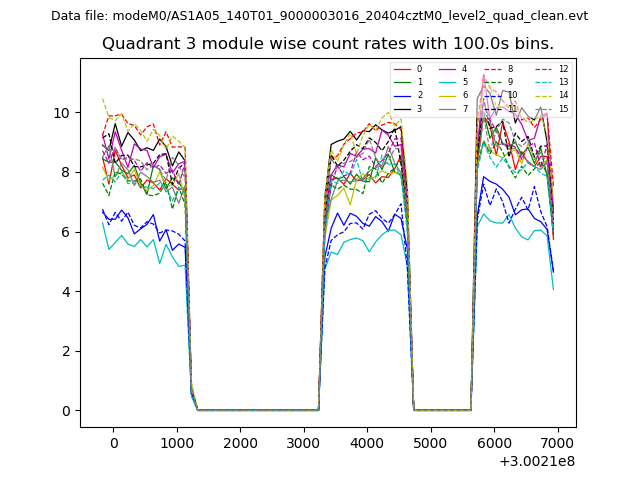
| Module-wise count rates for Quadrant C Data is divided into 100 sec bins |
 |
 |
| Module-wise count rates for Quadrant D Data is divided into 100 sec bins |
 |
 |
| Parameter | Plot |
|---|---|
| CZT HV Monitor | 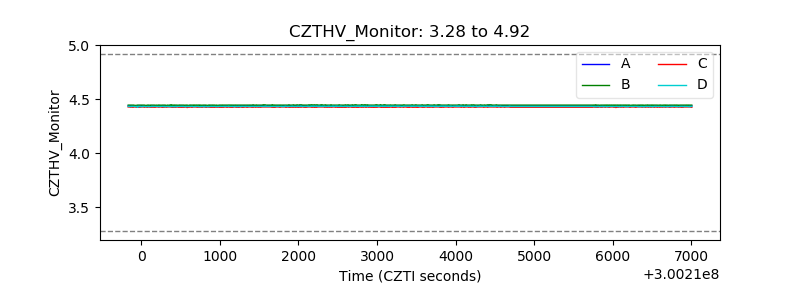 |
| D_VDD | 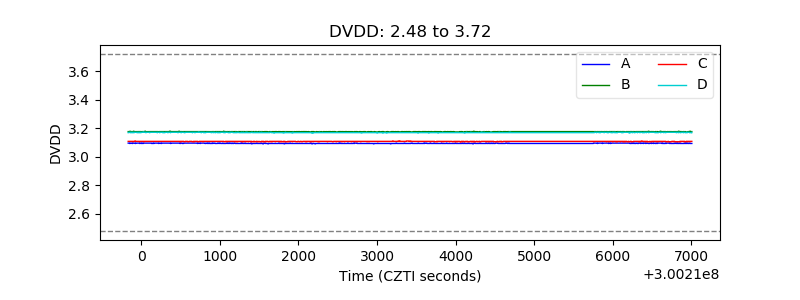 |
| Temperature 1 | 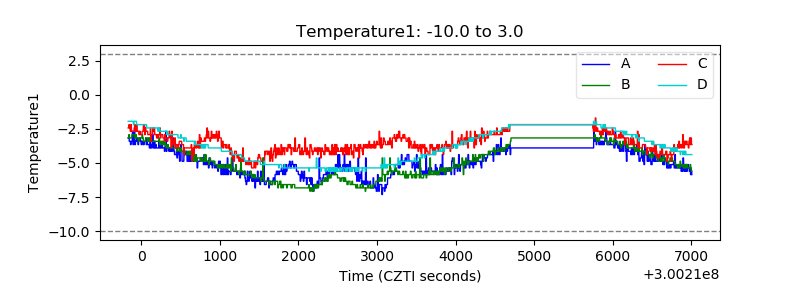 |
| Veto HV Monitor |  |
| Veto LLD | 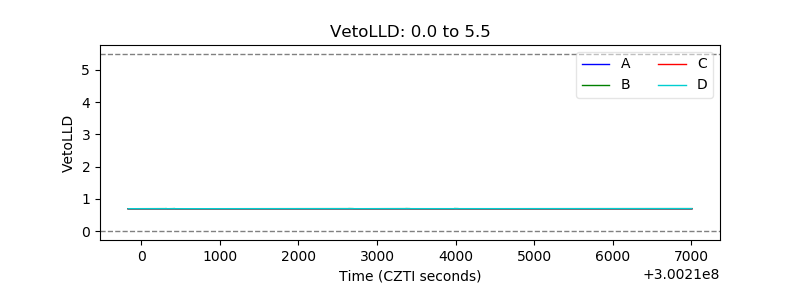 |
| Alpha Counter | 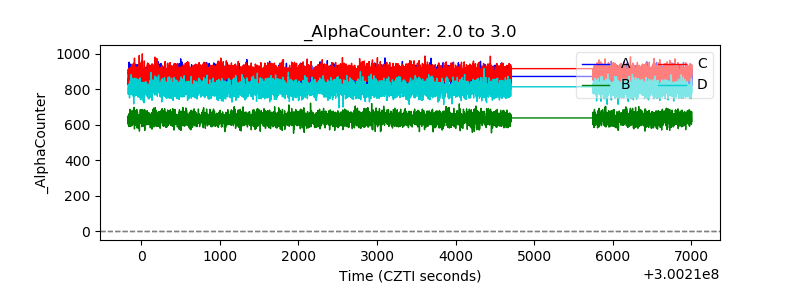 |
| _CPM_Rate | 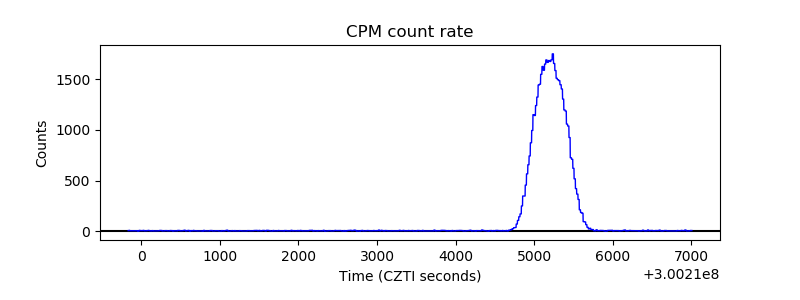 |
| CZT Counter | 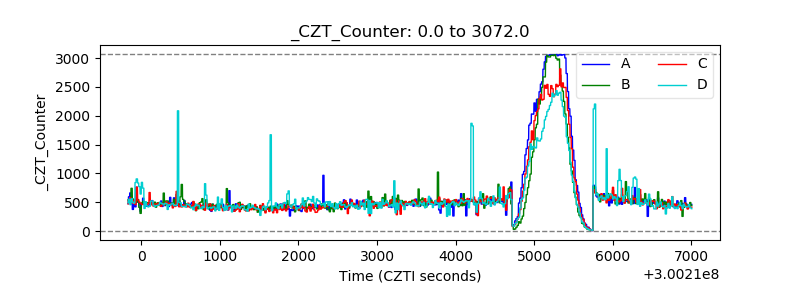 |
| +2.5 Volts monitor | 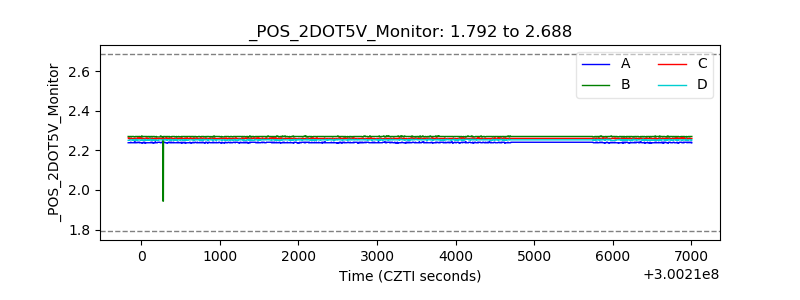 |
| +5 Volts monitor |  |
| _ROLL_ROT | 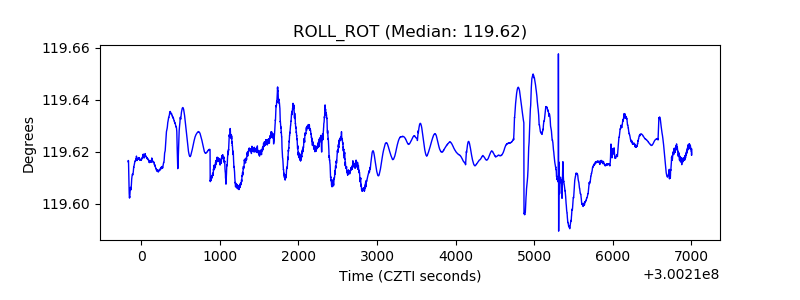 |
| _Roll_DEC | 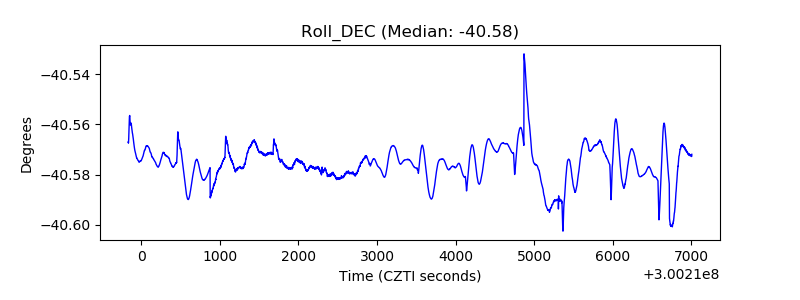 |
| _Roll_RA | 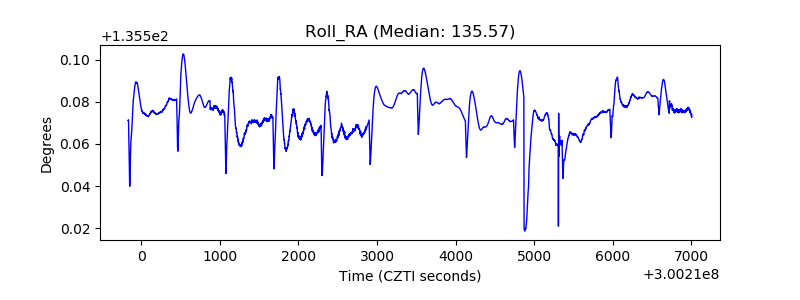 |
| Veto Counter | 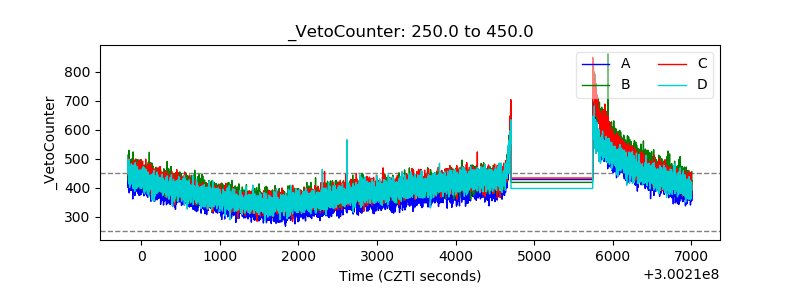 |