| Param | Original file | Final file |
|---|---|---|
| Filename | modeM0/AS1A05_140T01_9000003016_20406cztM0_level2.evt | modeM0/AS1A05_140T01_9000003016_20406cztM0_level2_quad_clean.evt |
| Size (bytes) | 429,629,760 | 85,541,760 |
| Size | 409.7 MB | 81.6 MB |
| Events in quadrant A | 3,066,737 | 551,499 |
| Events in quadrant B | 3,233,655 | 557,114 |
| Events in quadrant C | 3,011,329 | 527,666 |
| Events in quadrant D | 3,277,985 | 521,068 |
| Mode SS | |||
|---|---|---|---|
| Quadrant | BADHDUFLAG | Total packets | Discarded packets |
| A | 0 | 124 | 0 |
| B | 0 | 124 | 0 |
| C | 0 | 124 | 0 |
| D | 0 | 124 | 0 |
| Mode M9 | |||
|---|---|---|---|
| Quadrant | BADHDUFLAG | Total packets | Discarded packets |
| A | 0 | 12 | 0 |
| B | 0 | 12 | 0 |
| C | 0 | 12 | 0 |
| D | 0 | 12 | 0 |
| Mode M0 | |||
|---|---|---|---|
| Quadrant | BADHDUFLAG | Total packets | Discarded packets |
| A | 0 | 13060 | 1 |
| B | 0 | 13537 | 1 |
| C | 0 | 12830 | 1 |
| D | 0 | 13967 | 1 |
| Quadrant | Total seconds | Saturated seconds | Saturation percentage |
|---|---|---|---|
| A | 6211 | 9 | 0.144904% |
| B | 6211 | 28 | 0.450813% |
| C | 6211 | 40 | 0.644019% |
| D | 6211 | 43 | 0.692320% |
Noise dominated data is calculated using 1-second bins in cleaned event files. If a bin has >2000 counts, and if more than 50% of those come from <1% of pixels, then it is considered to be noise-dominated and hence unusable.
| Quadrant | # 1 sec bins | Bins with >0 counts | Bins with >2000 counts | High rate bins dominated by noise | Noise dominated (total time) | Noise dominated (detector-on time) | Marked lightcurve |
|---|---|---|---|---|---|---|---|
| A | 7381 | 6212 | 0 | 0 | 0.00% | 0.00% | 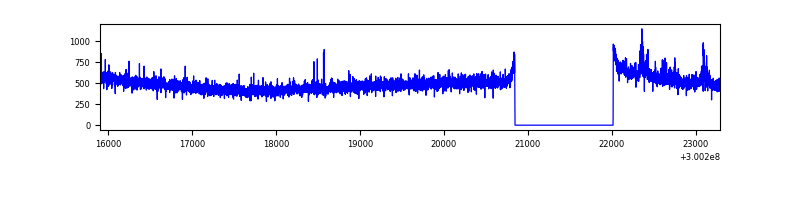 |
| B | 7381 | 6211 | 5 | 5 | 0.07% | 0.08% | 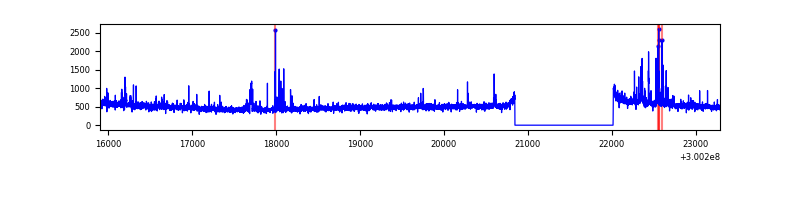 |
| C | 7381 | 6212 | 0 | 0 | 0.00% | 0.00% | 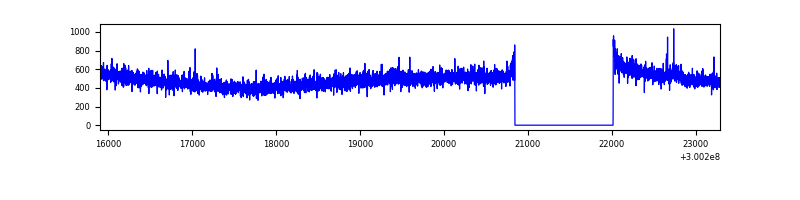 |
| D | 7381 | 6212 | 30 | 30 | 0.41% | 0.48% | 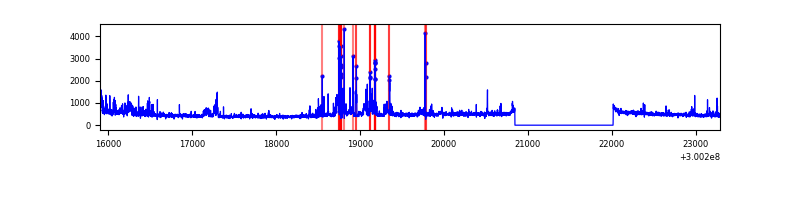 |
Top three noisy pixels from each quadrant. If the there are fewer than three noisy pixels in the level2.evt file, extra rows are filled as -1
| Pixel properties | Quadrant properties | ||||||
|---|---|---|---|---|---|---|---|
| Quadrant | DetID | PixID | Counts | Sigma | Mean | Median | Sigma |
| A | 12 | 16 | 43780 | 273.36 | 782 | 767 | 157.3 |
| A | 12 | 194 | 12213 | 72.74 | 782 | 767 | 157.3 |
| A | 0 | 226 | 6929 | 39.16 | 782 | 767 | 157.3 |
| B | 10 | 245 | 70325 | 474.9 | 778 | 759 | 146.5 |
| B | 0 | 189 | 41674 | 279.31 | 778 | 759 | 146.5 |
| B | 0 | 197 | 40105 | 268.6 | 778 | 759 | 146.5 |
| C | 14 | 238 | 117171 | 683.73 | 737 | 743 | 170.3 |
| C | 3 | 233 | 10827 | 59.22 | 737 | 743 | 170.3 |
| C | 7 | 220 | 6220 | 32.16 | 737 | 743 | 170.3 |
| D | 1 | 52 | 362580 | 2012.47 | 745 | 726 | 179.8 |
| D | 2 | 165 | 59429 | 326.48 | 745 | 726 | 179.8 |
| D | 13 | 153 | 32393 | 176.12 | 745 | 726 | 179.8 |
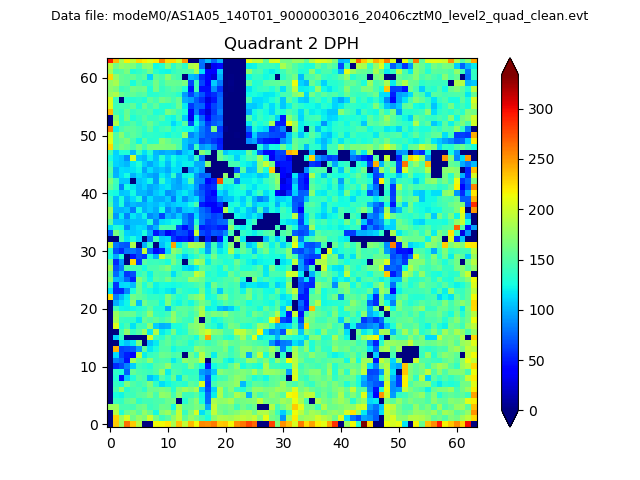
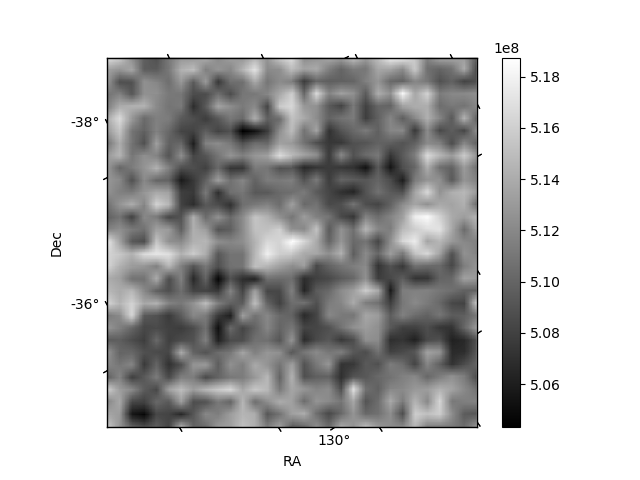
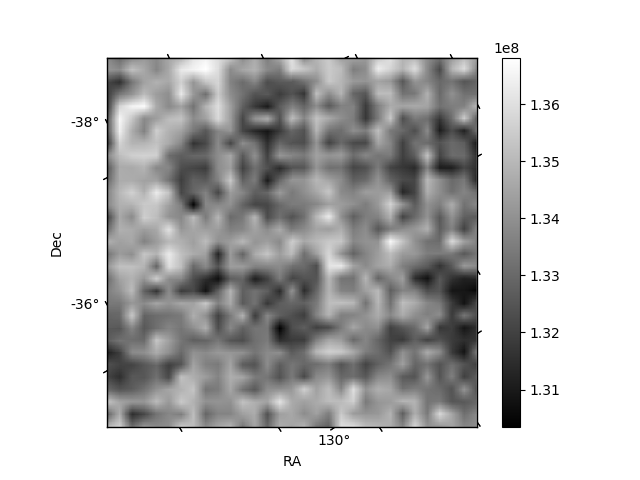
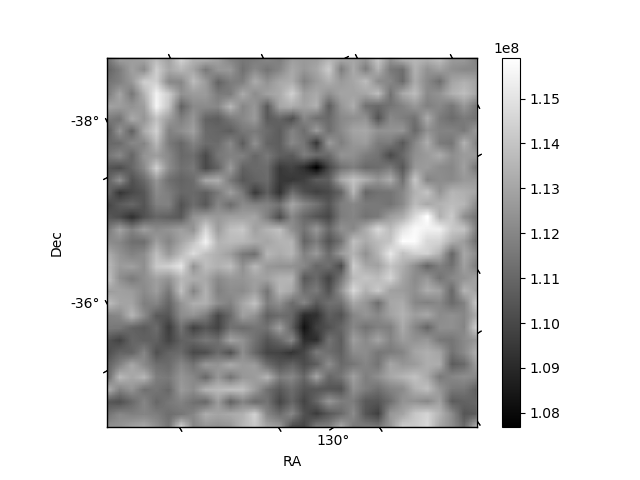
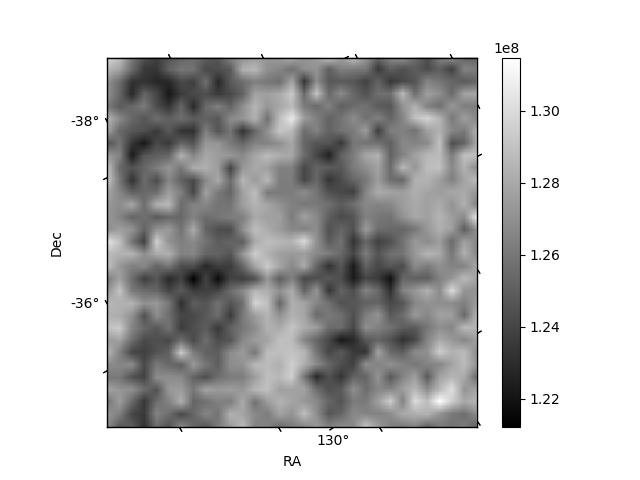
Histogram calculated using DETX and DETY for each event in the final _common_clean file
| Quadrant A | 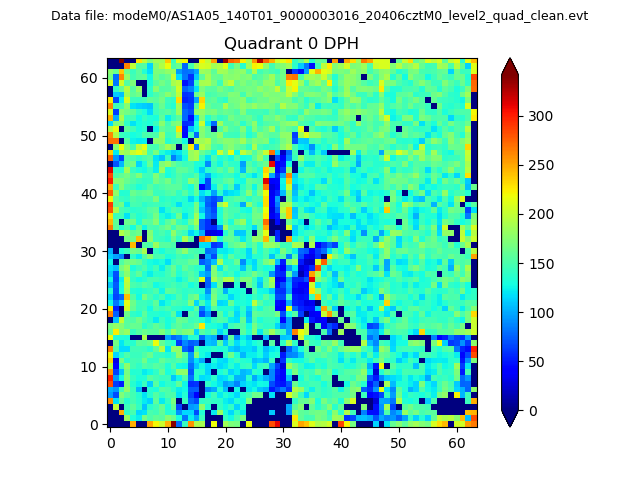 |
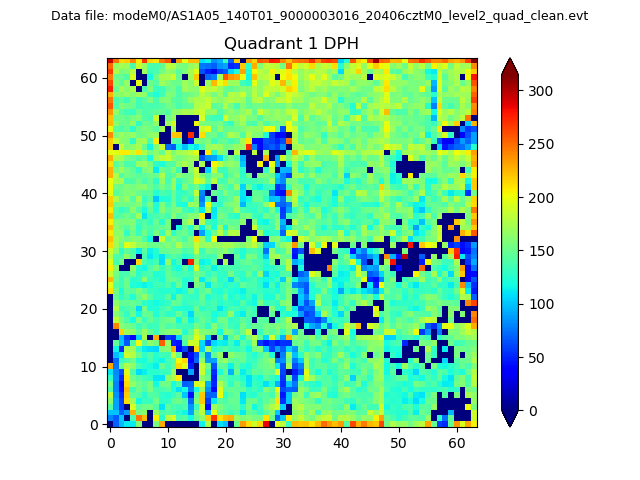 |
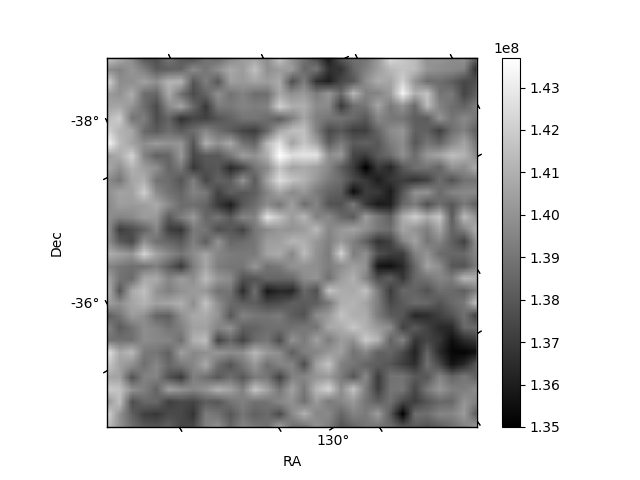
Quadrant B |
|---|---|---|---|
| Quadrant D | 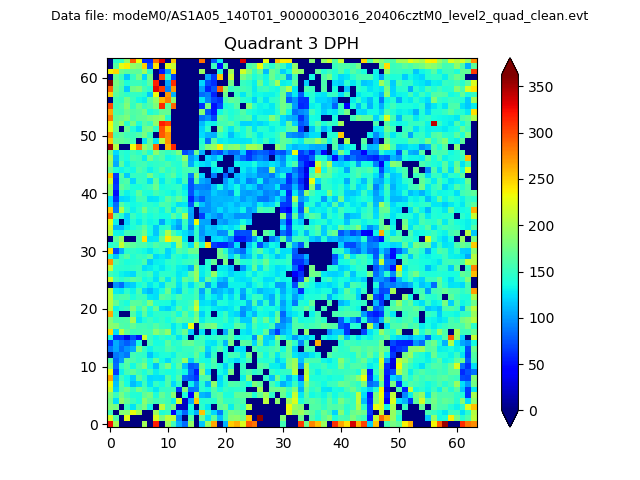 |
 |
Quadrant C |
| Plot type | Count rate plots | Images |
|---|---|---|
| Comparison with Poisson distribution Blue bars denote a histogram of data divided into 1 sec bins. Red curve is a Poisson curve with rate = median count rate of data. |
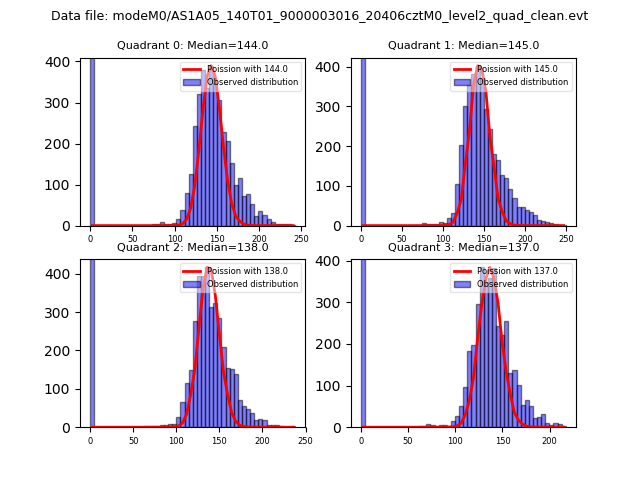 |
 |
| Quadrant-wise count rates Data is divided into 100 sec bins |
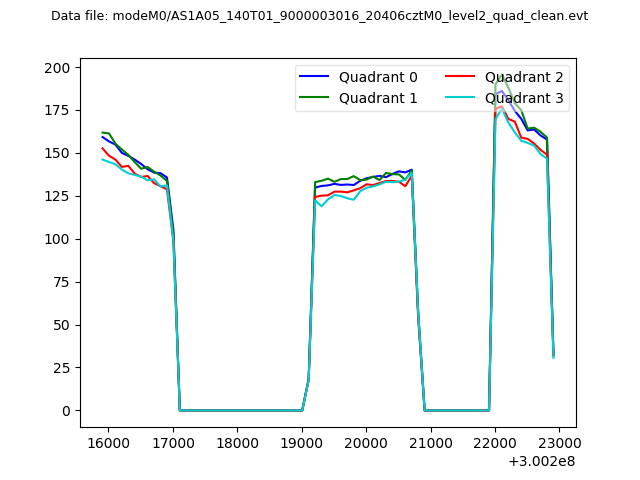 |
|
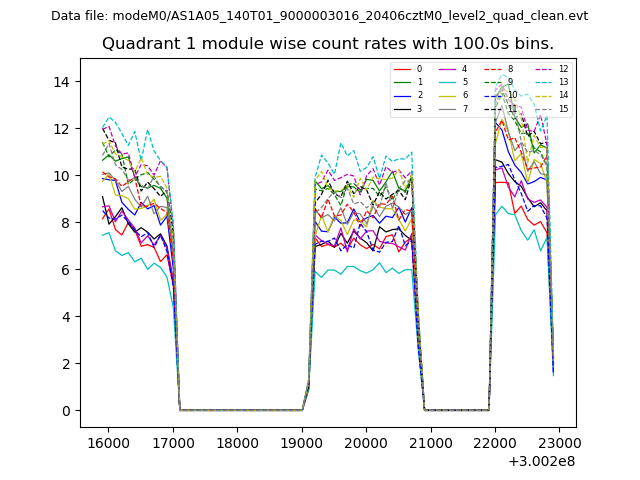
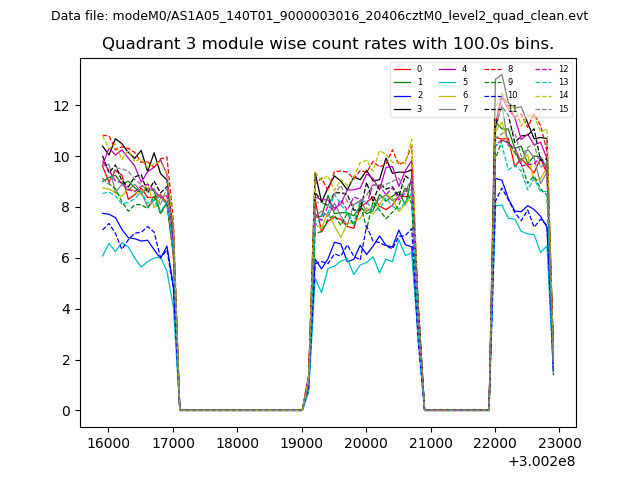
| Module-wise count rates for Quadrant A Data is divided into 100 sec bins |
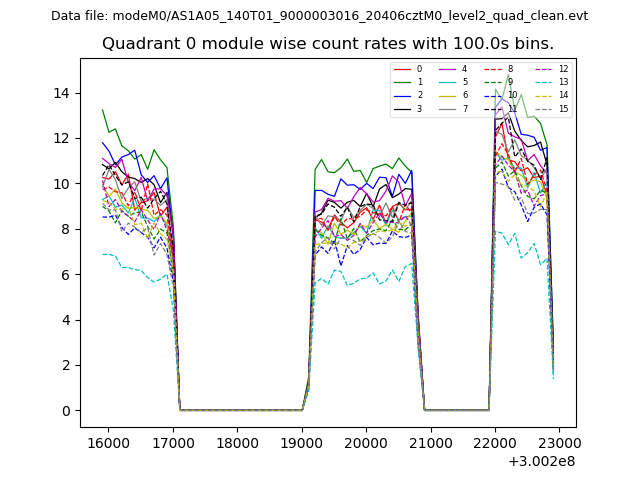 |
 |
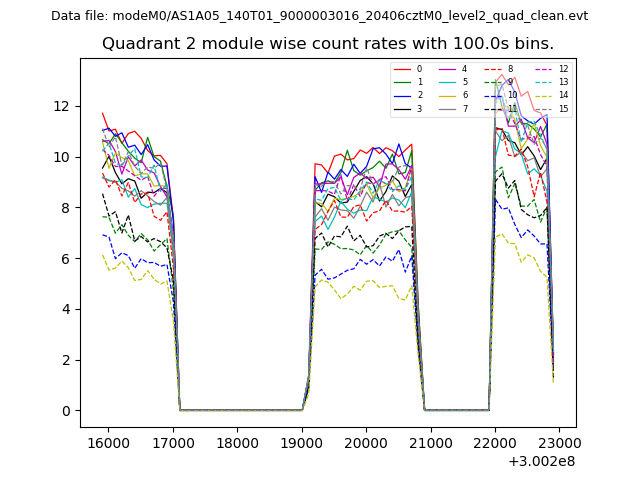
| Module-wise count rates for Quadrant B Data is divided into 100 sec bins |
 |
 |
| Module-wise count rates for Quadrant C Data is divided into 100 sec bins |
 |
 |
| Module-wise count rates for Quadrant D Data is divided into 100 sec bins |
 |
 |
| Parameter | Plot |
|---|---|
| CZT HV Monitor | 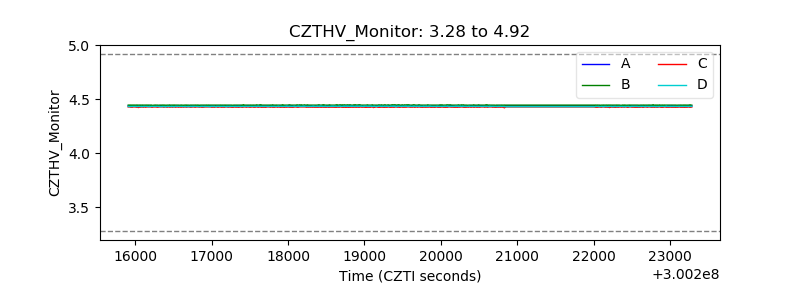 |
| D_VDD | 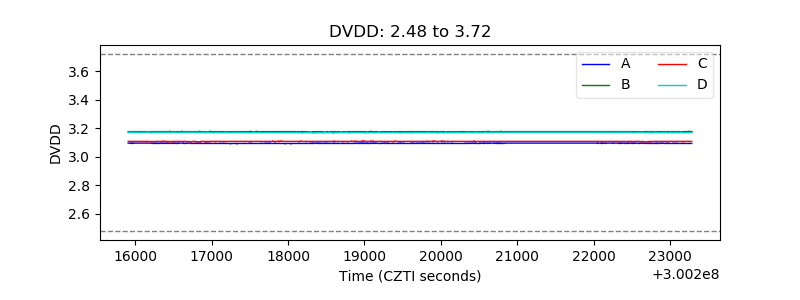 |
| Temperature 1 | 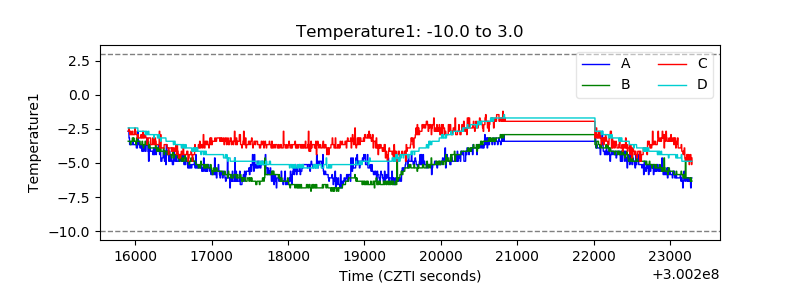 |
| Veto HV Monitor | 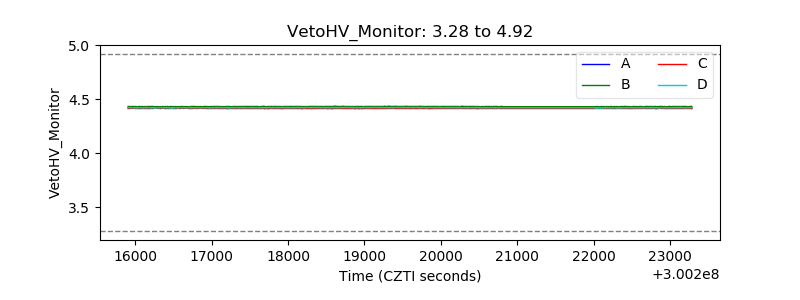 |
| Veto LLD | 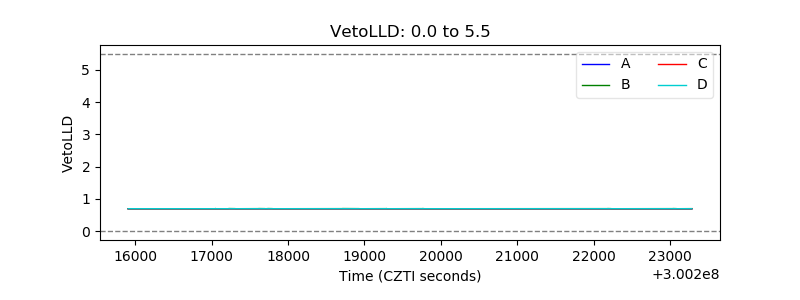 |
| Alpha Counter | 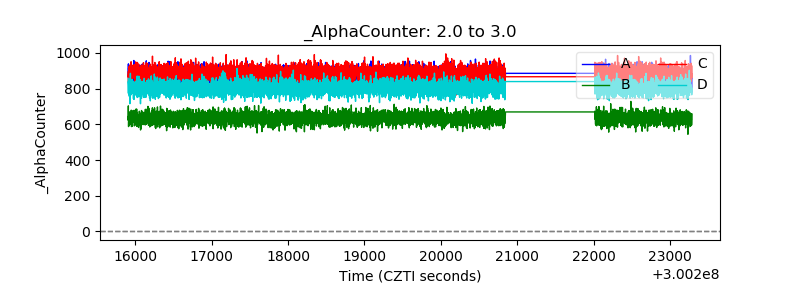 |
| _CPM_Rate |  |
| CZT Counter | 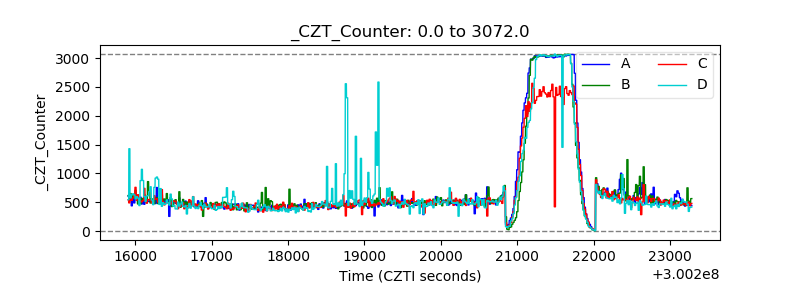 |
| +2.5 Volts monitor |  |
| +5 Volts monitor |  |
| _ROLL_ROT | 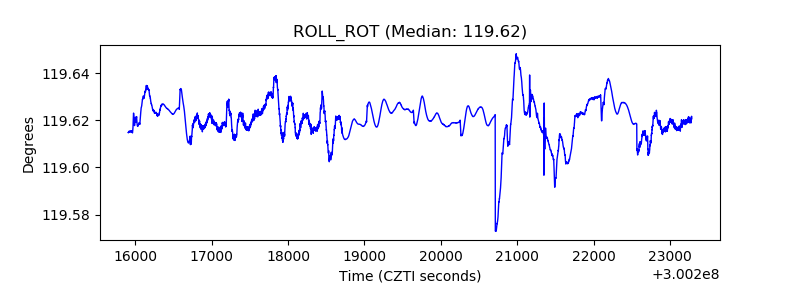 |
| _Roll_DEC | 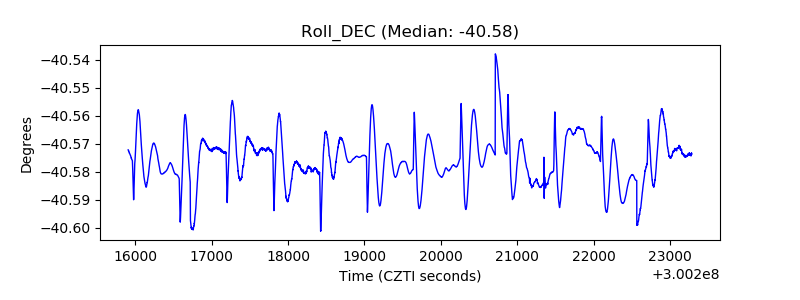 |
| _Roll_RA |  |
| Veto Counter | 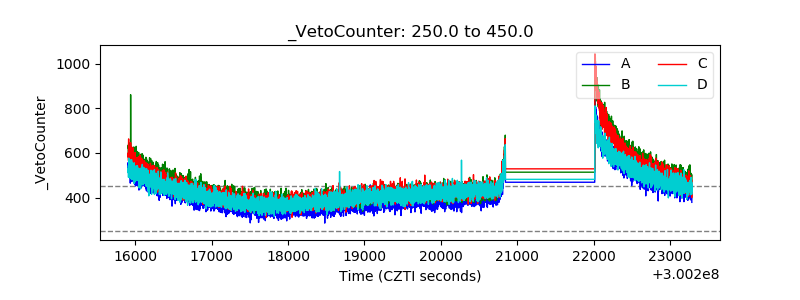 |