| Param | Original file | Final file |
|---|---|---|
| Filename | modeM0/AS1A05_140T01_9000003016_20407cztM0_level2.evt | modeM0/AS1A05_140T01_9000003016_20407cztM0_level2_quad_clean.evt |
| Size (bytes) | 441,279,360 | 82,569,600 |
| Size | 420.8 MB | 78.7 MB |
| Events in quadrant A | 3,215,945 | 529,208 |
| Events in quadrant B | 3,453,516 | 539,350 |
| Events in quadrant C | 3,146,271 | 506,625 |
| Events in quadrant D | 3,131,679 | 496,820 |
| Mode SS | |||
|---|---|---|---|
| Quadrant | BADHDUFLAG | Total packets | Discarded packets |
| A | 0 | 124 | 0 |
| B | 0 | 124 | 0 |
| C | 0 | 124 | 0 |
| D | 0 | 124 | 0 |
| Mode M9 | |||
|---|---|---|---|
| Quadrant | BADHDUFLAG | Total packets | Discarded packets |
| A | 0 | 13 | 0 |
| B | 0 | 14 | 0 |
| C | 0 | 14 | 0 |
| D | 0 | 14 | 0 |
| Mode M0 | |||
|---|---|---|---|
| Quadrant | BADHDUFLAG | Total packets | Discarded packets |
| A | 0 | 13371 | 2 |
| B | 0 | 14052 | 3 |
| C | 0 | 13043 | 2 |
| D | 0 | 13259 | 2 |
| Quadrant | Total seconds | Saturated seconds | Saturation percentage |
|---|---|---|---|
| A | 6139 | 14 | 0.228050% |
| B | 6138 | 40 | 0.651678% |
| C | 6138 | 52 | 0.847181% |
| D | 6138 | 23 | 0.374715% |
Noise dominated data is calculated using 1-second bins in cleaned event files. If a bin has >2000 counts, and if more than 50% of those come from <1% of pixels, then it is considered to be noise-dominated and hence unusable.
| Quadrant | # 1 sec bins | Bins with >0 counts | Bins with >2000 counts | High rate bins dominated by noise | Noise dominated (total time) | Noise dominated (detector-on time) | Marked lightcurve |
|---|---|---|---|---|---|---|---|
| A | 7425 | 6140 | 0 | 0 | 0.00% | 0.00% | 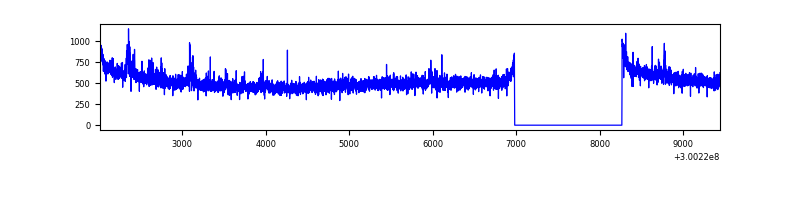 |
| B | 7424 | 6139 | 17 | 17 | 0.23% | 0.28% | 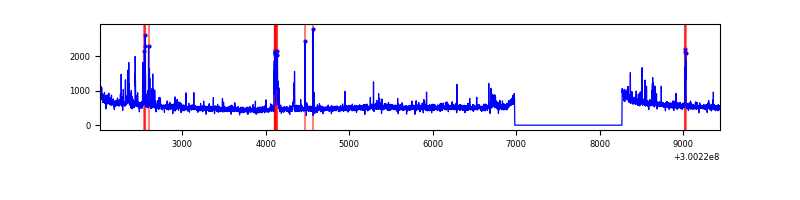 |
| C | 7424 | 6139 | 0 | 0 | 0.00% | 0.00% | 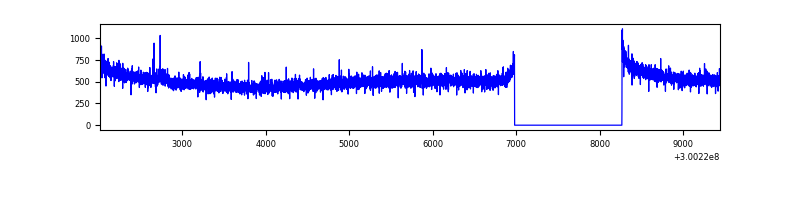 |
| D | 7424 | 6139 | 15 | 15 | 0.20% | 0.24% | 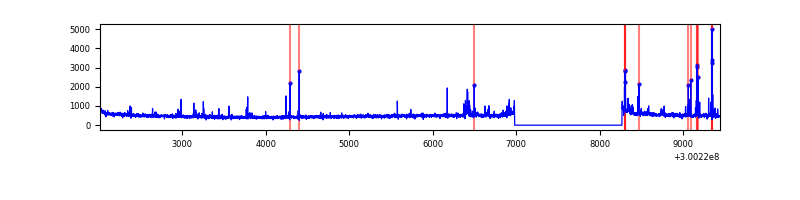 |
Top three noisy pixels from each quadrant. If the there are fewer than three noisy pixels in the level2.evt file, extra rows are filled as -1
| Pixel properties | Quadrant properties | ||||||
|---|---|---|---|---|---|---|---|
| Quadrant | DetID | PixID | Counts | Sigma | Mean | Median | Sigma |
| A | 12 | 16 | 70341 | 429.85 | 815 | 803 | 161.8 |
| A | 12 | 194 | 16434 | 96.62 | 815 | 803 | 161.8 |
| A | 0 | 226 | 7004 | 38.33 | 815 | 803 | 161.8 |
| B | 10 | 245 | 140596 | 919.41 | 813 | 795 | 152.1 |
| B | 0 | 197 | 44720 | 288.88 | 813 | 795 | 152.1 |
| B | 0 | 189 | 43024 | 277.72 | 813 | 795 | 152.1 |
| C | 14 | 238 | 124241 | 697.0 | 768 | 775 | 177.1 |
| C | 3 | 233 | 13401 | 71.28 | 768 | 775 | 177.1 |
| C | 7 | 220 | 7423 | 37.53 | 768 | 775 | 177.1 |
| D | 13 | 153 | 86807 | 464.89 | 773 | 755 | 185.1 |
| D | 1 | 52 | 65895 | 351.91 | 773 | 755 | 185.1 |
| D | 6 | 143 | 48213 | 256.39 | 773 | 755 | 185.1 |
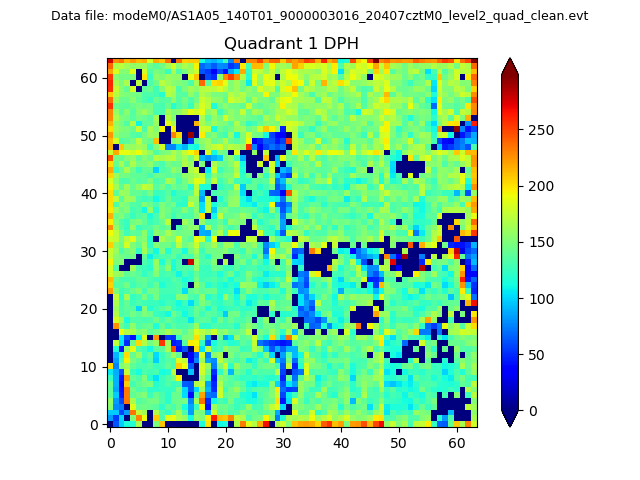
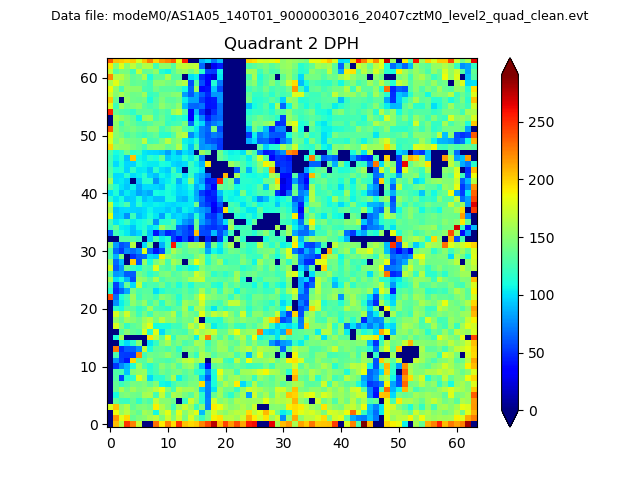
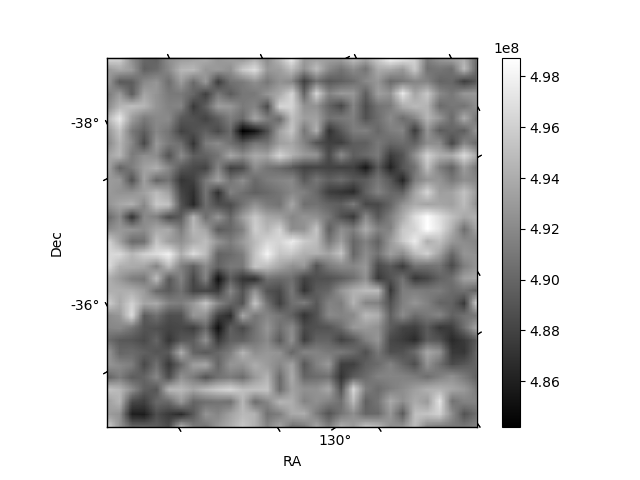
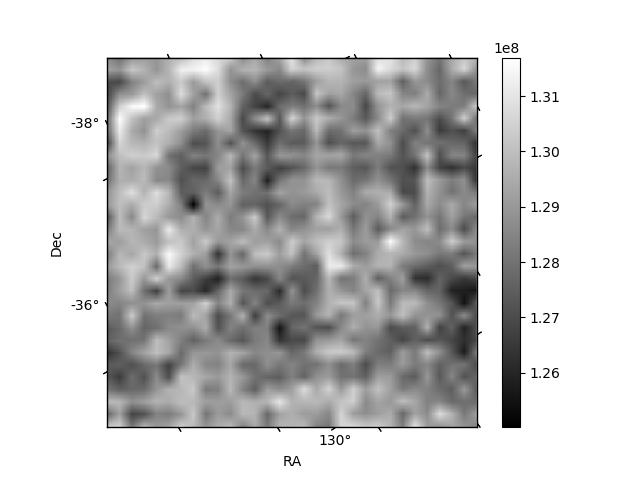
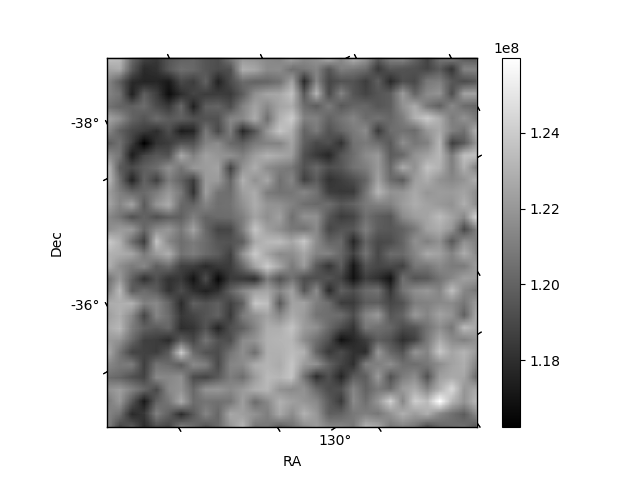
Histogram calculated using DETX and DETY for each event in the final _common_clean file
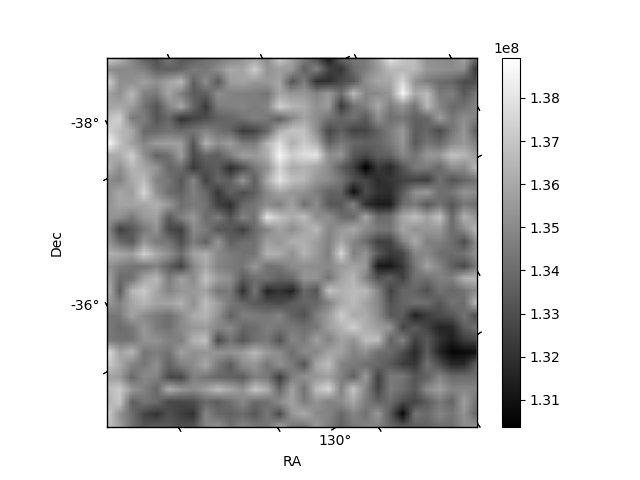
| Quadrant A |  |
 |
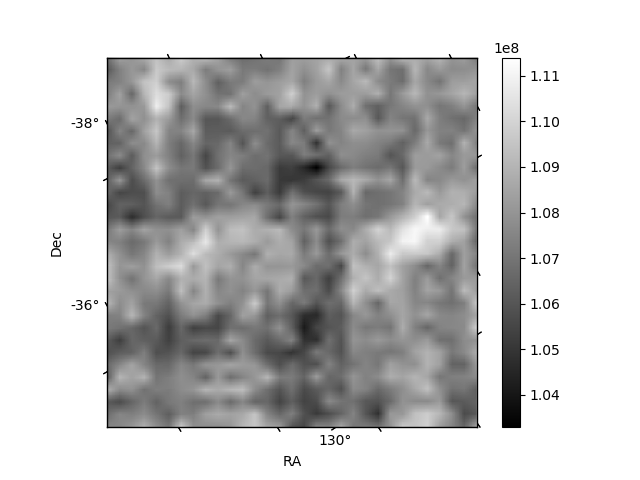
Quadrant B |
|---|---|---|---|
| Quadrant D | 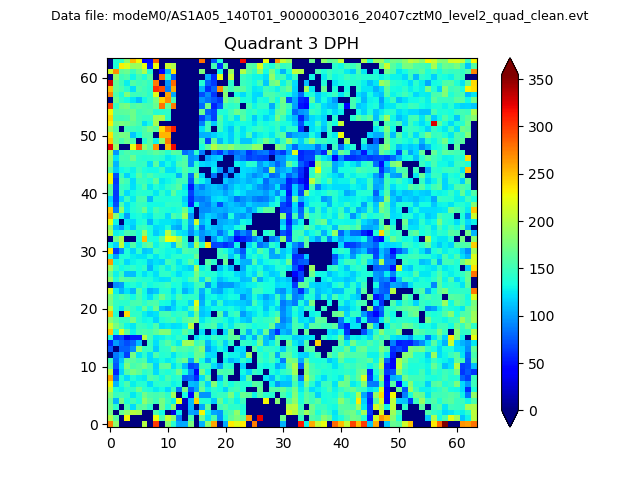 |
 |
Quadrant C |
| Plot type | Count rate plots | Images |
|---|---|---|
| Comparison with Poisson distribution Blue bars denote a histogram of data divided into 1 sec bins. Red curve is a Poisson curve with rate = median count rate of data. |
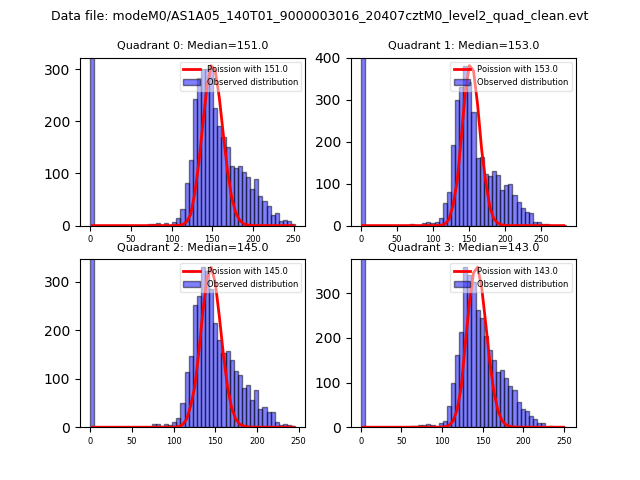 |
 |
| Quadrant-wise count rates Data is divided into 100 sec bins |
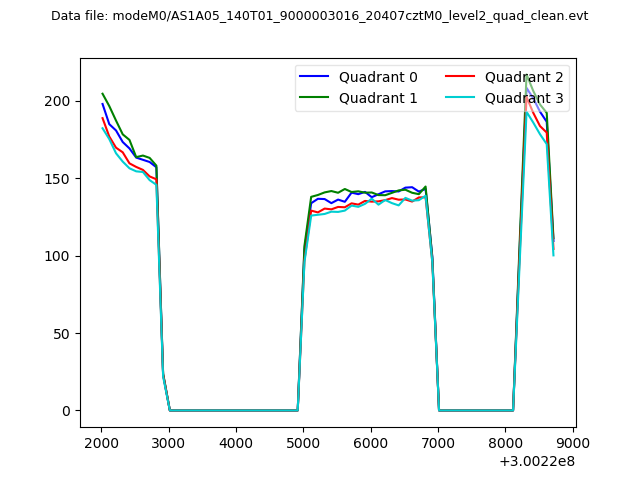 |
|
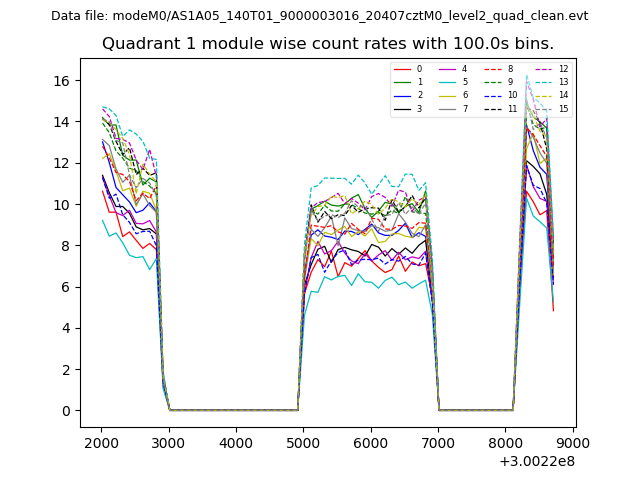
| Module-wise count rates for Quadrant A Data is divided into 100 sec bins |
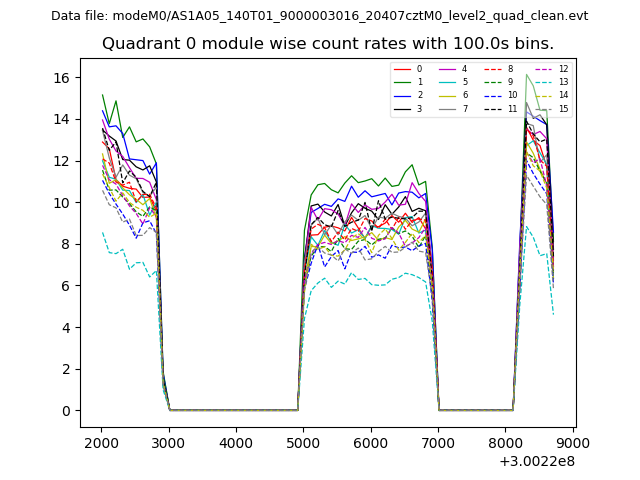 |
 |
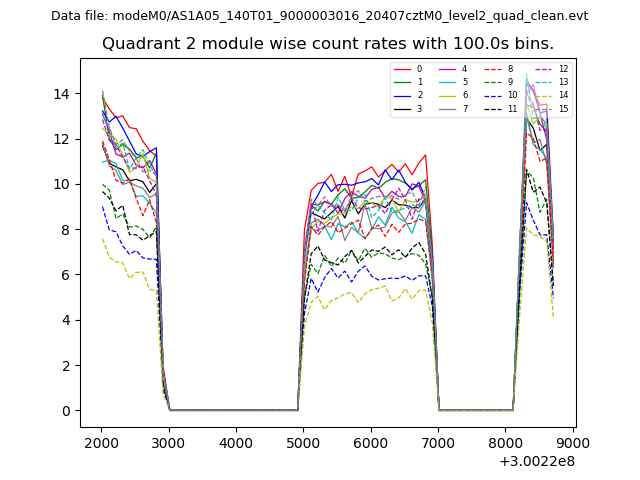
| Module-wise count rates for Quadrant B Data is divided into 100 sec bins |
 |
 |
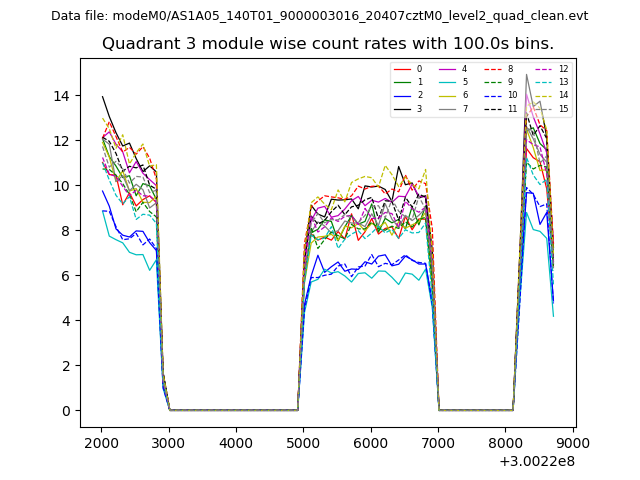
| Module-wise count rates for Quadrant C Data is divided into 100 sec bins |
 |
 |
| Module-wise count rates for Quadrant D Data is divided into 100 sec bins |
 |
 |
| Parameter | Plot |
|---|---|
| CZT HV Monitor | 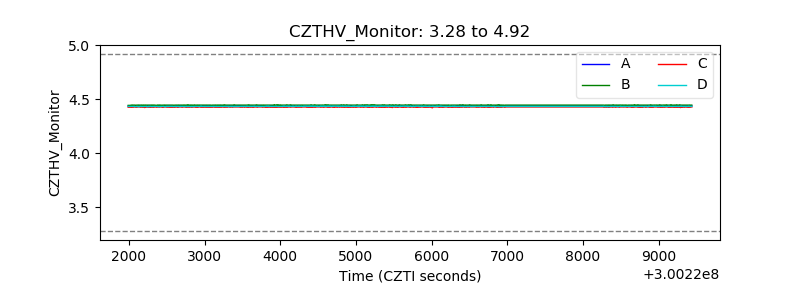 |
| D_VDD | 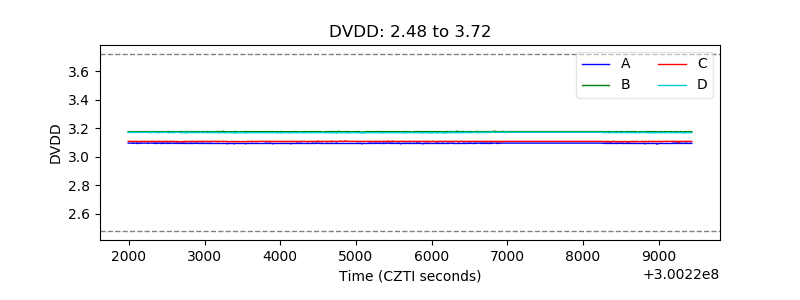 |
| Temperature 1 |  |
| Veto HV Monitor | 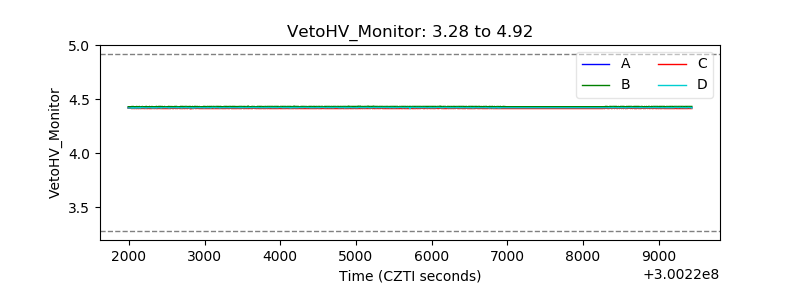 |
| Veto LLD | 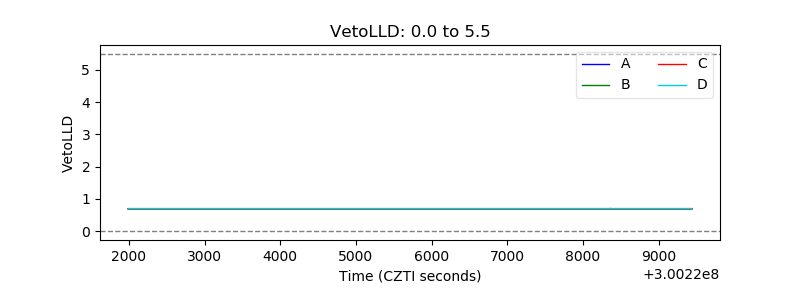 |
| Alpha Counter | 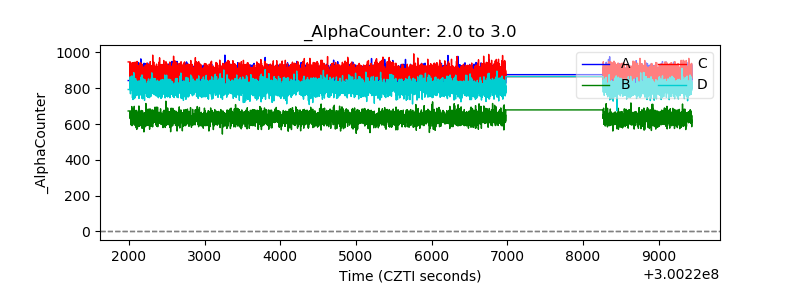 |
| _CPM_Rate | 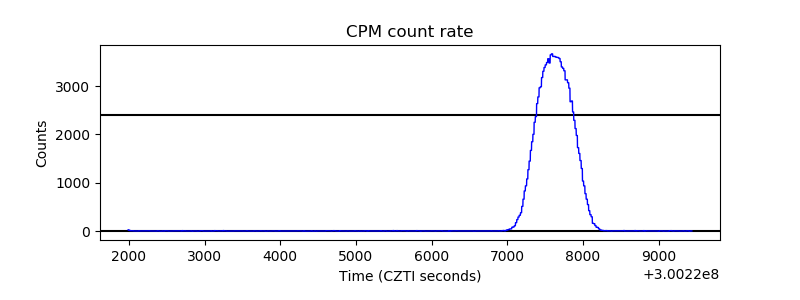 |
| CZT Counter | 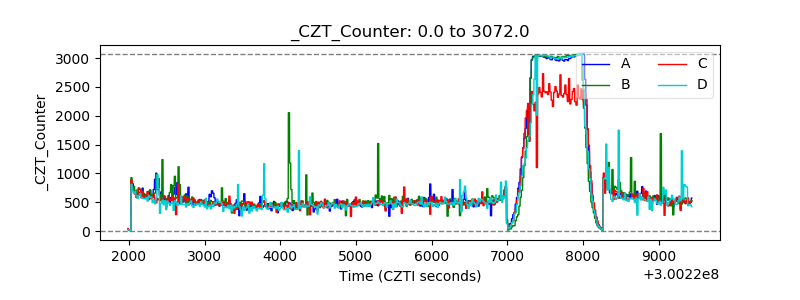 |
| +2.5 Volts monitor |  |
| +5 Volts monitor |  |
| _ROLL_ROT | 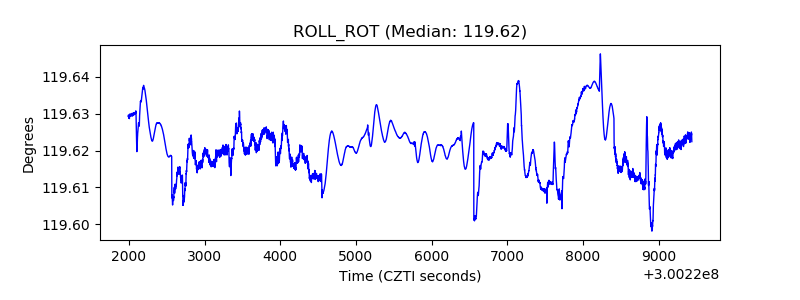 |
| _Roll_DEC | 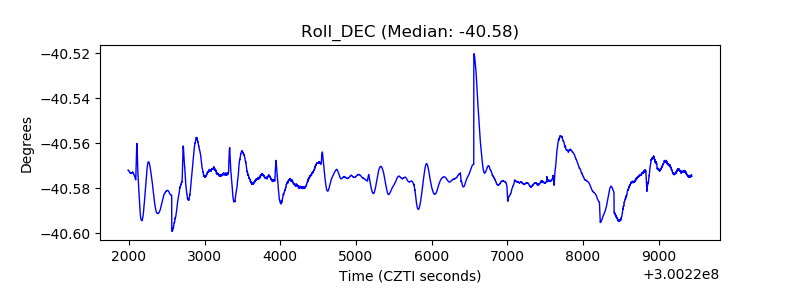 |
| _Roll_RA | 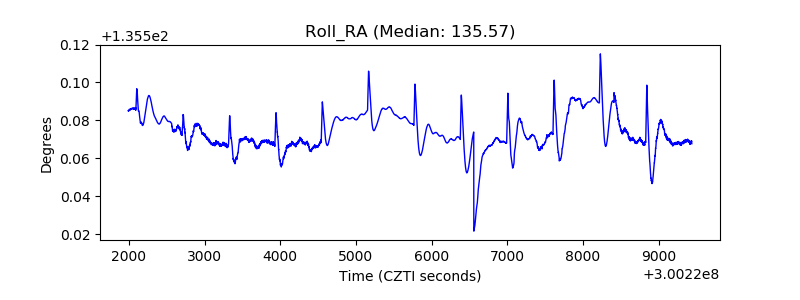 |
| Veto Counter | 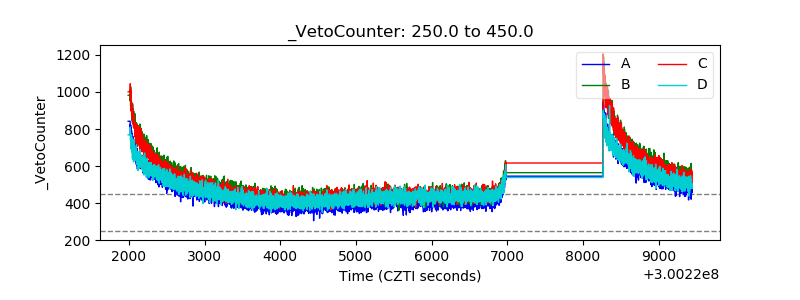 |