| Param | Original file | Final file |
|---|---|---|
| Filename | modeM0/AS1A05_140T01_9000003016_20409cztM0_level2.evt | modeM0/AS1A05_140T01_9000003016_20409cztM0_level2_quad_clean.evt |
| Size (bytes) | 451,307,520 | 68,832,000 |
| Size | 430.4 MB | 65.6 MB |
| Events in quadrant A | 3,302,814 | 421,891 |
| Events in quadrant B | 3,402,466 | 431,334 |
| Events in quadrant C | 3,341,702 | 405,669 |
| Events in quadrant D | 3,205,492 | 397,894 |
| Mode SS | |||
|---|---|---|---|
| Quadrant | BADHDUFLAG | Total packets | Discarded packets |
| A | 0 | 124 | 0 |
| B | 0 | 124 | 0 |
| C | 0 | 124 | 0 |
| D | 0 | 124 | 0 |
| Mode M9 | |||
|---|---|---|---|
| Quadrant | BADHDUFLAG | Total packets | Discarded packets |
| A | 0 | 18 | 0 |
| B | 0 | 19 | 0 |
| C | 0 | 19 | 0 |
| D | 0 | 19 | 0 |
| Mode M0 | |||
|---|---|---|---|
| Quadrant | BADHDUFLAG | Total packets | Discarded packets |
| A | 0 | 13263 | 2 |
| B | 0 | 13596 | 2 |
| C | 0 | 13347 | 2 |
| D | 0 | 13145 | 2 |
| Quadrant | Total seconds | Saturated seconds | Saturation percentage |
|---|---|---|---|
| A | 6120 | 22 | 0.359477% |
| B | 6120 | 46 | 0.751634% |
| C | 6120 | 61 | 0.996732% |
| D | 6120 | 5 | 0.081699% |
Noise dominated data is calculated using 1-second bins in cleaned event files. If a bin has >2000 counts, and if more than 50% of those come from <1% of pixels, then it is considered to be noise-dominated and hence unusable.
| Quadrant | # 1 sec bins | Bins with >0 counts | Bins with >2000 counts | High rate bins dominated by noise | Noise dominated (total time) | Noise dominated (detector-on time) | Marked lightcurve |
|---|---|---|---|---|---|---|---|
| A | 7555 | 6121 | 0 | 0 | 0.00% | 0.00% | 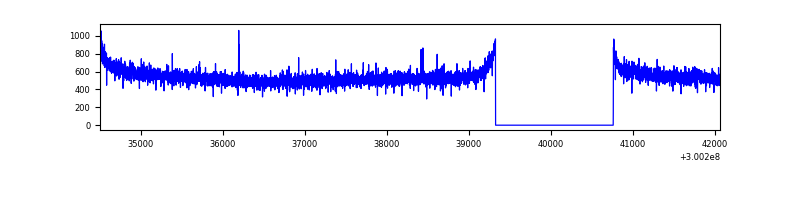 |
| B | 7555 | 6121 | 3 | 3 | 0.04% | 0.05% | 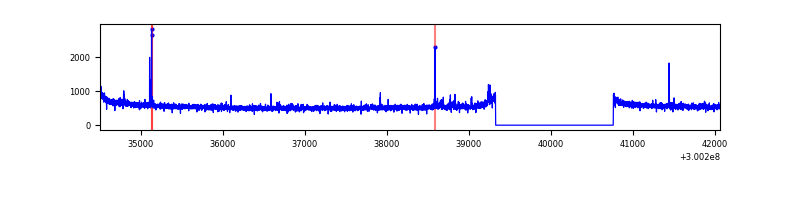 |
| C | 7555 | 6121 | 0 | 0 | 0.00% | 0.00% | 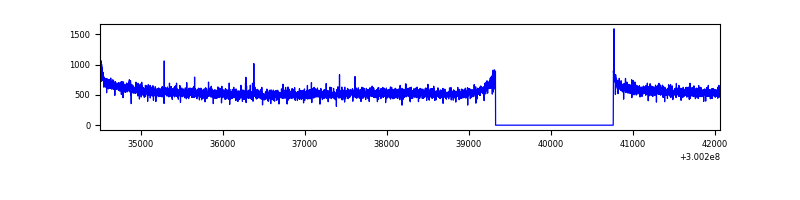 |
| D | 7555 | 6121 | 2 | 2 | 0.03% | 0.03% | 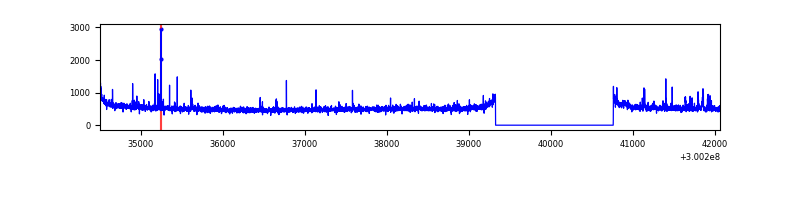 |
Top three noisy pixels from each quadrant. If the there are fewer than three noisy pixels in the level2.evt file, extra rows are filled as -1
| Pixel properties | Quadrant properties | ||||||
|---|---|---|---|---|---|---|---|
| Quadrant | DetID | PixID | Counts | Sigma | Mean | Median | Sigma |
| A | 5 | 16 | 7859 | 41.79 | 855 | 843 | 167.9 |
| A | 0 | 226 | 7498 | 39.64 | 855 | 843 | 167.9 |
| A | 3 | 137 | 6467 | 33.5 | 855 | 843 | 167.9 |
| B | 0 | 189 | 30116 | 186.35 | 856 | 840 | 157.1 |
| B | 0 | 230 | 22511 | 137.94 | 856 | 840 | 157.1 |
| B | 12 | 111 | 18247 | 110.8 | 856 | 840 | 157.1 |
| C | 14 | 238 | 132464 | 704.07 | 819 | 829 | 187.0 |
| C | 7 | 220 | 8737 | 42.3 | 819 | 829 | 187.0 |
| C | 9 | 221 | 6944 | 32.71 | 819 | 829 | 187.0 |
| D | 1 | 52 | 61100 | 311.42 | 821 | 802 | 193.6 |
| D | 13 | 153 | 42938 | 217.62 | 821 | 802 | 193.6 |
| D | 2 | 234 | 23166 | 115.5 | 821 | 802 | 193.6 |
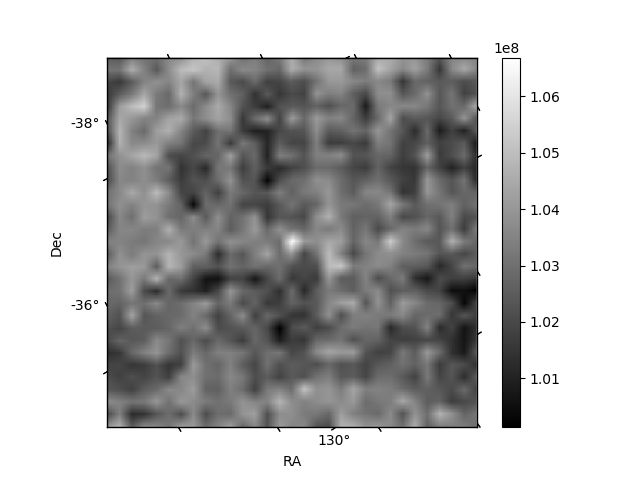
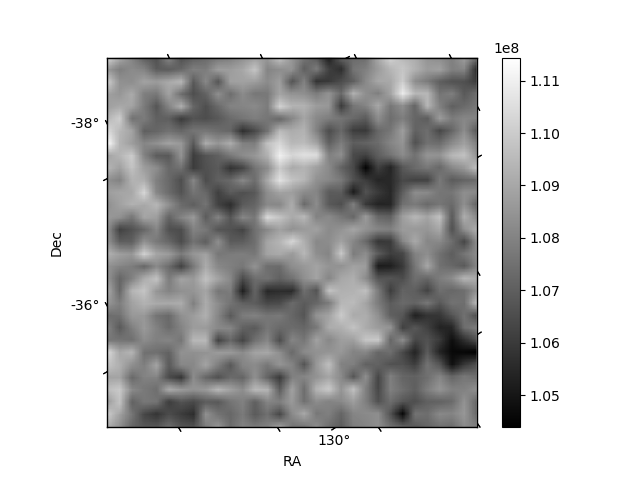
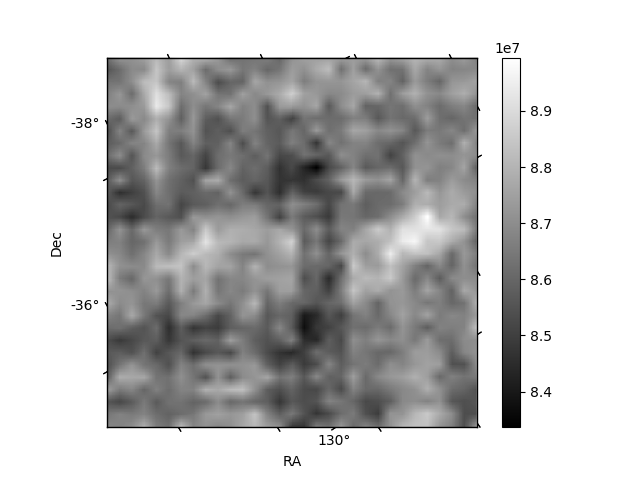
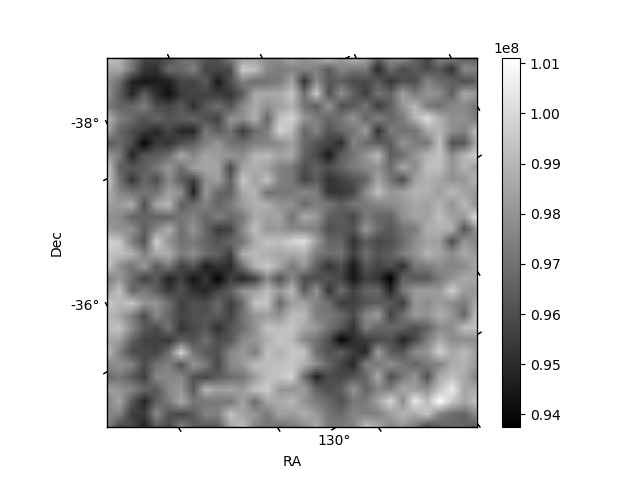
Histogram calculated using DETX and DETY for each event in the final _common_clean file
| Quadrant A |  |
 |
Quadrant B |
|---|---|---|---|
| Quadrant D | 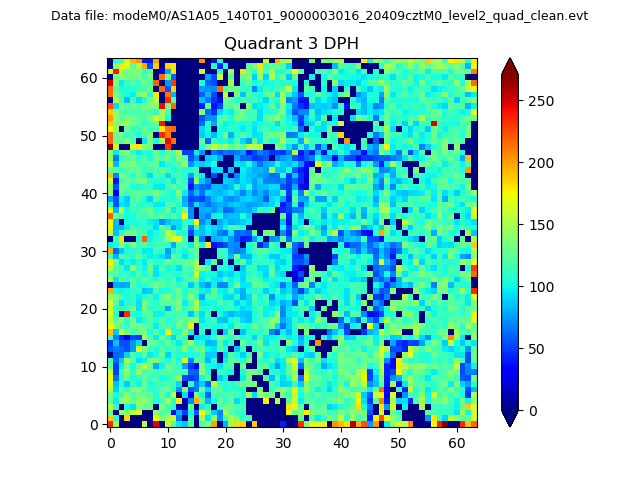 |
 |
Quadrant C |
| Plot type | Count rate plots | Images |
|---|---|---|
| Comparison with Poisson distribution Blue bars denote a histogram of data divided into 1 sec bins. Red curve is a Poisson curve with rate = median count rate of data. |
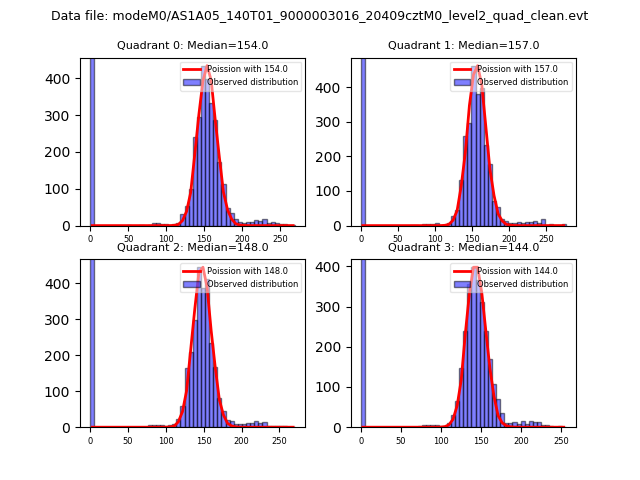 |
 |
| Quadrant-wise count rates Data is divided into 100 sec bins |
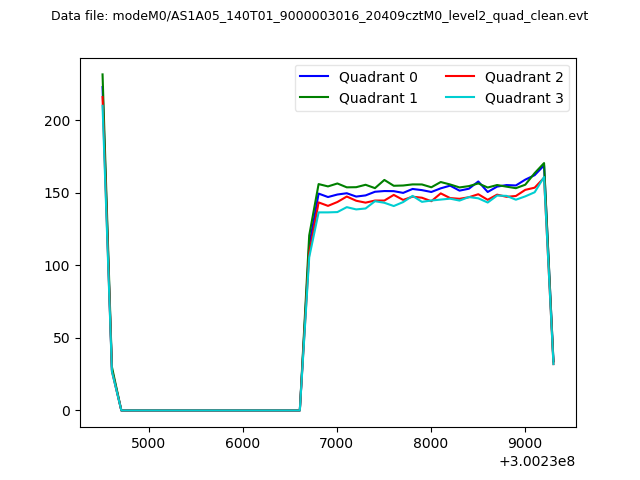 |
|
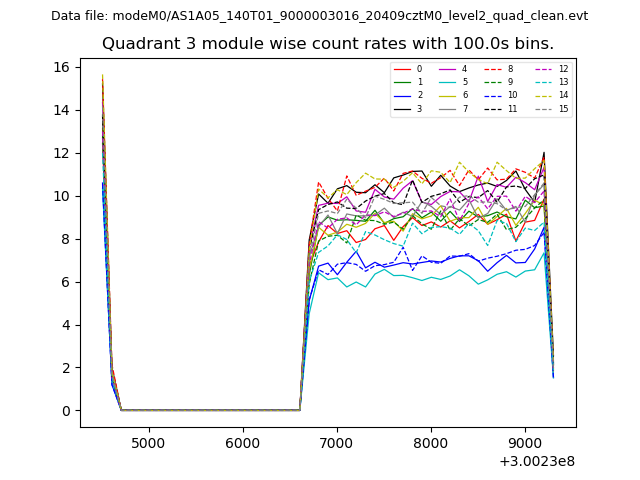
| Module-wise count rates for Quadrant A Data is divided into 100 sec bins |
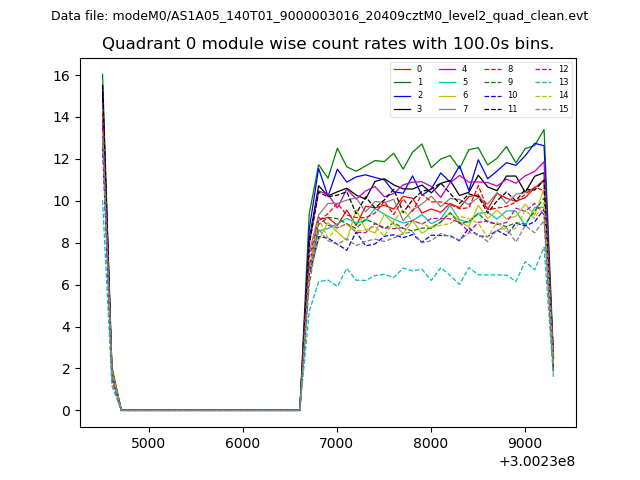 |
 |
| Module-wise count rates for Quadrant B Data is divided into 100 sec bins |
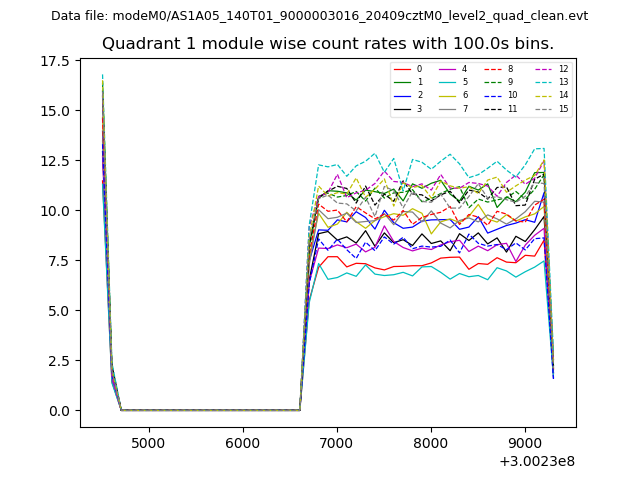 |
 |
| Module-wise count rates for Quadrant C Data is divided into 100 sec bins |
 |
 |
| Module-wise count rates for Quadrant D Data is divided into 100 sec bins |
 |
 |
| Parameter | Plot |
|---|---|
| CZT HV Monitor |  |
| D_VDD | 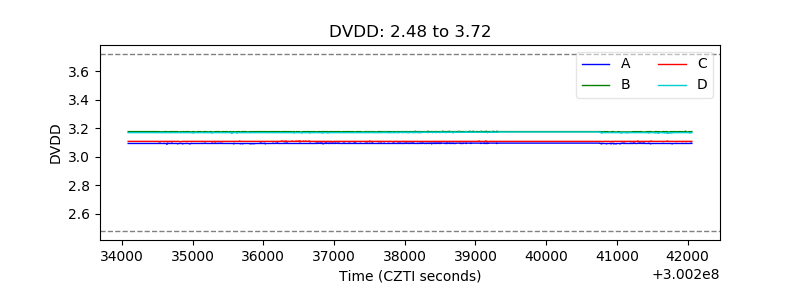 |
| Temperature 1 | 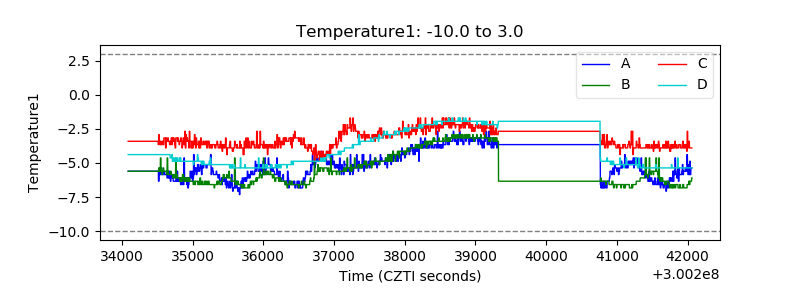 |
| Veto HV Monitor | 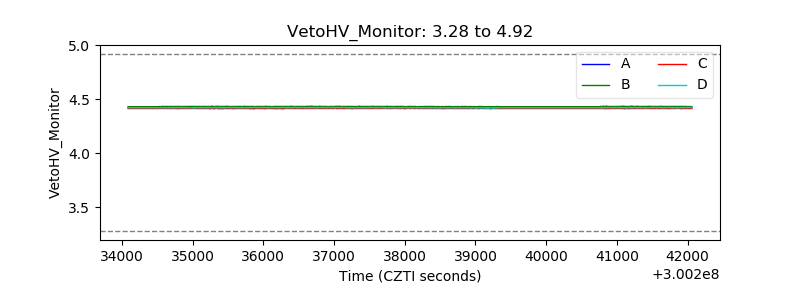 |
| Veto LLD | 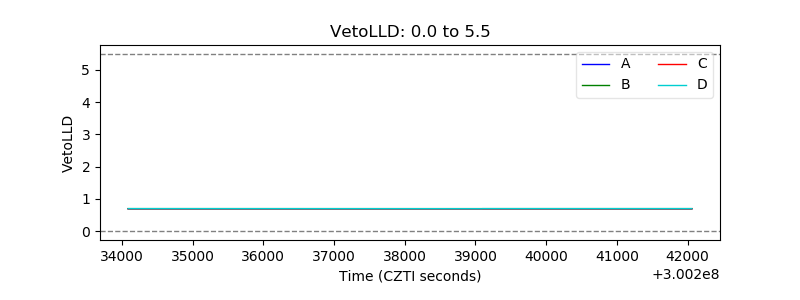 |
| Alpha Counter | 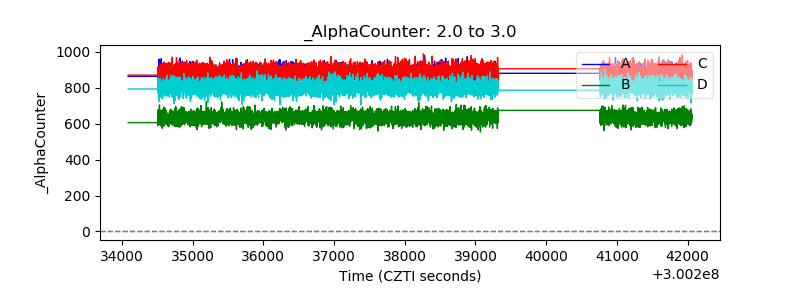 |
| _CPM_Rate | 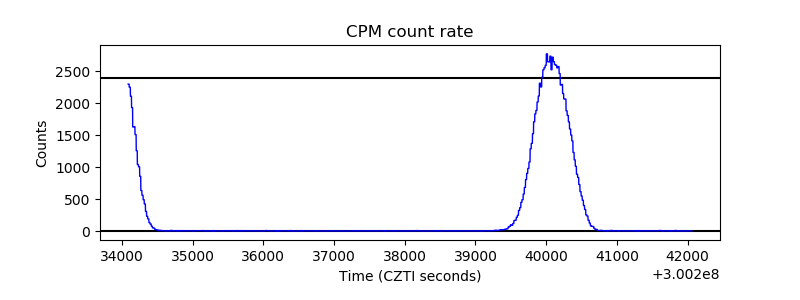 |
| CZT Counter | 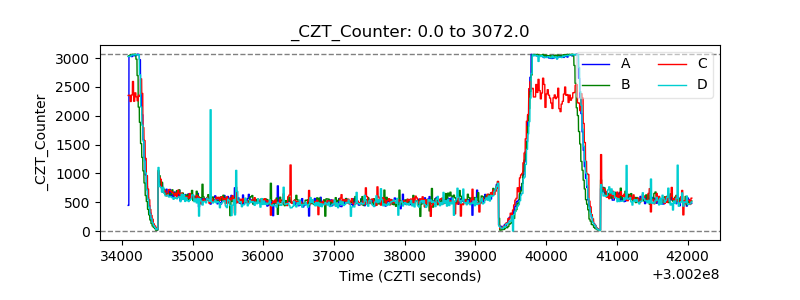 |
| +2.5 Volts monitor |  |
| +5 Volts monitor |  |
| _ROLL_ROT | 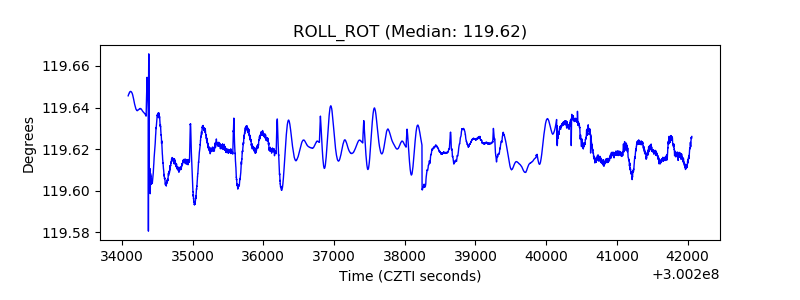 |
| _Roll_DEC | 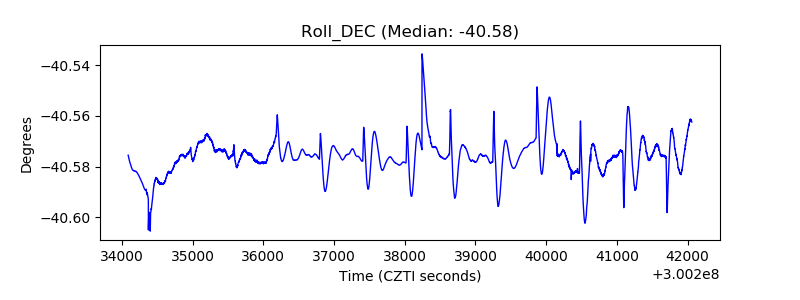 |
| _Roll_RA | 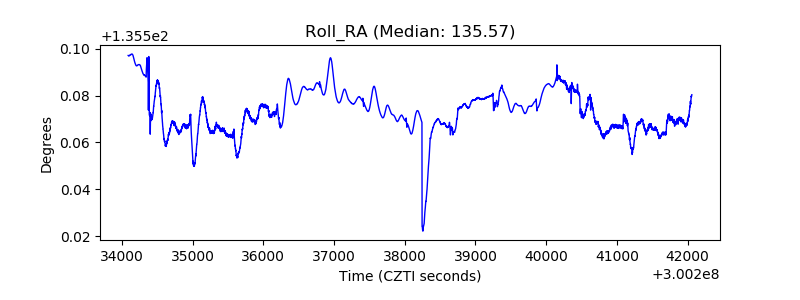 |
| Veto Counter | 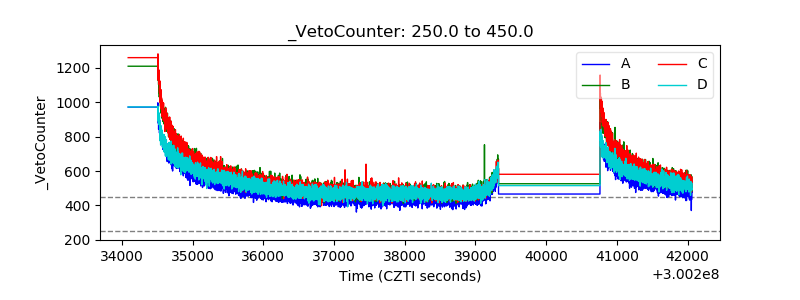 |