| Param | Original file | Final file |
|---|---|---|
| Filename | modeM0/AS1A05_140T01_9000003016_20411cztM0_level2.evt | modeM0/AS1A05_140T01_9000003016_20411cztM0_level2_quad_clean.evt |
| Size (bytes) | 486,771,840 | 90,849,600 |
| Size | 464.2 MB | 86.6 MB |
| Events in quadrant A | 3,261,936 | 588,934 |
| Events in quadrant B | 3,455,177 | 592,718 |
| Events in quadrant C | 3,326,477 | 568,589 |
| Events in quadrant D | 4,258,995 | 549,387 |
| Mode SS | |||
|---|---|---|---|
| Quadrant | BADHDUFLAG | Total packets | Discarded packets |
| A | 0 | 132 | 0 |
| B | 0 | 132 | 0 |
| C | 0 | 132 | 0 |
| D | 0 | 132 | 0 |
| Mode M9 | |||
|---|---|---|---|
| Quadrant | BADHDUFLAG | Total packets | Discarded packets |
| A | 0 | 11 | 0 |
| B | 0 | 11 | 0 |
| C | 0 | 11 | 0 |
| D | 0 | 11 | 0 |
| Mode M0 | |||
|---|---|---|---|
| Quadrant | BADHDUFLAG | Total packets | Discarded packets |
| A | 0 | 13373 | 2 |
| B | 0 | 13955 | 2 |
| C | 0 | 13481 | 2 |
| D | 0 | 16679 | 2 |
| Quadrant | Total seconds | Saturated seconds | Saturation percentage |
|---|---|---|---|
| A | 6470 | 45 | 0.695518% |
| B | 6471 | 103 | 1.591717% |
| C | 6471 | 96 | 1.483542% |
| D | 6471 | 190 | 2.936177% |
Noise dominated data is calculated using 1-second bins in cleaned event files. If a bin has >2000 counts, and if more than 50% of those come from <1% of pixels, then it is considered to be noise-dominated and hence unusable.
| Quadrant | # 1 sec bins | Bins with >0 counts | Bins with >2000 counts | High rate bins dominated by noise | Noise dominated (total time) | Noise dominated (detector-on time) | Marked lightcurve |
|---|---|---|---|---|---|---|---|
| A | 7565 | 6472 | 0 | 0 | 0.00% | 0.00% | 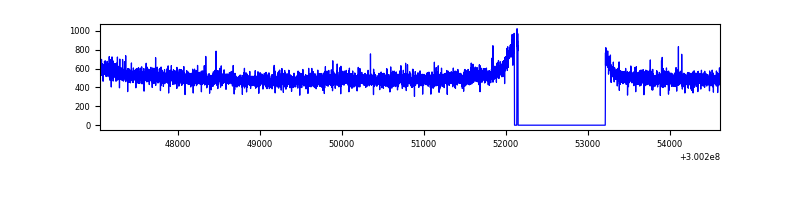 |
| B | 7566 | 6473 | 4 | 4 | 0.05% | 0.06% | 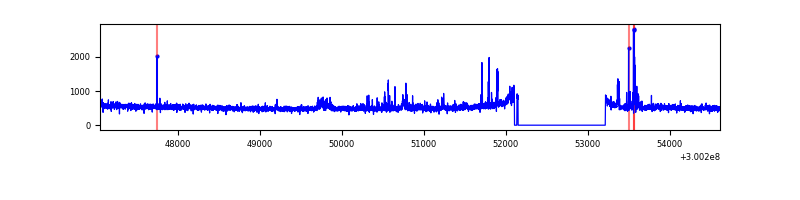 |
| C | 7566 | 6471 | 0 | 0 | 0.00% | 0.00% | 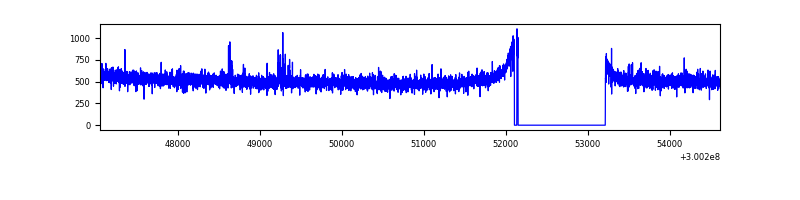 |
| D | 7566 | 6473 | 128 | 128 | 1.69% | 1.98% | 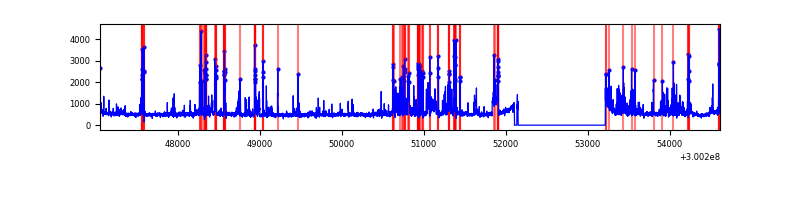 |
Top three noisy pixels from each quadrant. If the there are fewer than three noisy pixels in the level2.evt file, extra rows are filled as -1
| Pixel properties | Quadrant properties | ||||||
|---|---|---|---|---|---|---|---|
| Quadrant | DetID | PixID | Counts | Sigma | Mean | Median | Sigma |
| A | 11 | 29 | 8791 | 47.65 | 844 | 828 | 167.1 |
| A | 0 | 226 | 7380 | 39.2 | 844 | 828 | 167.1 |
| A | 3 | 137 | 6741 | 35.38 | 844 | 828 | 167.1 |
| B | 0 | 189 | 59598 | 369.58 | 840 | 819 | 159.0 |
| B | 10 | 245 | 56260 | 348.59 | 840 | 819 | 159.0 |
| B | 0 | 183 | 25633 | 156.02 | 840 | 819 | 159.0 |
| C | 14 | 238 | 131462 | 700.71 | 812 | 819 | 186.4 |
| C | 7 | 220 | 23518 | 121.75 | 812 | 819 | 186.4 |
| C | 13 | 61 | 5655 | 25.94 | 812 | 819 | 186.4 |
| D | 1 | 52 | 511392 | 2585.16 | 813 | 790 | 197.5 |
| D | 13 | 153 | 278862 | 1407.87 | 813 | 790 | 197.5 |
| D | 6 | 143 | 211312 | 1065.86 | 813 | 790 | 197.5 |
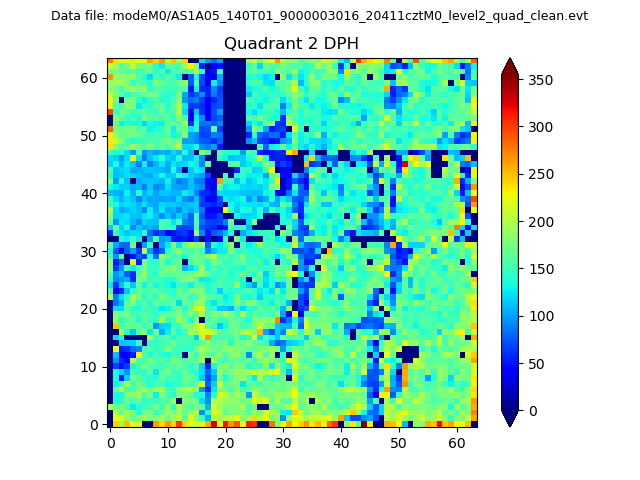
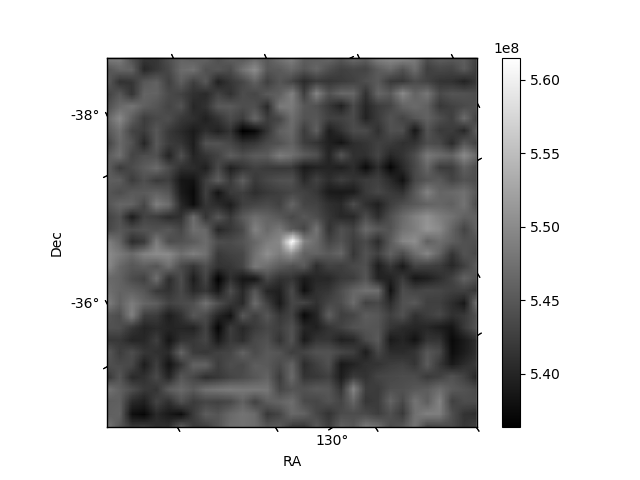
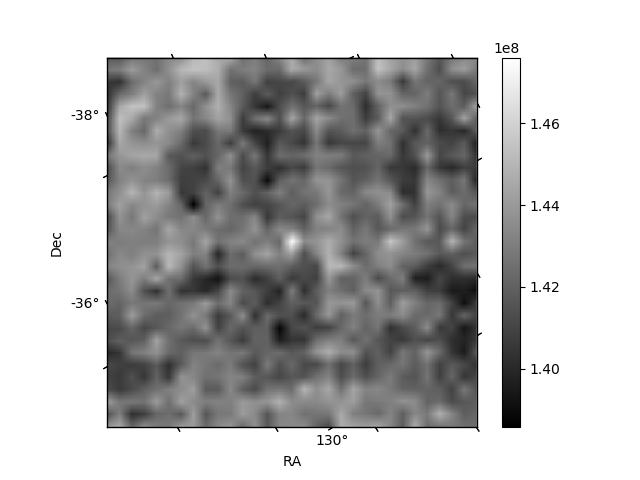
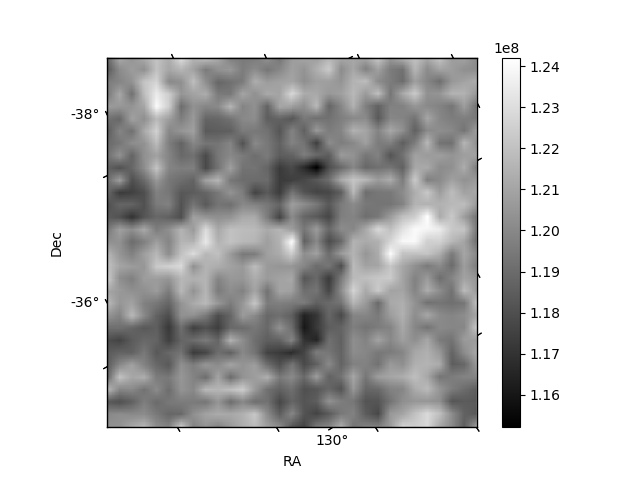
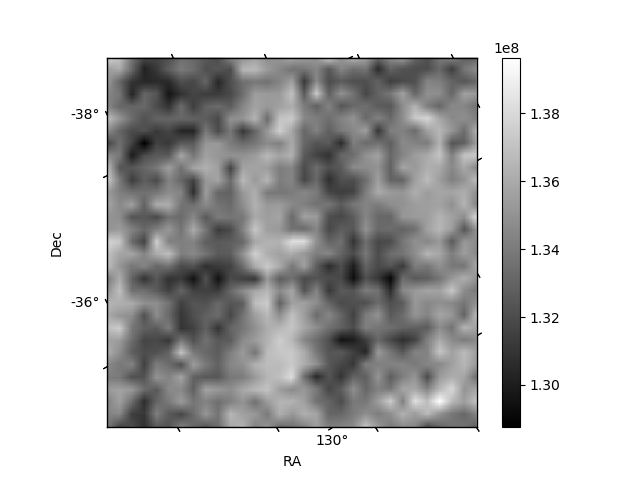
Histogram calculated using DETX and DETY for each event in the final _common_clean file
| Quadrant A | 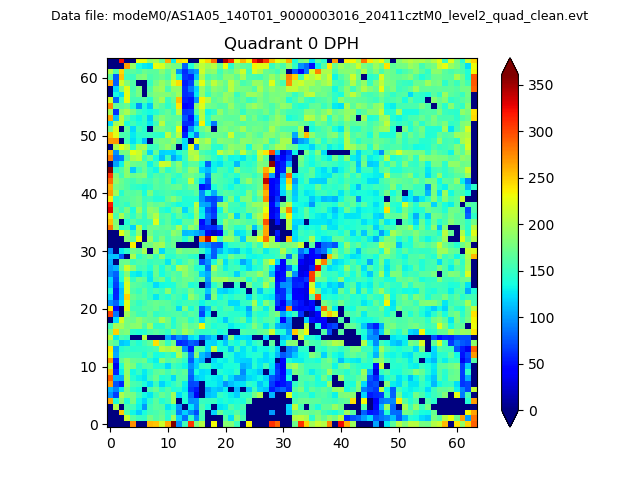 |
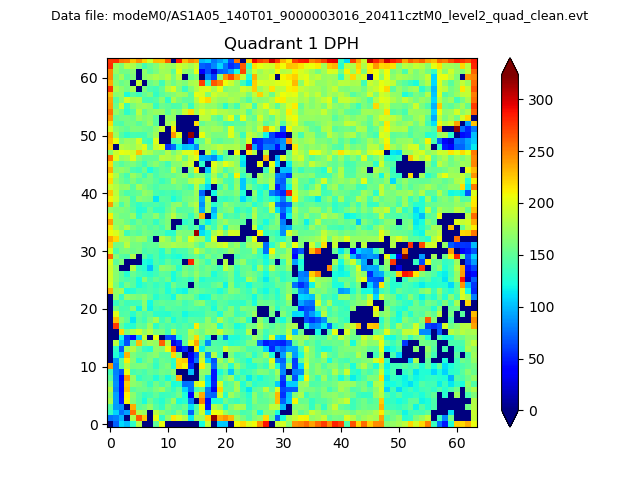 |
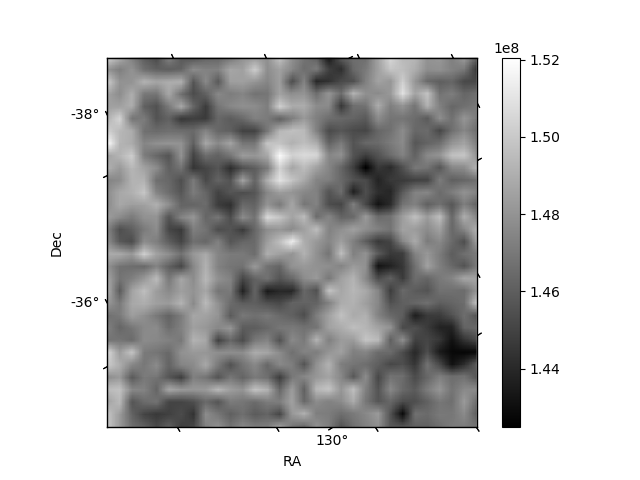
Quadrant B |
|---|---|---|---|
| Quadrant D | 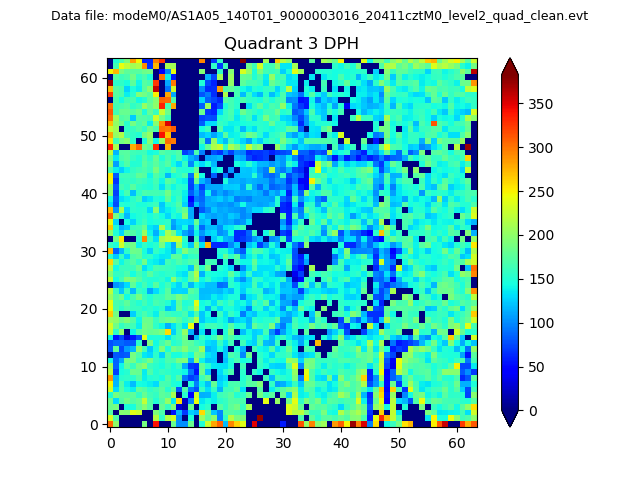 |
 |
Quadrant C |
| Plot type | Count rate plots | Images |
|---|---|---|
| Comparison with Poisson distribution Blue bars denote a histogram of data divided into 1 sec bins. Red curve is a Poisson curve with rate = median count rate of data. |
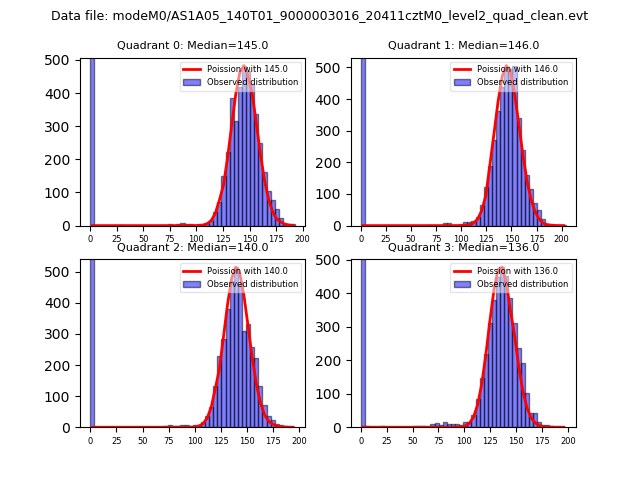 |
 |
| Quadrant-wise count rates Data is divided into 100 sec bins |
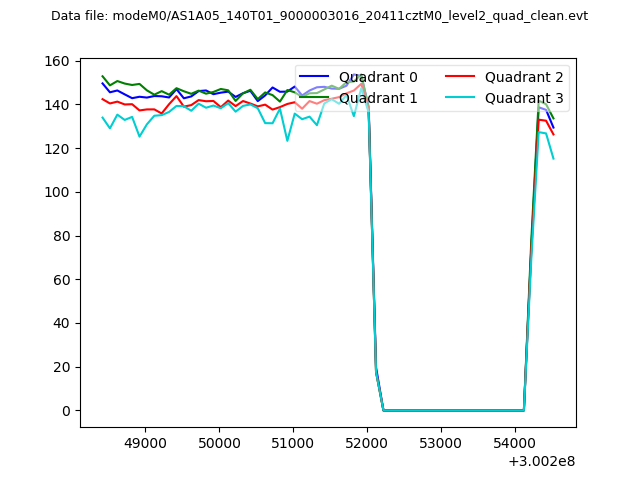 |
|
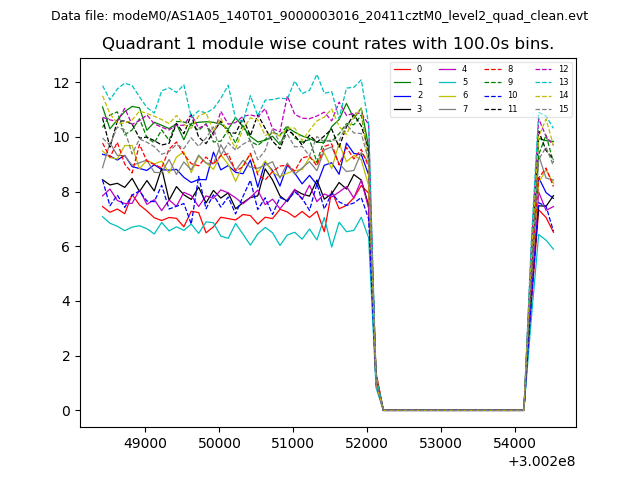
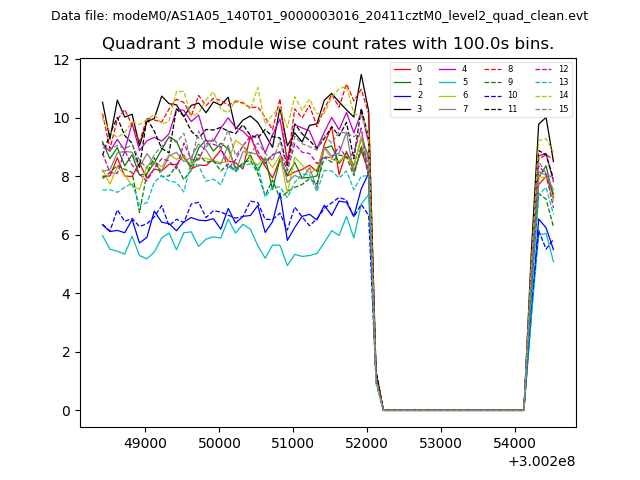
| Module-wise count rates for Quadrant A Data is divided into 100 sec bins |
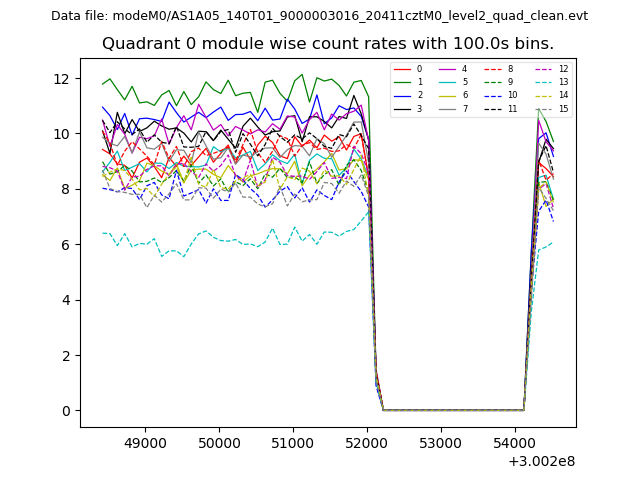 |
 |
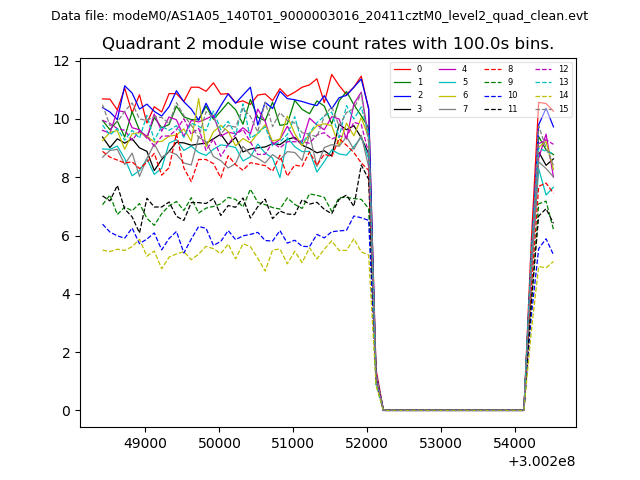
| Module-wise count rates for Quadrant B Data is divided into 100 sec bins |
 |
 |
| Module-wise count rates for Quadrant C Data is divided into 100 sec bins |
 |
 |
| Module-wise count rates for Quadrant D Data is divided into 100 sec bins |
 |
 |
| Parameter | Plot |
|---|---|
| CZT HV Monitor | 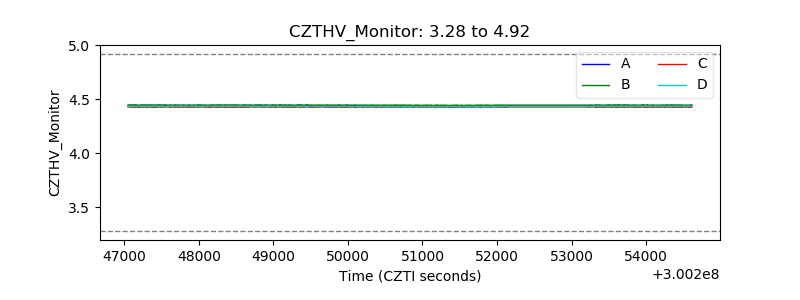 |
| D_VDD | 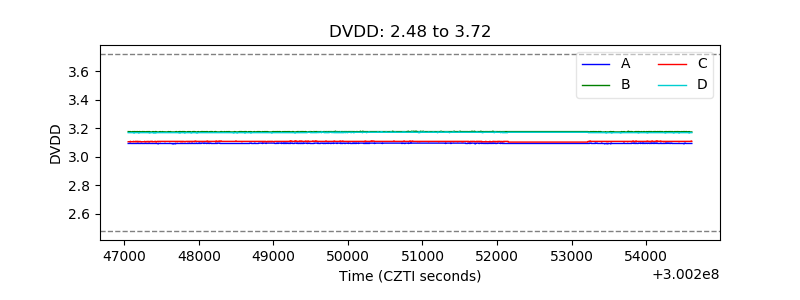 |
| Temperature 1 | 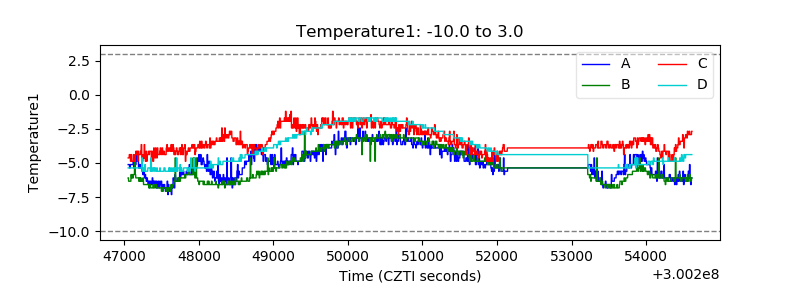 |
| Veto HV Monitor |  |
| Veto LLD | 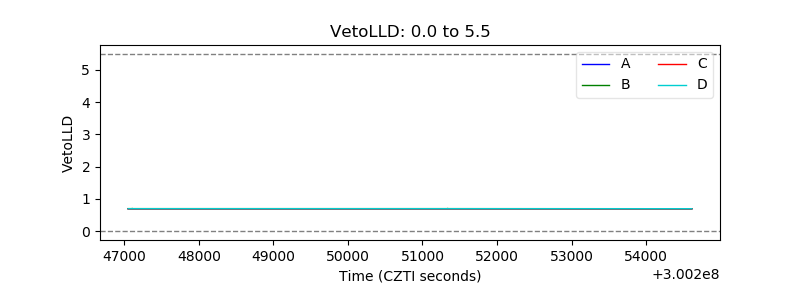 |
| Alpha Counter | 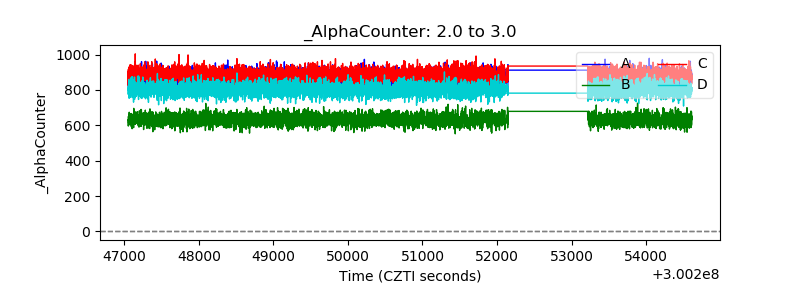 |
| _CPM_Rate | 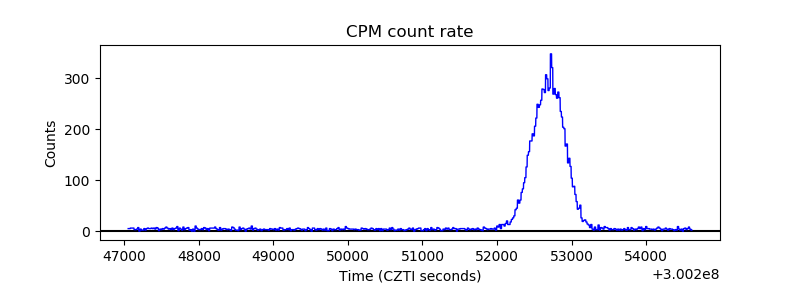 |
| CZT Counter | 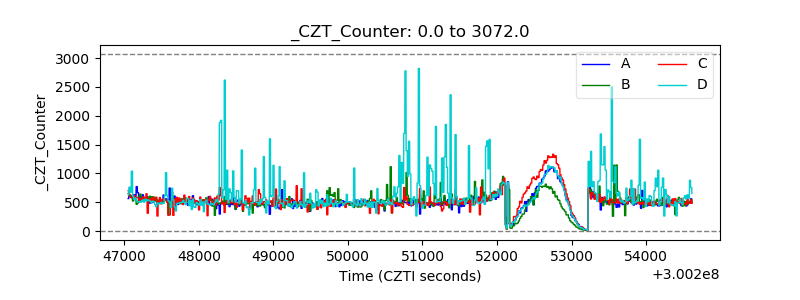 |
| +2.5 Volts monitor |  |
| +5 Volts monitor |  |
| _ROLL_ROT | 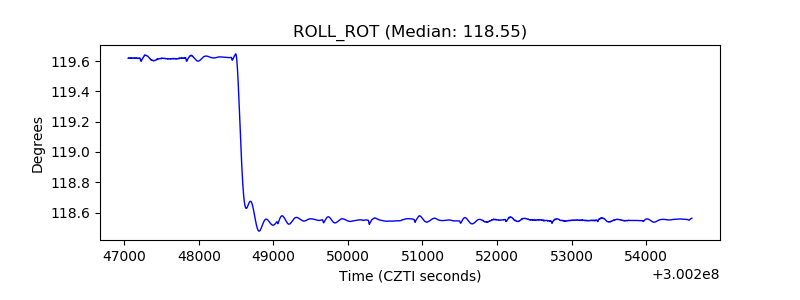 |
| _Roll_DEC | 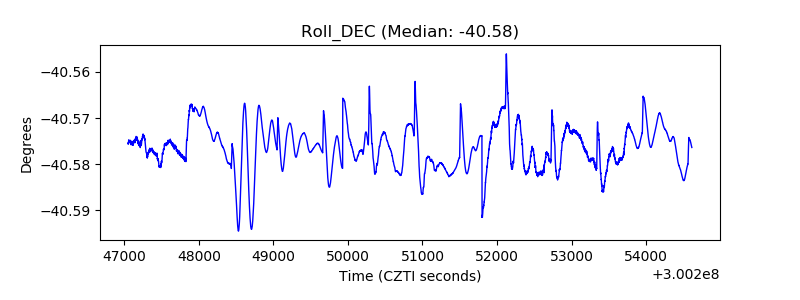 |
| _Roll_RA | 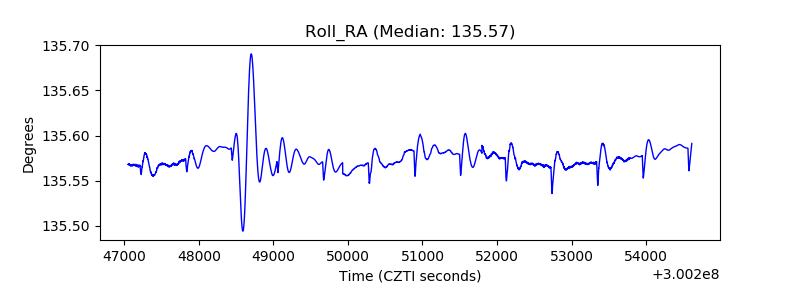 |
| Veto Counter | 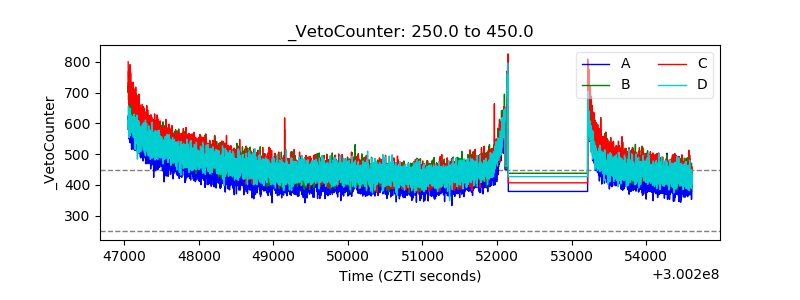 |