| Param | Original file | Final file |
|---|---|---|
| Filename | modeM0/AS1A05_140T01_9000003016_20412cztM0_level2.evt | modeM0/AS1A05_140T01_9000003016_20412cztM0_level2_quad_clean.evt |
| Size (bytes) | 512,092,800 | 96,036,480 |
| Size | 488.4 MB | 91.6 MB |
| Events in quadrant A | 3,448,996 | 618,978 |
| Events in quadrant B | 3,729,492 | 619,009 |
| Events in quadrant C | 3,494,799 | 596,638 |
| Events in quadrant D | 4,357,261 | 583,236 |
| Mode SS | |||
|---|---|---|---|
| Quadrant | BADHDUFLAG | Total packets | Discarded packets |
| A | 0 | 142 | 0 |
| B | 0 | 142 | 0 |
| C | 0 | 142 | 0 |
| D | 0 | 142 | 0 |
| Mode M9 | |||
|---|---|---|---|
| Quadrant | BADHDUFLAG | Total packets | Discarded packets |
| A | 0 | 11 | 0 |
| B | 0 | 12 | 0 |
| C | 0 | 12 | 0 |
| D | 0 | 12 | 0 |
| Mode M0 | |||
|---|---|---|---|
| Quadrant | BADHDUFLAG | Total packets | Discarded packets |
| A | 0 | 14489 | 2 |
| B | 0 | 15302 | 2 |
| C | 0 | 14556 | 2 |
| D | 0 | 17396 | 2 |
| Quadrant | Total seconds | Saturated seconds | Saturation percentage |
|---|---|---|---|
| A | 7047 | 116 | 1.646091% |
| B | 7047 | 165 | 2.341422% |
| C | 7047 | 169 | 2.398184% |
| D | 7047 | 214 | 3.036753% |
Noise dominated data is calculated using 1-second bins in cleaned event files. If a bin has >2000 counts, and if more than 50% of those come from <1% of pixels, then it is considered to be noise-dominated and hence unusable.
| Quadrant | # 1 sec bins | Bins with >0 counts | Bins with >2000 counts | High rate bins dominated by noise | Noise dominated (total time) | Noise dominated (detector-on time) | Marked lightcurve |
|---|---|---|---|---|---|---|---|
| A | 7662 | 7048 | 0 | 0 | 0.00% | 0.00% | 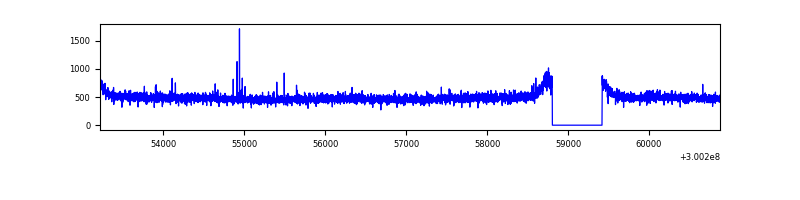 |
| B | 7662 | 7048 | 38 | 38 | 0.50% | 0.54% | 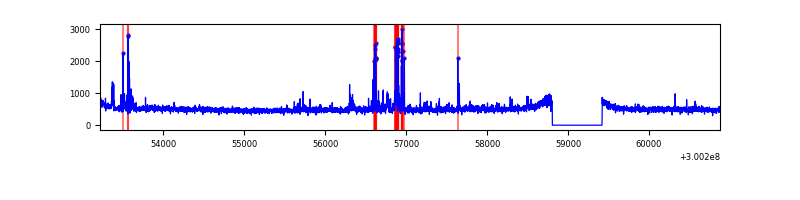 |
| C | 7662 | 7047 | 0 | 0 | 0.00% | 0.00% | 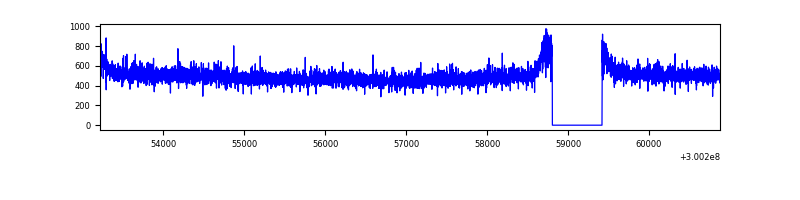 |
| D | 7662 | 7047 | 72 | 72 | 0.94% | 1.02% | 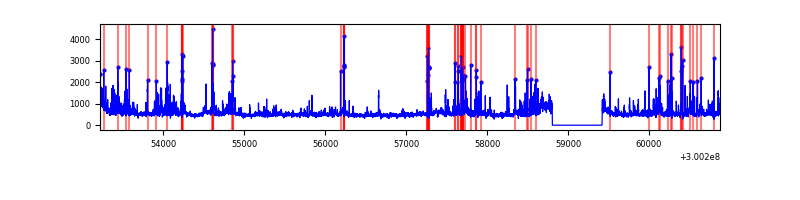 |
Top three noisy pixels from each quadrant. If the there are fewer than three noisy pixels in the level2.evt file, extra rows are filled as -1
| Pixel properties | Quadrant properties | ||||||
|---|---|---|---|---|---|---|---|
| Quadrant | DetID | PixID | Counts | Sigma | Mean | Median | Sigma |
| A | 11 | 29 | 13656 | 71.71 | 890 | 871 | 178.3 |
| A | 0 | 226 | 7582 | 37.64 | 890 | 871 | 178.3 |
| A | 3 | 137 | 7325 | 36.2 | 890 | 871 | 178.3 |
| B | 4 | 216 | 139740 | 830.34 | 880 | 858 | 167.3 |
| B | 10 | 245 | 59915 | 353.09 | 880 | 858 | 167.3 |
| B | 0 | 189 | 50689 | 297.93 | 880 | 858 | 167.3 |
| C | 14 | 238 | 136168 | 679.54 | 853 | 859 | 199.1 |
| C | 7 | 220 | 19284 | 92.53 | 853 | 859 | 199.1 |
| C | 13 | 61 | 5917 | 25.4 | 853 | 859 | 199.1 |
| D | 1 | 52 | 489619 | 2320.31 | 865 | 841 | 210.7 |
| D | 6 | 143 | 239277 | 1131.89 | 865 | 841 | 210.7 |
| D | 13 | 153 | 140496 | 662.97 | 865 | 841 | 210.7 |
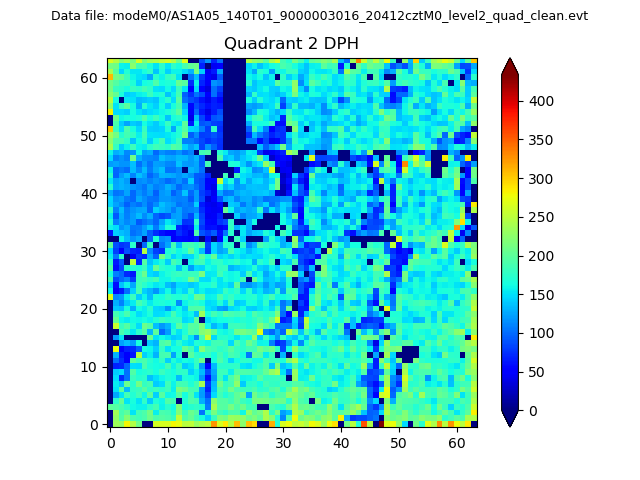
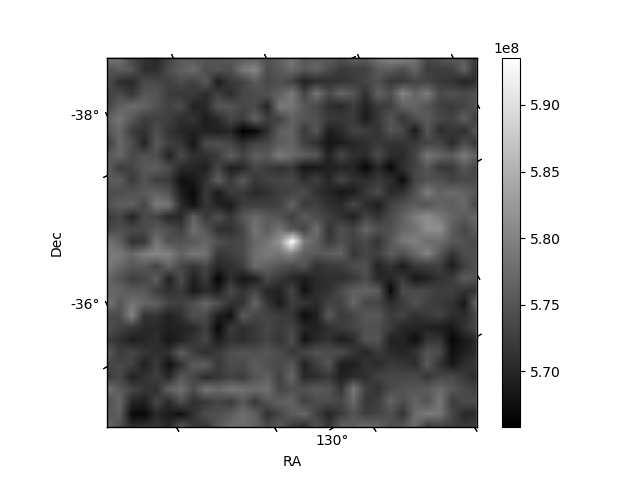
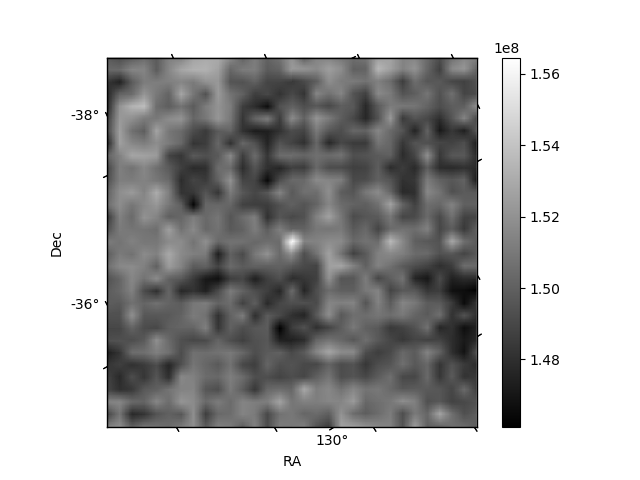
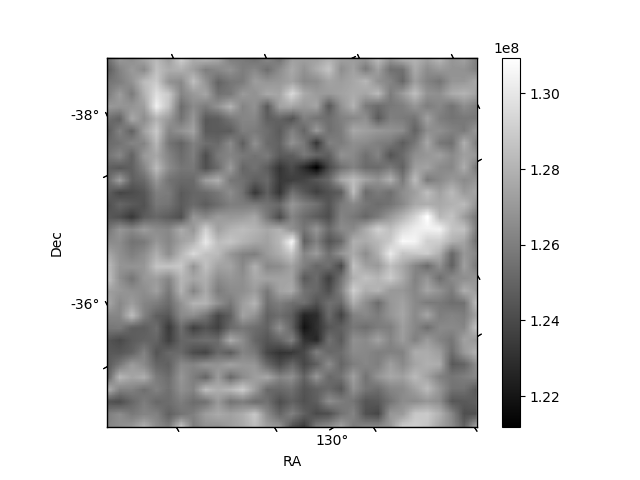
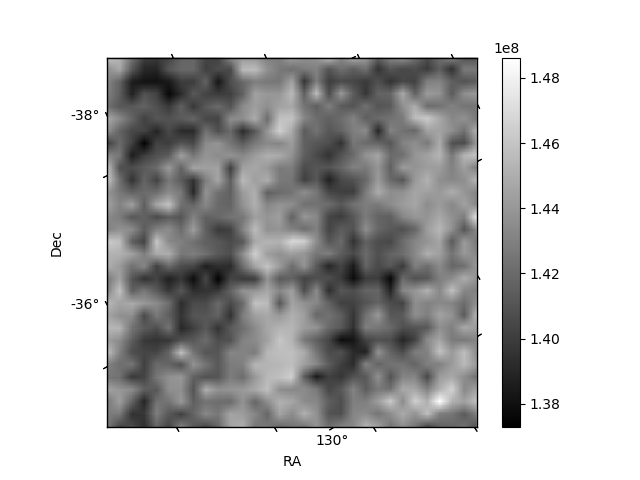
Histogram calculated using DETX and DETY for each event in the final _common_clean file
| Quadrant A | 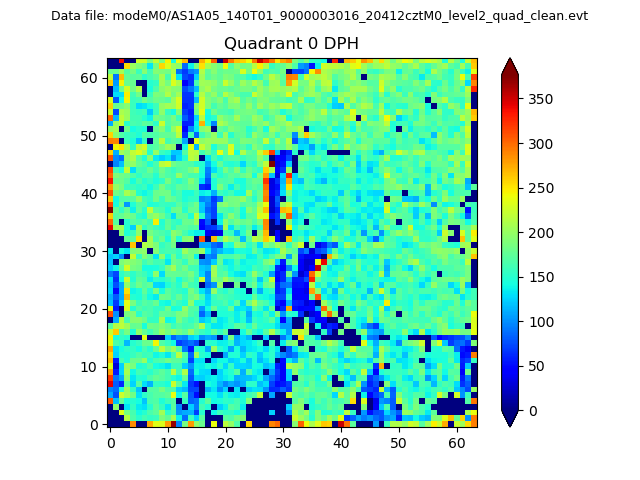 |
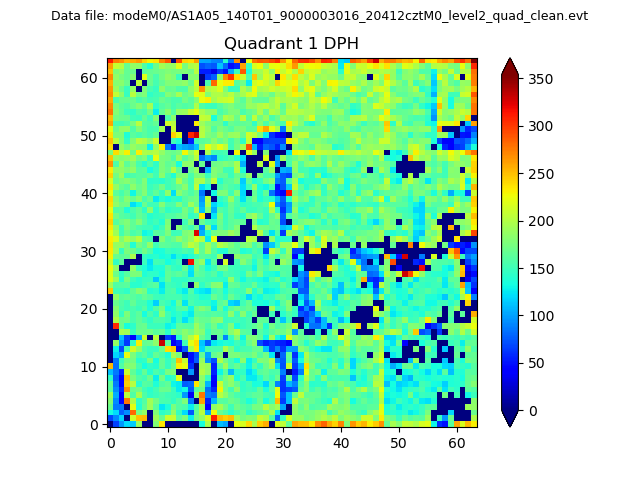 |
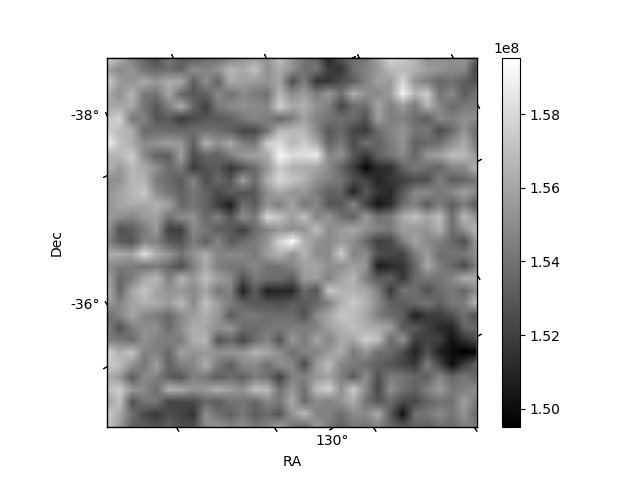
Quadrant B |
|---|---|---|---|
| Quadrant D | 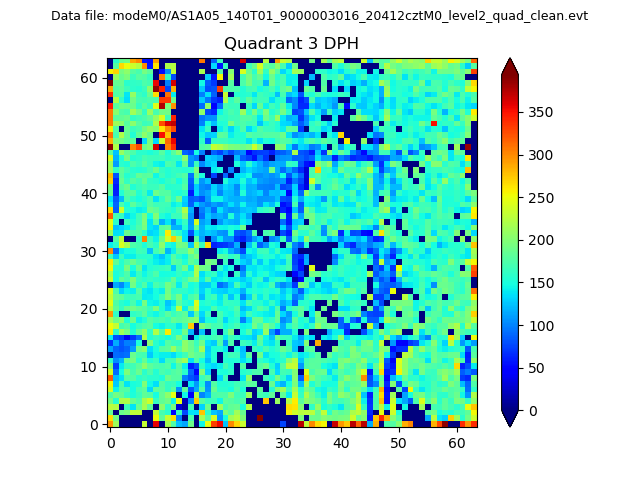 |
 |
Quadrant C |
| Plot type | Count rate plots | Images |
|---|---|---|
| Comparison with Poisson distribution Blue bars denote a histogram of data divided into 1 sec bins. Red curve is a Poisson curve with rate = median count rate of data. |
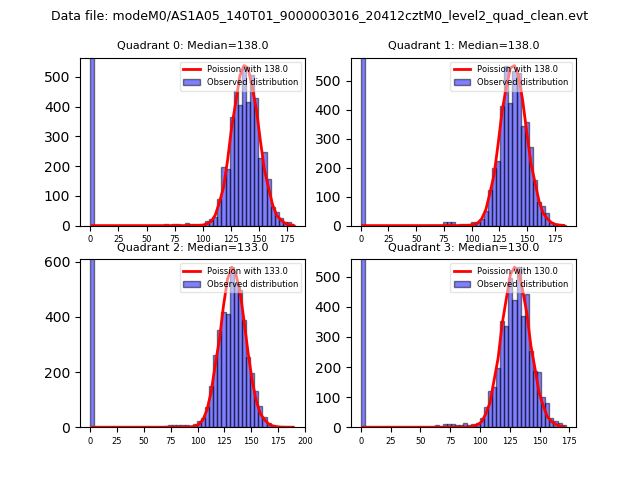 |
 |
| Quadrant-wise count rates Data is divided into 100 sec bins |
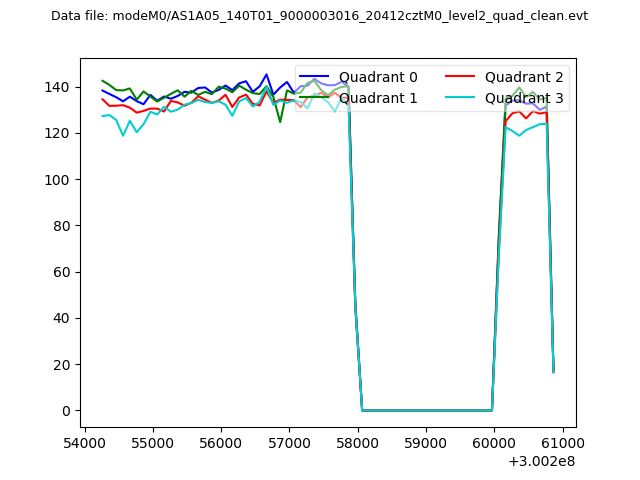 |
|
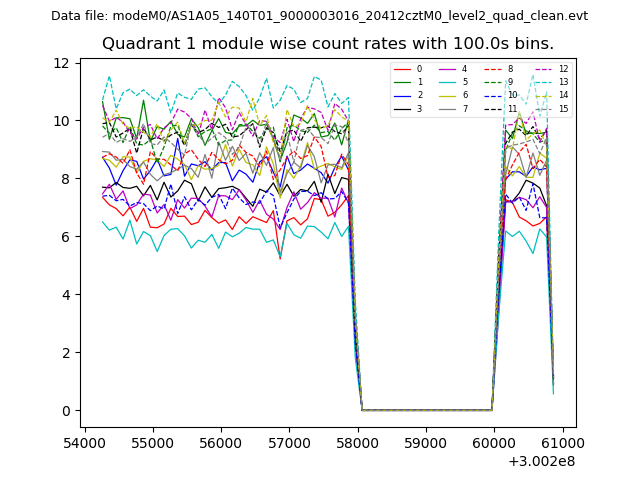
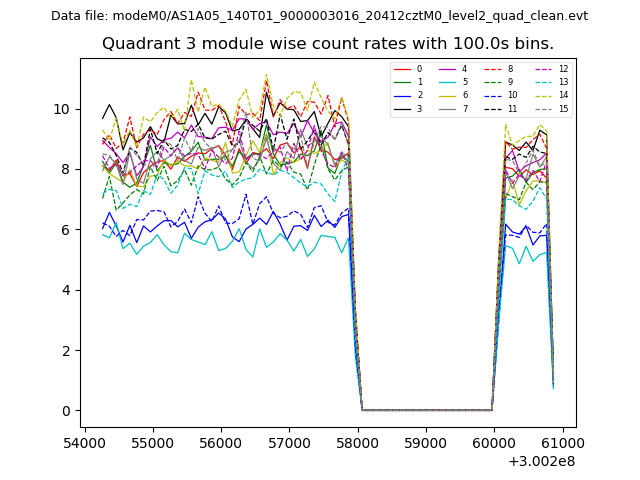
| Module-wise count rates for Quadrant A Data is divided into 100 sec bins |
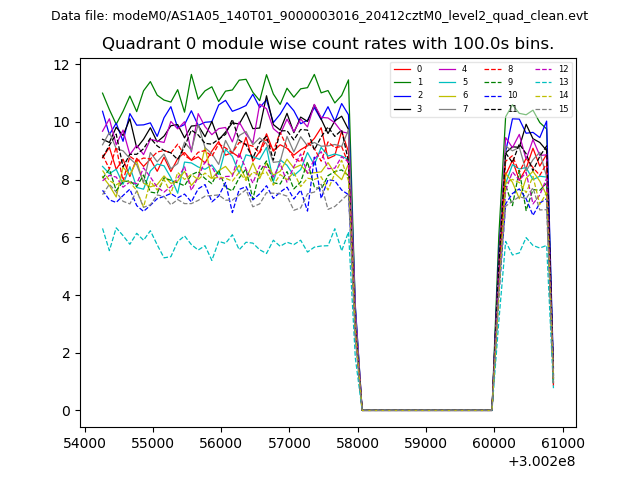 |
 |
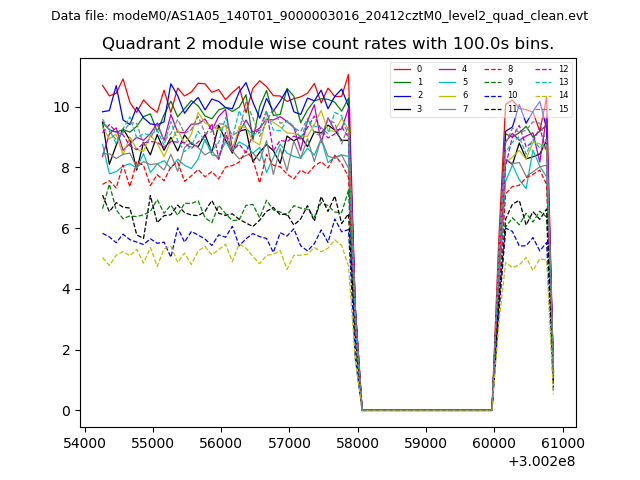
| Module-wise count rates for Quadrant B Data is divided into 100 sec bins |
 |
 |
| Module-wise count rates for Quadrant C Data is divided into 100 sec bins |
 |
 |
| Module-wise count rates for Quadrant D Data is divided into 100 sec bins |
 |
 |
| Parameter | Plot |
|---|---|
| CZT HV Monitor | 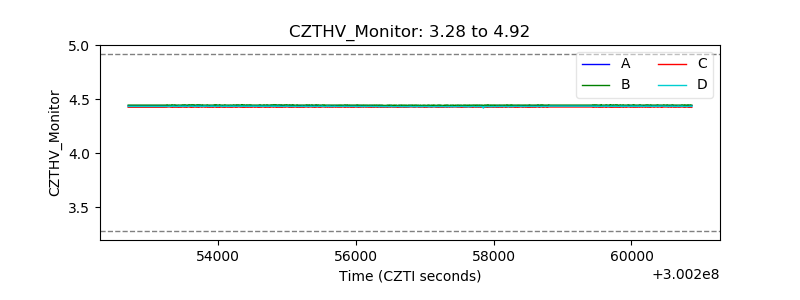 |
| D_VDD | 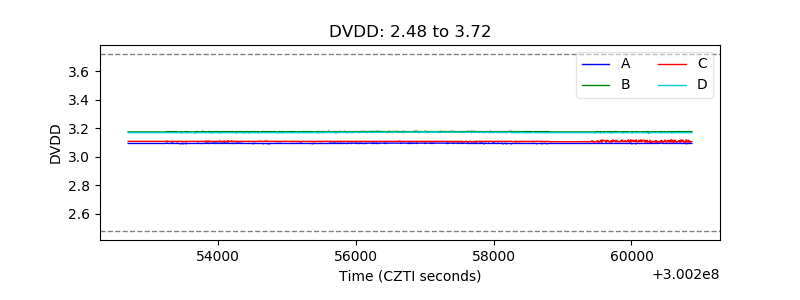 |
| Temperature 1 | 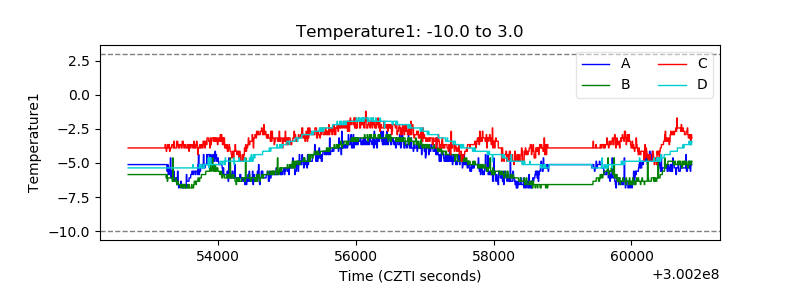 |
| Veto HV Monitor | 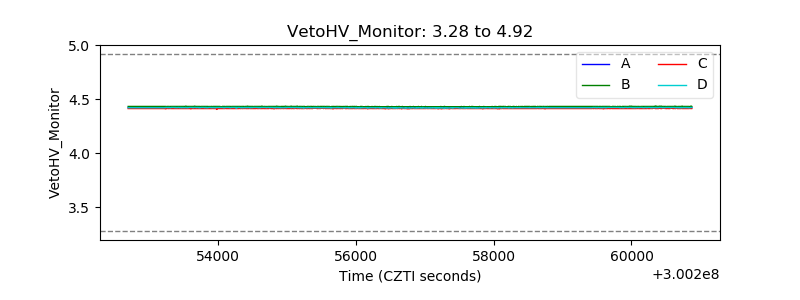 |
| Veto LLD | 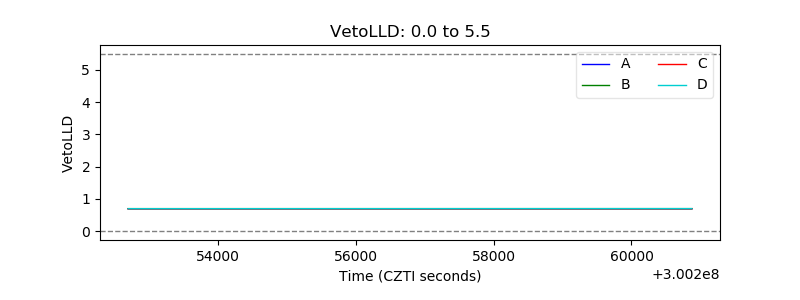 |
| Alpha Counter | 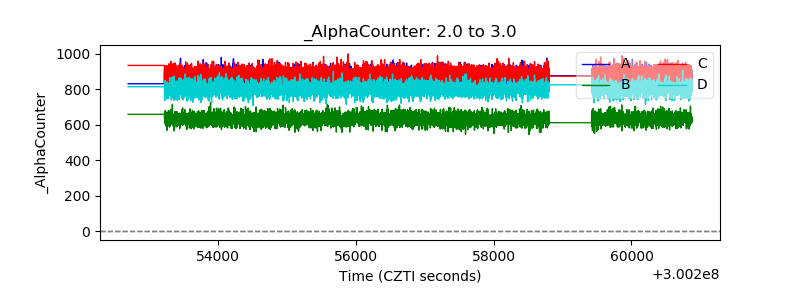 |
| _CPM_Rate | 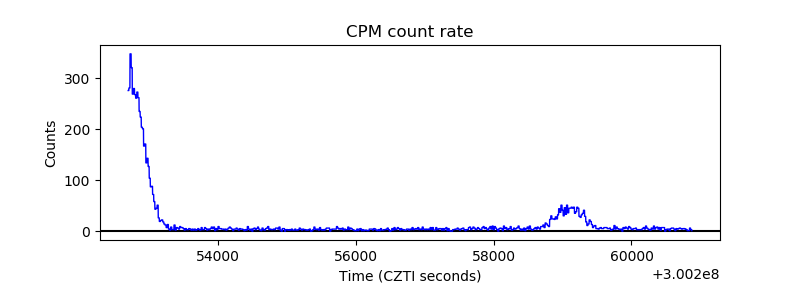 |
| CZT Counter | 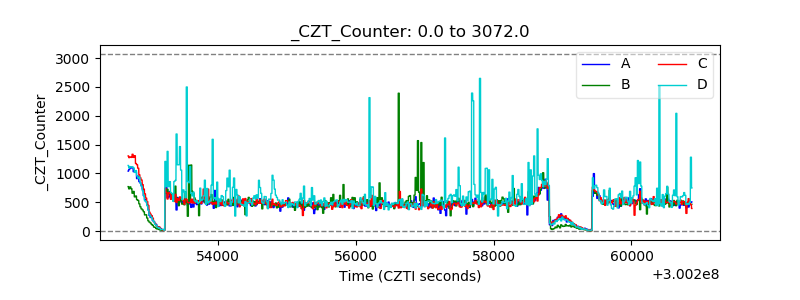 |
| +2.5 Volts monitor | 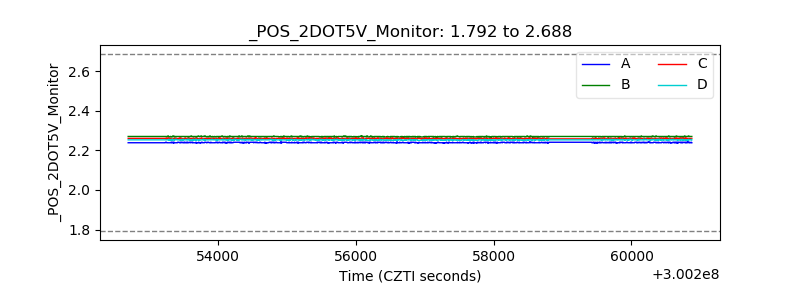 |
| +5 Volts monitor |  |
| _ROLL_ROT | 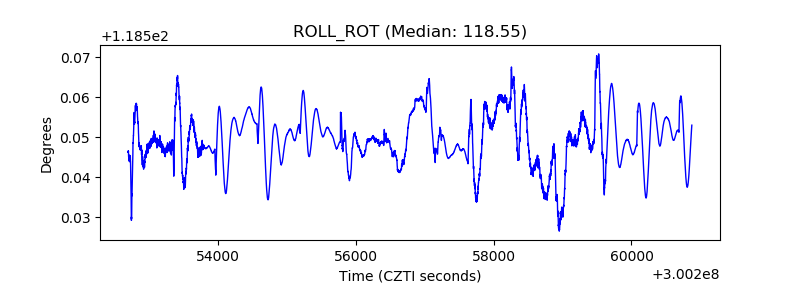 |
| _Roll_DEC |  |
| _Roll_RA | 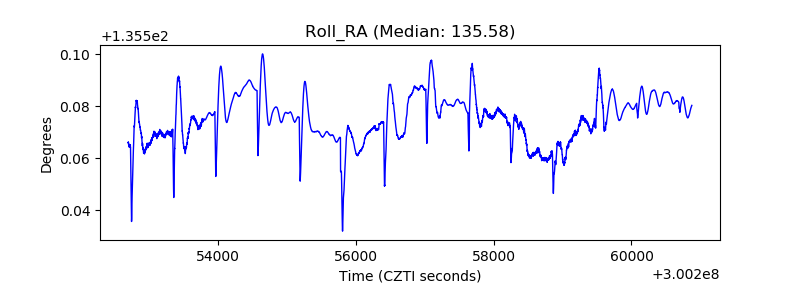 |
| Veto Counter | 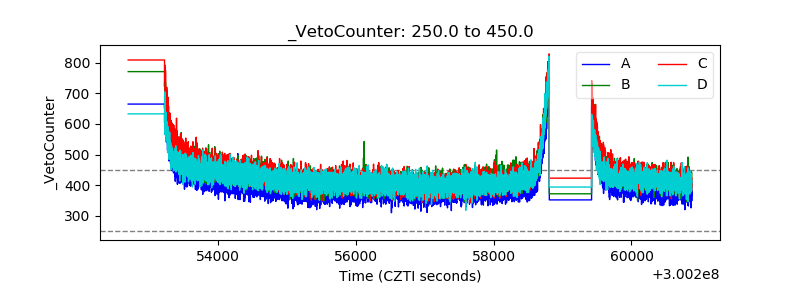 |