| Param | Original file | Final file |
|---|---|---|
| Filename | modeM0/AS1A05_140T01_9000003016_20413cztM0_level2.evt | modeM0/AS1A05_140T01_9000003016_20413cztM0_level2_quad_clean.evt |
| Size (bytes) | 495,322,560 | 102,179,520 |
| Size | 472.4 MB | 97.4 MB |
| Events in quadrant A | 3,452,585 | 665,297 |
| Events in quadrant B | 3,543,785 | 665,525 |
| Events in quadrant C | 3,505,530 | 636,784 |
| Events in quadrant D | 4,011,546 | 627,492 |
| Mode SS | |||
|---|---|---|---|
| Quadrant | BADHDUFLAG | Total packets | Discarded packets |
| A | 0 | 146 | 0 |
| B | 0 | 146 | 0 |
| C | 0 | 146 | 0 |
| D | 0 | 146 | 0 |
| Mode M9 | |||
|---|---|---|---|
| Quadrant | BADHDUFLAG | Total packets | Discarded packets |
| A | 0 | 2 | 0 |
| B | 0 | 2 | 0 |
| C | 0 | 2 | 0 |
| D | 0 | 2 | 0 |
| Mode M0 | |||
|---|---|---|---|
| Quadrant | BADHDUFLAG | Total packets | Discarded packets |
| A | 0 | 14735 | 1 |
| B | 0 | 14921 | 1 |
| C | 0 | 14790 | 1 |
| D | 0 | 16746 | 1 |
| Quadrant | Total seconds | Saturated seconds | Saturation percentage |
|---|---|---|---|
| A | 7168 | 152 | 2.120536% |
| B | 7169 | 162 | 2.259729% |
| C | 7169 | 205 | 2.859534% |
| D | 7169 | 313 | 4.366020% |
Noise dominated data is calculated using 1-second bins in cleaned event files. If a bin has >2000 counts, and if more than 50% of those come from <1% of pixels, then it is considered to be noise-dominated and hence unusable.
| Quadrant | # 1 sec bins | Bins with >0 counts | Bins with >2000 counts | High rate bins dominated by noise | Noise dominated (total time) | Noise dominated (detector-on time) | Marked lightcurve |
|---|---|---|---|---|---|---|---|
| A | 7343 | 7170 | 0 | 0 | 0.00% | 0.00% |  |
| B | 7344 | 7171 | 2 | 2 | 0.03% | 0.03% |  |
| C | 7344 | 7171 | 0 | 0 | 0.00% | 0.00% |  |
| D | 7344 | 7171 | 135 | 135 | 1.84% | 1.88% |  |
Top three noisy pixels from each quadrant. If the there are fewer than three noisy pixels in the level2.evt file, extra rows are filled as -1
| Pixel properties | Quadrant properties | ||||||
|---|---|---|---|---|---|---|---|
| Quadrant | DetID | PixID | Counts | Sigma | Mean | Median | Sigma |
| A | 11 | 29 | 17591 | 92.55 | 891 | 873 | 180.6 |
| A | 0 | 226 | 7672 | 37.64 | 891 | 873 | 180.6 |
| A | 3 | 137 | 7507 | 36.73 | 891 | 873 | 180.6 |
| B | 0 | 189 | 29987 | 171.04 | 882 | 858 | 170.3 |
| B | 10 | 245 | 27867 | 158.6 | 882 | 858 | 170.3 |
| B | 12 | 111 | 21015 | 118.36 | 882 | 858 | 170.3 |
| C | 14 | 238 | 135634 | 673.46 | 853 | 860 | 200.1 |
| C | 8 | 128 | 13593 | 63.63 | 853 | 860 | 200.1 |
| C | 7 | 220 | 9515 | 43.25 | 853 | 860 | 200.1 |
| D | 13 | 153 | 481100 | 2282.14 | 860 | 835 | 210.4 |
| D | 1 | 52 | 259364 | 1228.49 | 860 | 835 | 210.4 |
| D | 2 | 234 | 31300 | 144.76 | 860 | 835 | 210.4 |
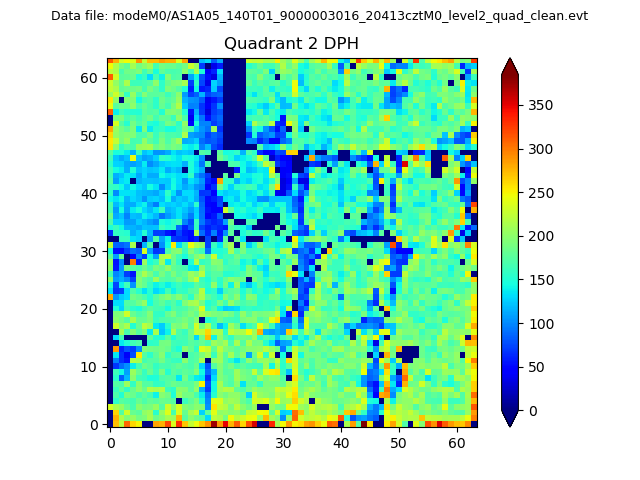
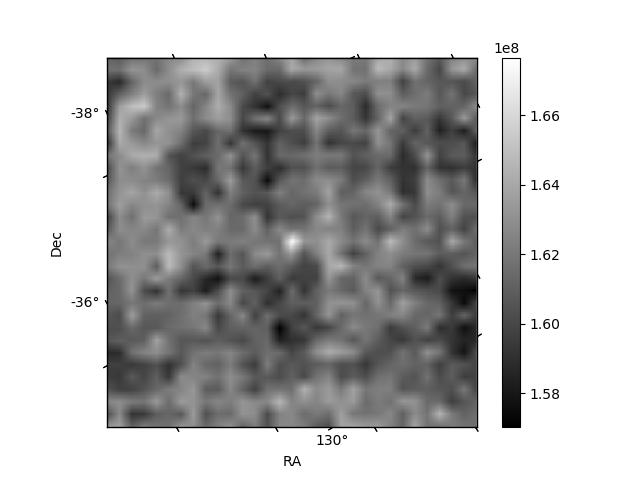
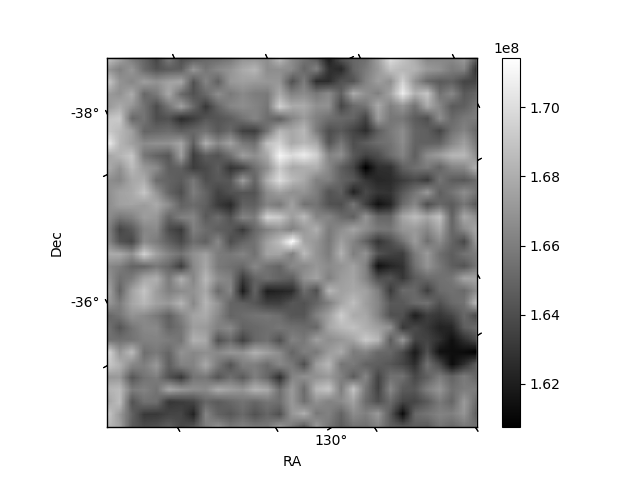
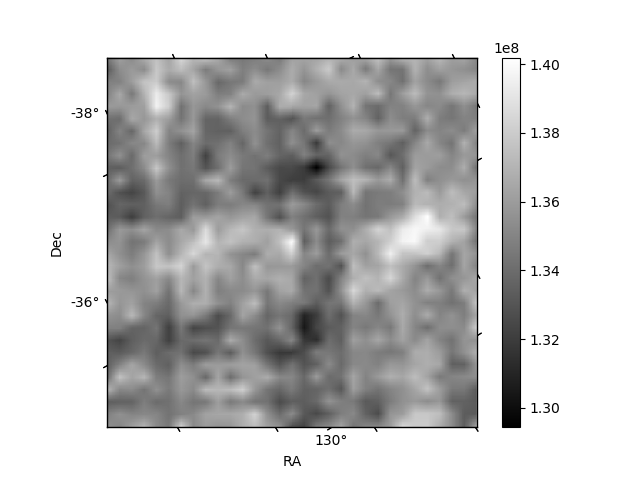
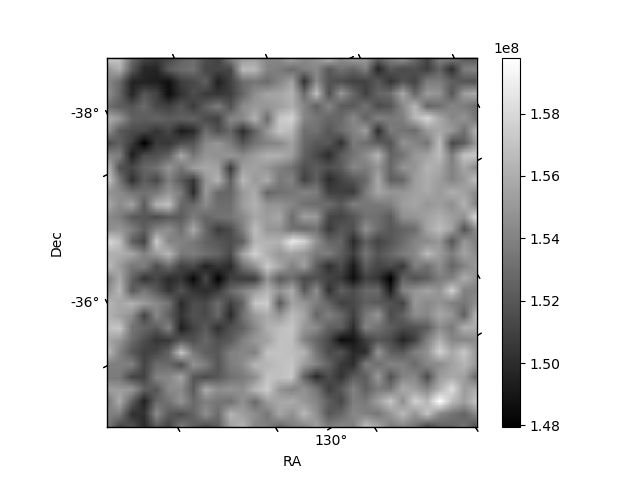
Histogram calculated using DETX and DETY for each event in the final _common_clean file
| Quadrant A | 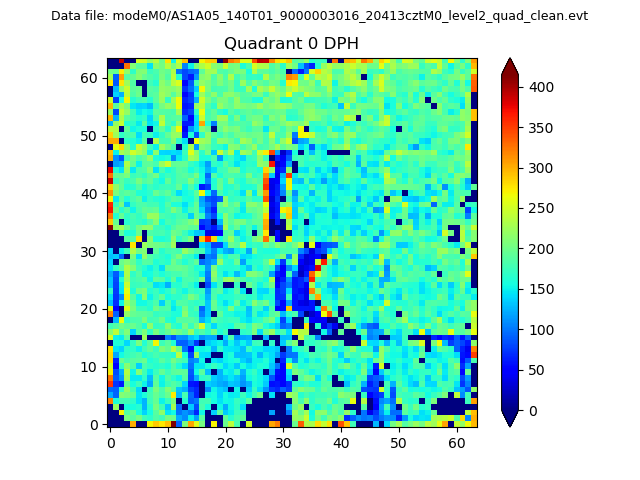 |
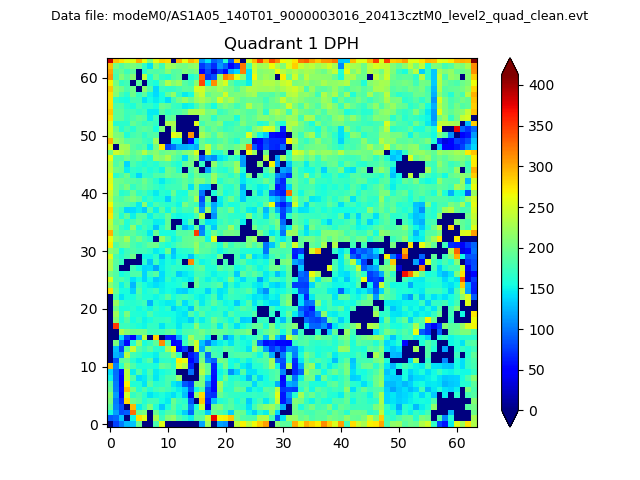 |
Quadrant B |
|---|---|---|---|
| Quadrant D | 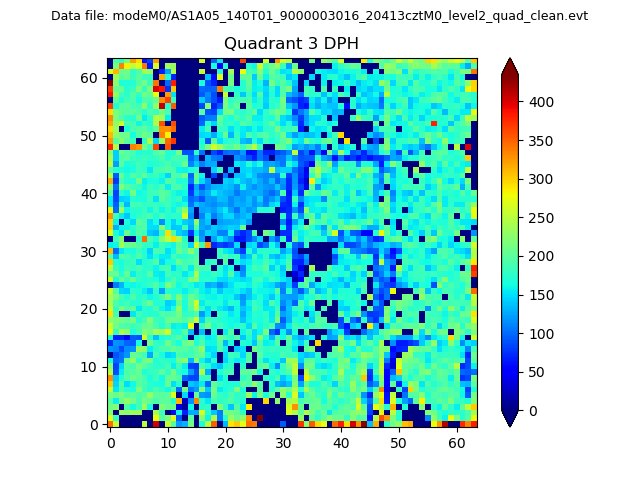 |
 |
Quadrant C |
| Plot type | Count rate plots | Images |
|---|---|---|
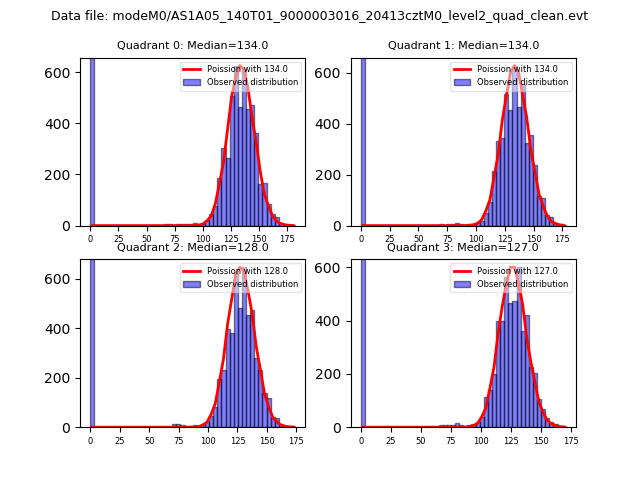
| Comparison with Poisson distribution Blue bars denote a histogram of data divided into 1 sec bins. Red curve is a Poisson curve with rate = median count rate of data. |
 |
 |
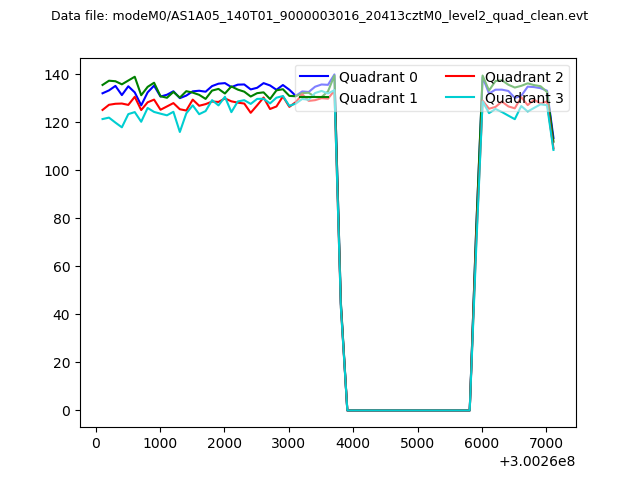
| Quadrant-wise count rates Data is divided into 100 sec bins |
 |
|
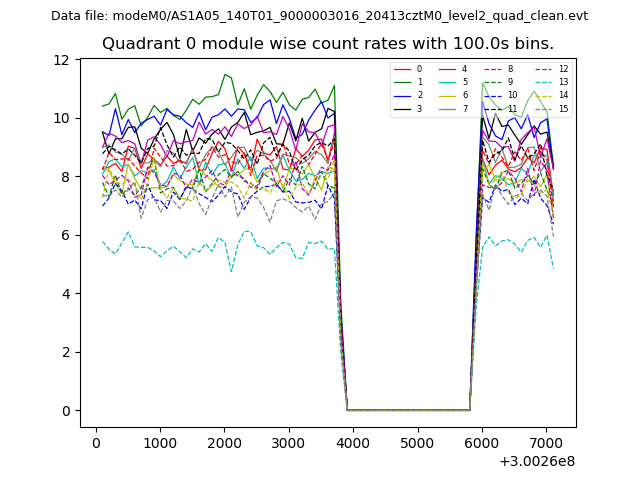
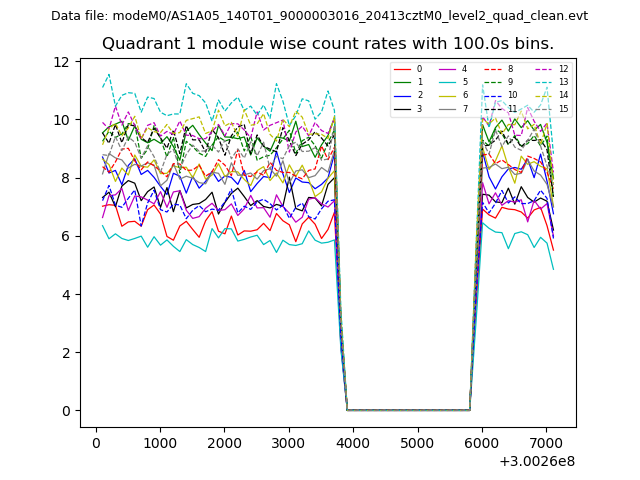
| Module-wise count rates for Quadrant A Data is divided into 100 sec bins |
 |
 |
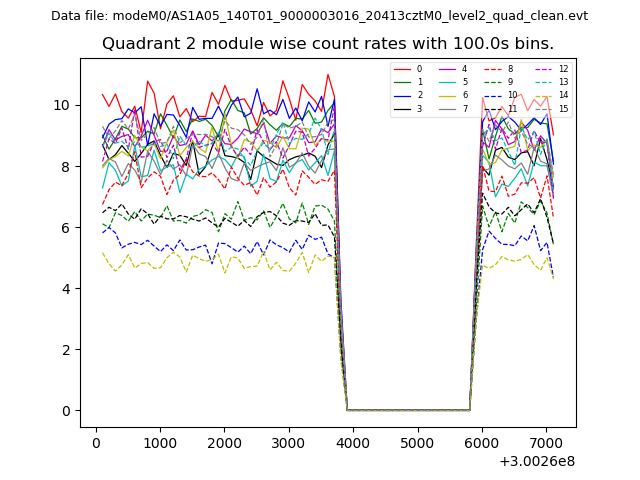
| Module-wise count rates for Quadrant B Data is divided into 100 sec bins |
 |
 |
| Module-wise count rates for Quadrant C Data is divided into 100 sec bins |
 |
 |
| Module-wise count rates for Quadrant D Data is divided into 100 sec bins |
 |
 |
| Parameter | Plot |
|---|---|
| CZT HV Monitor | 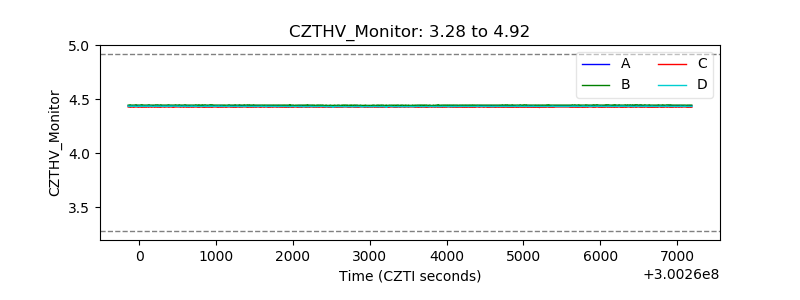 |
| D_VDD | 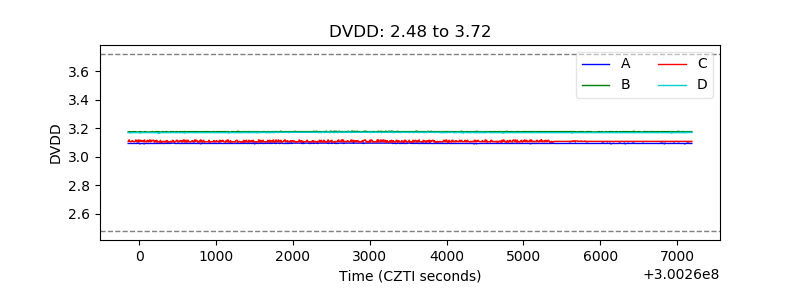 |
| Temperature 1 | 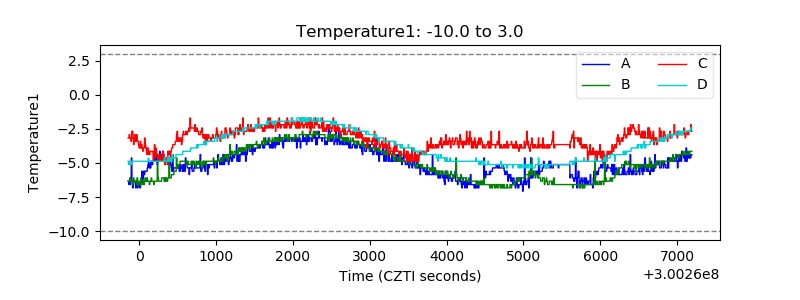 |
| Veto HV Monitor | 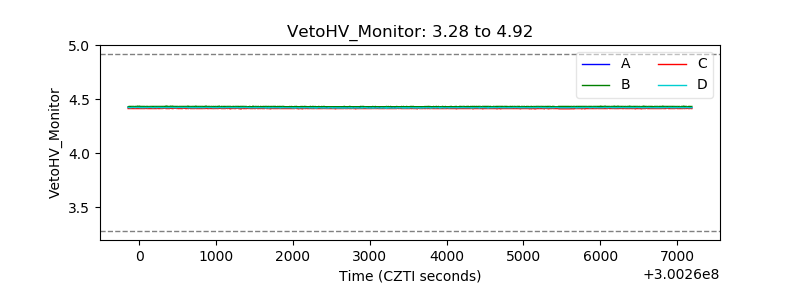 |
| Veto LLD | 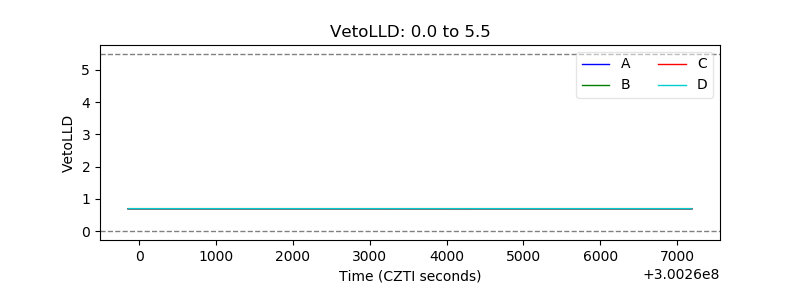 |
| Alpha Counter | 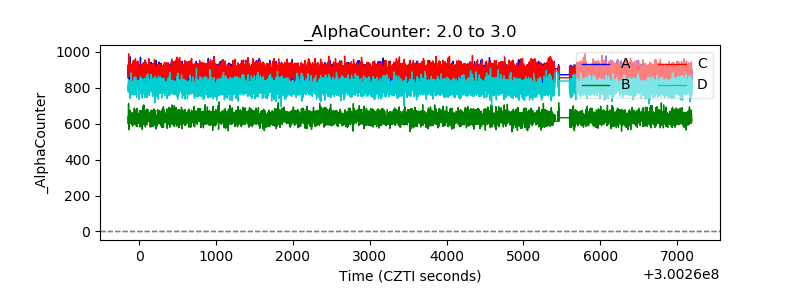 |
| _CPM_Rate | 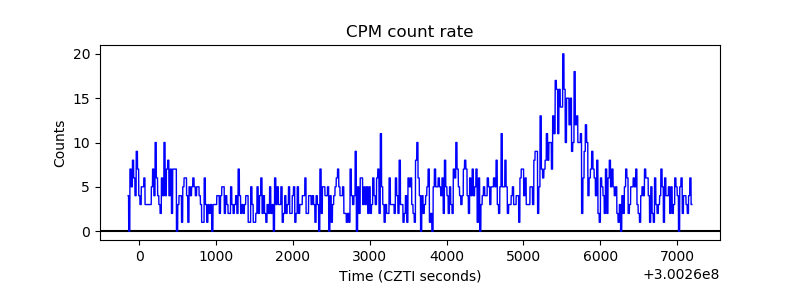 |
| CZT Counter | 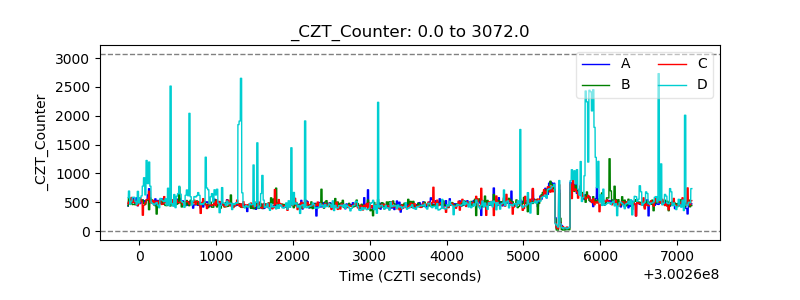 |
| +2.5 Volts monitor |  |
| +5 Volts monitor | 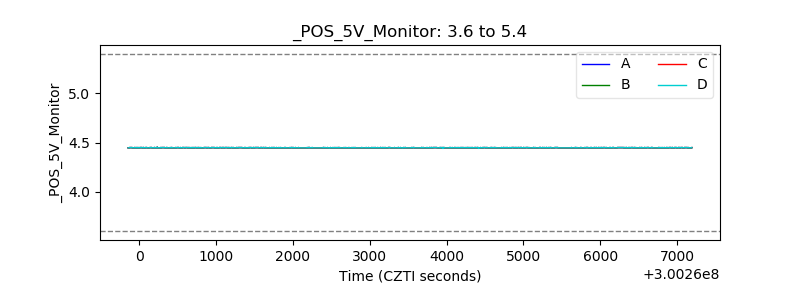 |
| _ROLL_ROT | 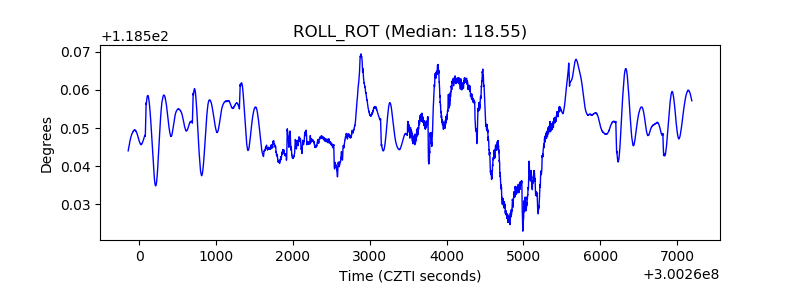 |
| _Roll_DEC | 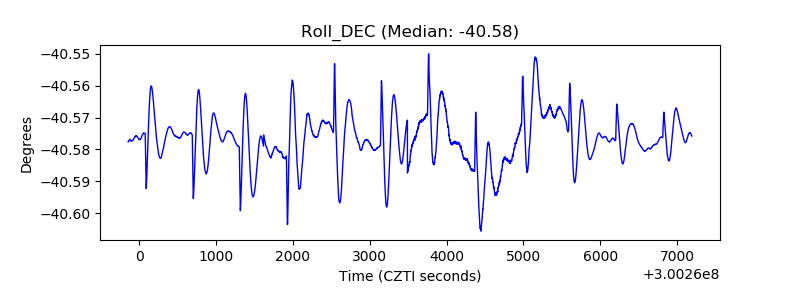 |
| _Roll_RA | 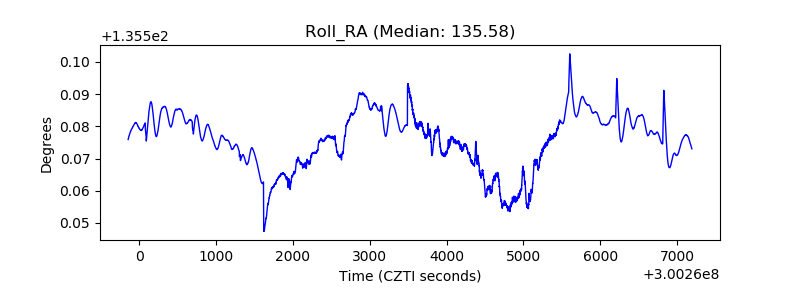 |
| Veto Counter | 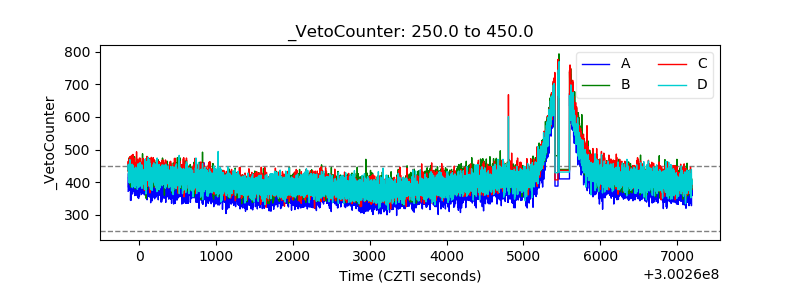 |