| Param | Original file | Final file |
|---|---|---|
| Filename | modeM0/AS1A05_140T01_9000003016_20414cztM0_level2.evt | modeM0/AS1A05_140T01_9000003016_20414cztM0_level2_quad_clean.evt |
| Size (bytes) | 486,515,520 | 101,954,880 |
| Size | 464.0 MB | 97.2 MB |
| Events in quadrant A | 3,431,441 | 665,828 |
| Events in quadrant B | 3,642,899 | 663,512 |
| Events in quadrant C | 3,435,909 | 637,766 |
| Events in quadrant D | 3,746,972 | 631,608 |
| Mode SS | |||
|---|---|---|---|
| Quadrant | BADHDUFLAG | Total packets | Discarded packets |
| A | 0 | 142 | 0 |
| B | 0 | 142 | 0 |
| C | 0 | 142 | 0 |
| D | 0 | 142 | 0 |
| Mode M9 | |||
|---|---|---|---|
| Quadrant | BADHDUFLAG | Total packets | Discarded packets |
| A | 0 | 1 | 0 |
| B | 0 | 1 | 0 |
| C | 0 | 1 | 0 |
| D | 0 | 1 | 0 |
| Mode M0 | |||
|---|---|---|---|
| Quadrant | BADHDUFLAG | Total packets | Discarded packets |
| A | 0 | 14560 | 1 |
| B | 0 | 15235 | 1 |
| C | 0 | 14597 | 1 |
| D | 0 | 15891 | 1 |
| Quadrant | Total seconds | Saturated seconds | Saturation percentage |
|---|---|---|---|
| A | 7017 | 219 | 3.120992% |
| B | 7018 | 254 | 3.619265% |
| C | 7018 | 258 | 3.676261% |
| D | 7018 | 276 | 3.932744% |
Noise dominated data is calculated using 1-second bins in cleaned event files. If a bin has >2000 counts, and if more than 50% of those come from <1% of pixels, then it is considered to be noise-dominated and hence unusable.
| Quadrant | # 1 sec bins | Bins with >0 counts | Bins with >2000 counts | High rate bins dominated by noise | Noise dominated (total time) | Noise dominated (detector-on time) | Marked lightcurve |
|---|---|---|---|---|---|---|---|
| A | 7072 | 7018 | 0 | 0 | 0.00% | 0.00% | 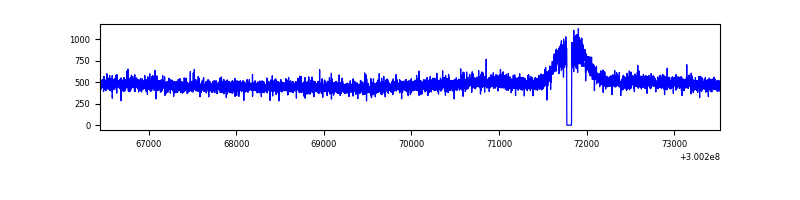 |
| B | 7073 | 7019 | 1 | 1 | 0.01% | 0.01% | 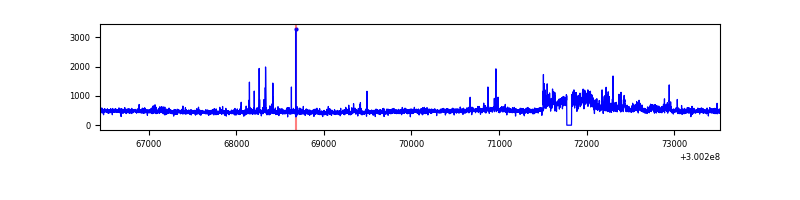 |
| C | 7073 | 7019 | 0 | 0 | 0.00% | 0.00% | 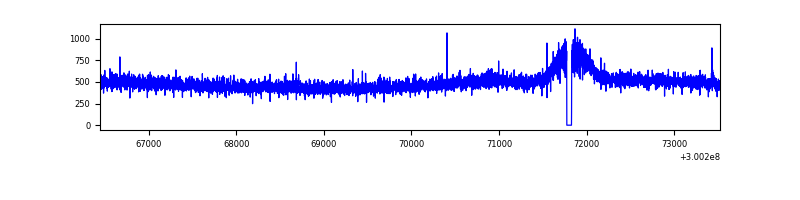 |
| D | 7073 | 7019 | 44 | 44 | 0.62% | 0.63% | 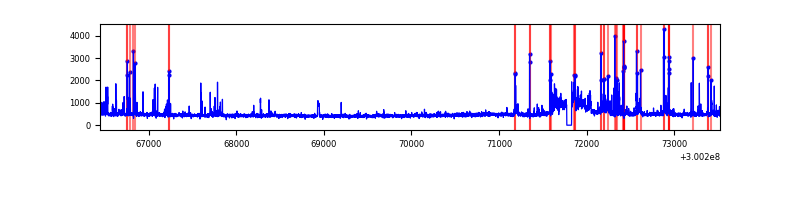 |
Top three noisy pixels from each quadrant. If the there are fewer than three noisy pixels in the level2.evt file, extra rows are filled as -1
| Pixel properties | Quadrant properties | ||||||
|---|---|---|---|---|---|---|---|
| Quadrant | DetID | PixID | Counts | Sigma | Mean | Median | Sigma |
| A | 8 | 205 | 28128 | 152.78 | 882 | 864 | 178.4 |
| A | 11 | 29 | 8195 | 41.08 | 882 | 864 | 178.4 |
| A | 0 | 226 | 7555 | 37.5 | 882 | 864 | 178.4 |
| B | 10 | 245 | 166081 | 981.56 | 867 | 843 | 168.3 |
| B | 0 | 189 | 42893 | 249.79 | 867 | 843 | 168.3 |
| B | 12 | 111 | 20653 | 117.68 | 867 | 843 | 168.3 |
| C | 14 | 238 | 131998 | 659.54 | 841 | 847 | 198.9 |
| C | 7 | 220 | 7884 | 35.39 | 841 | 847 | 198.9 |
| C | 3 | 233 | 6698 | 29.42 | 841 | 847 | 198.9 |
| D | 13 | 153 | 275898 | 1302.4 | 856 | 832 | 211.2 |
| D | 1 | 52 | 223569 | 1054.63 | 856 | 832 | 211.2 |
| D | 2 | 234 | 32308 | 149.03 | 856 | 832 | 211.2 |
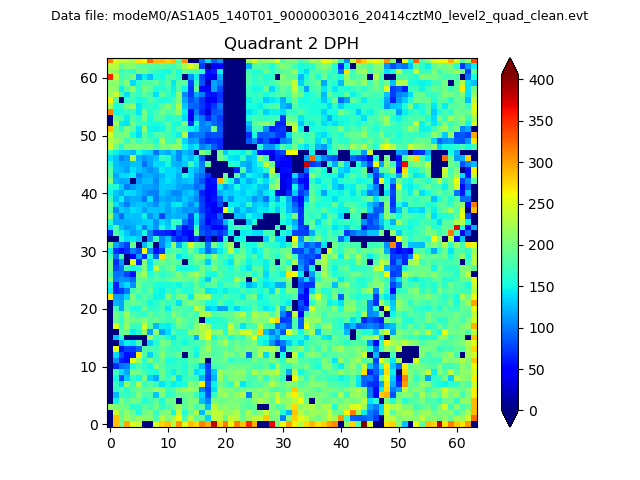
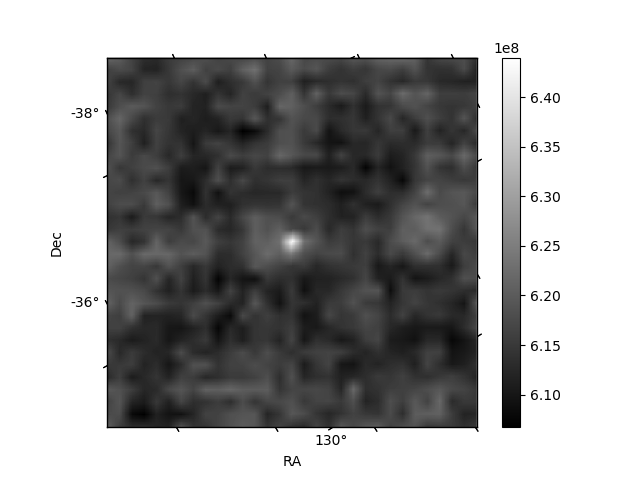
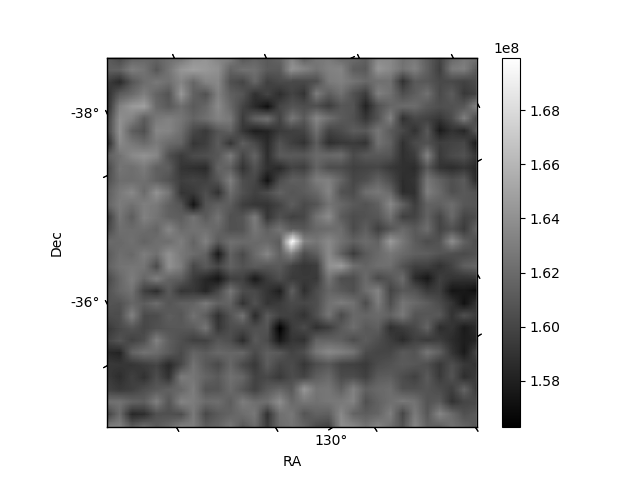
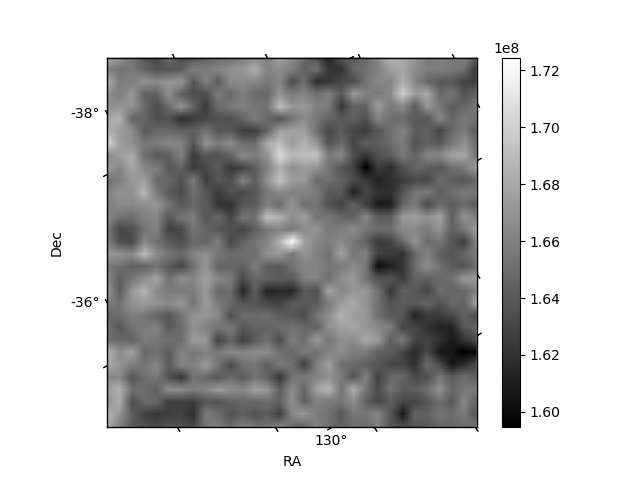
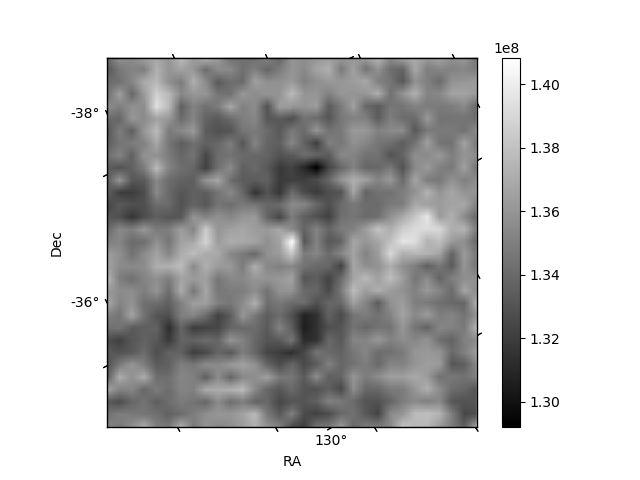
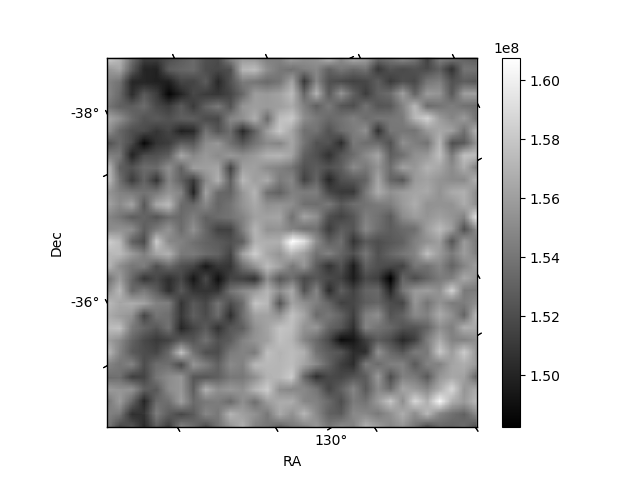
Histogram calculated using DETX and DETY for each event in the final _common_clean file
| Quadrant A | 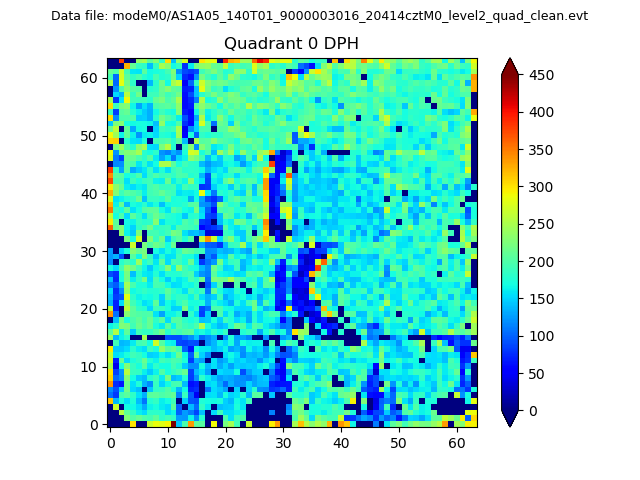 |
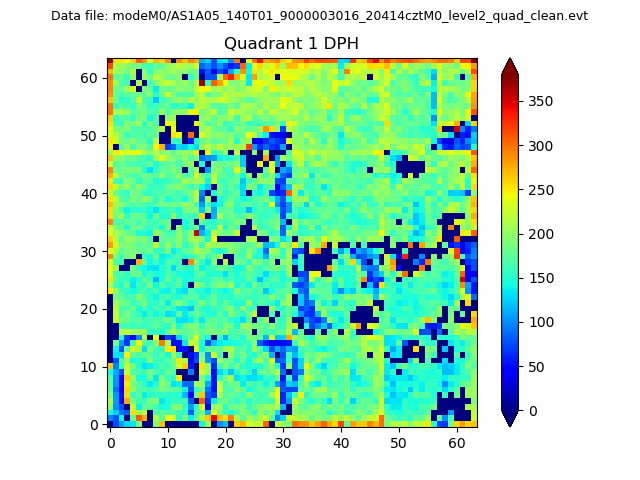 |
Quadrant B |
|---|---|---|---|
| Quadrant D | 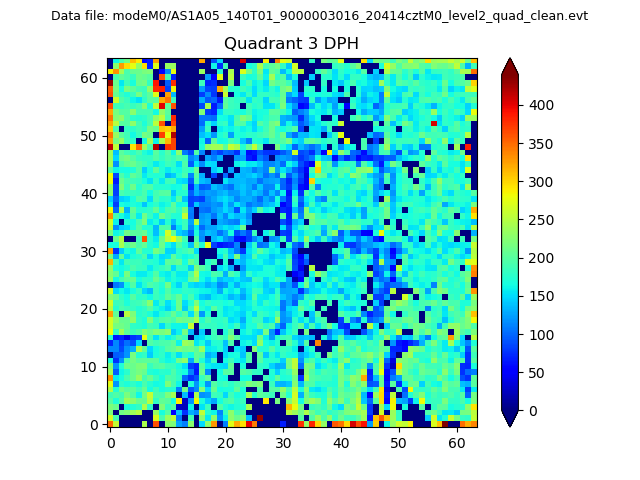 |
 |
Quadrant C |
| Plot type | Count rate plots | Images |
|---|---|---|
| Comparison with Poisson distribution Blue bars denote a histogram of data divided into 1 sec bins. Red curve is a Poisson curve with rate = median count rate of data. |
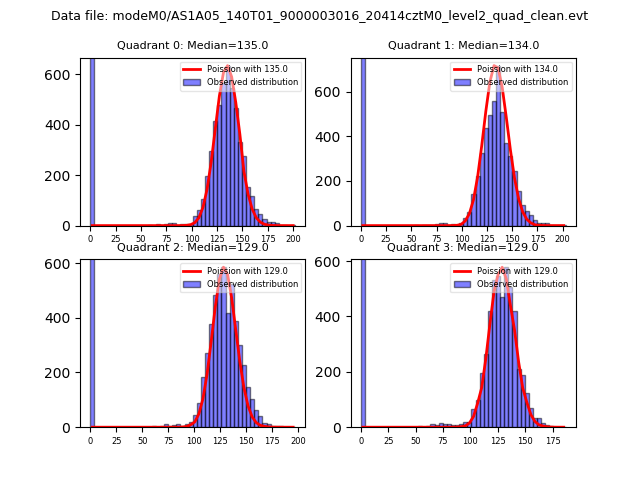 |
 |
| Quadrant-wise count rates Data is divided into 100 sec bins |
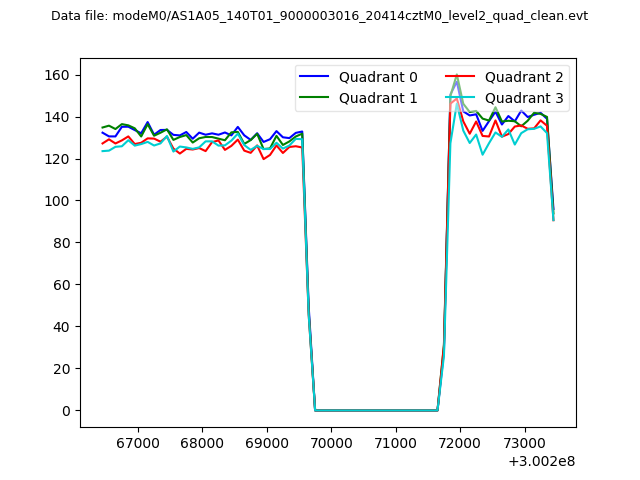 |
|
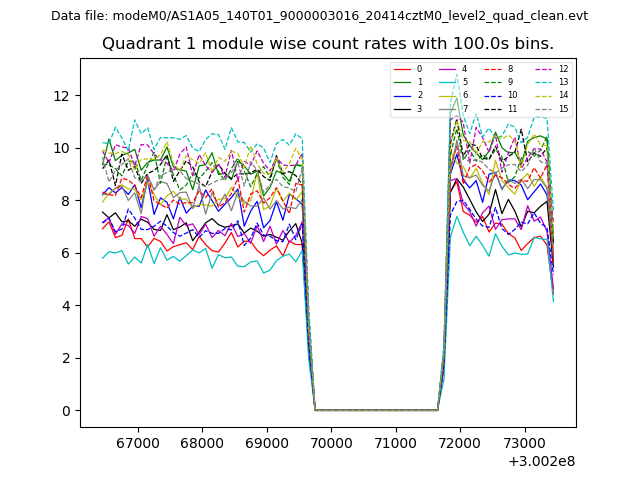
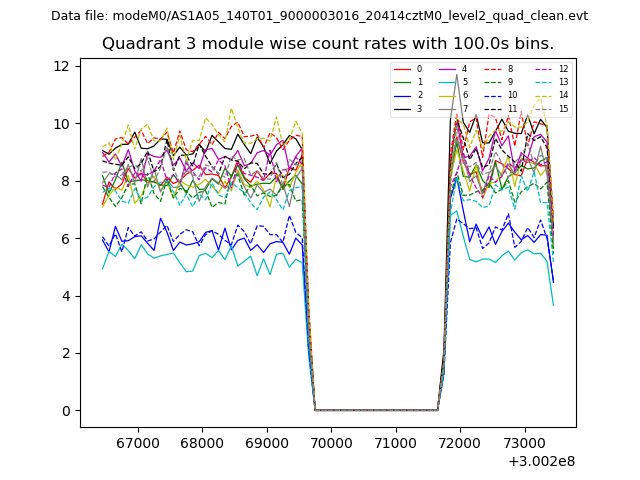
| Module-wise count rates for Quadrant A Data is divided into 100 sec bins |
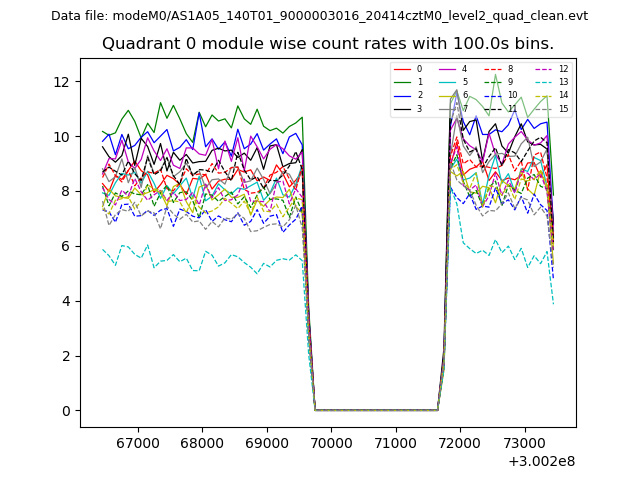 |
 |
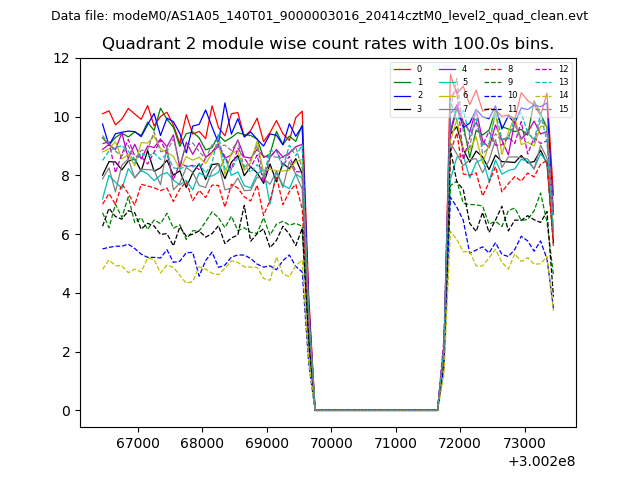
| Module-wise count rates for Quadrant B Data is divided into 100 sec bins |
 |
 |
| Module-wise count rates for Quadrant C Data is divided into 100 sec bins |
 |
 |
| Module-wise count rates for Quadrant D Data is divided into 100 sec bins |
 |
 |
| Parameter | Plot |
|---|---|
| CZT HV Monitor | 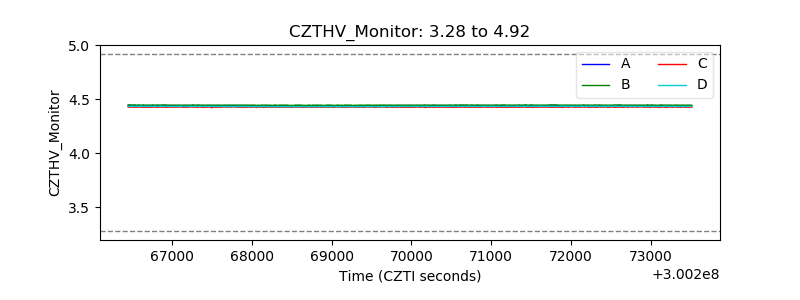 |
| D_VDD | 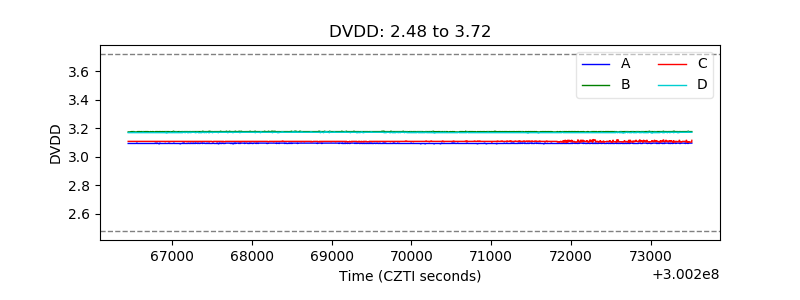 |
| Temperature 1 |  |
| Veto HV Monitor | 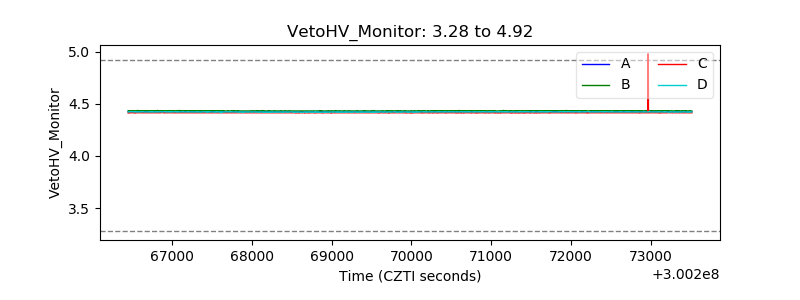 |
| Veto LLD |  |
| Alpha Counter | 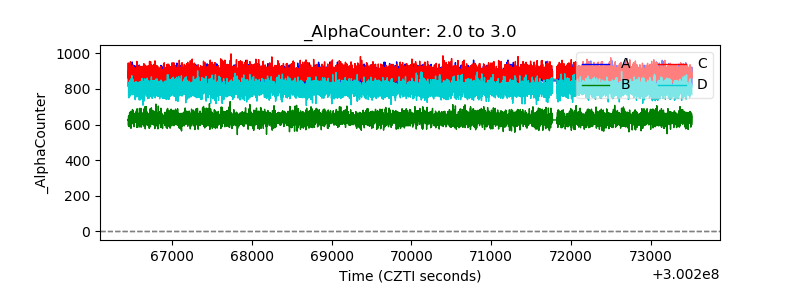 |
| _CPM_Rate | 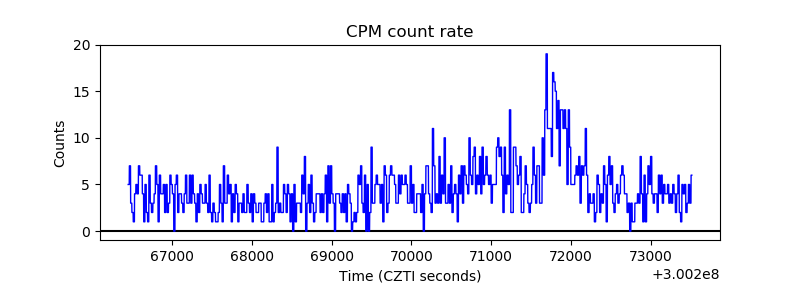 |
| CZT Counter | 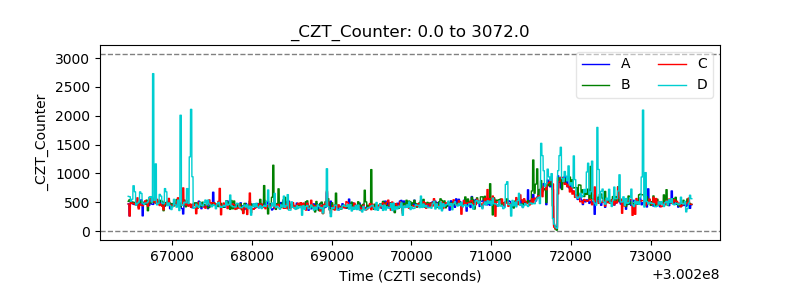 |
| +2.5 Volts monitor |  |
| +5 Volts monitor |  |
| _ROLL_ROT |  |
| _Roll_DEC |  |
| _Roll_RA | 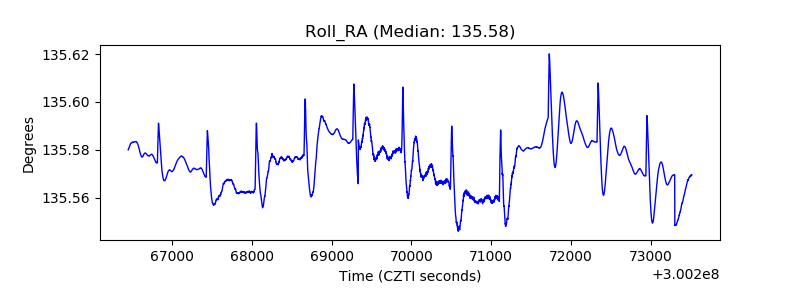 |
| Veto Counter |  |