| Param | Original file | Final file |
|---|---|---|
| Filename | modeM0/AS1A05_140T01_9000003016_20415cztM0_level2.evt | modeM0/AS1A05_140T01_9000003016_20415cztM0_level2_quad_clean.evt |
| Size (bytes) | 515,076,480 | 109,607,040 |
| Size | 491.2 MB | 104.5 MB |
| Events in quadrant A | 3,537,114 | 722,490 |
| Events in quadrant B | 3,832,559 | 716,958 |
| Events in quadrant C | 3,594,466 | 690,194 |
| Events in quadrant D | 4,134,554 | 676,833 |
| Mode SS | |||
|---|---|---|---|
| Quadrant | BADHDUFLAG | Total packets | Discarded packets |
| A | 0 | 150 | 0 |
| B | 0 | 150 | 0 |
| C | 0 | 150 | 0 |
| D | 0 | 150 | 0 |
| Mode M9 | |||
|---|---|---|---|
| Quadrant | BADHDUFLAG | Total packets | Discarded packets |
| A | 0 | 3 | 0 |
| B | 0 | 3 | 0 |
| C | 0 | 3 | 0 |
| D | 0 | 3 | 0 |
| Mode M0 | |||
|---|---|---|---|
| Quadrant | BADHDUFLAG | Total packets | Discarded packets |
| A | 0 | 15058 | 1 |
| B | 0 | 15985 | 1 |
| C | 0 | 15184 | 1 |
| D | 0 | 17129 | 2 |
| Quadrant | Total seconds | Saturated seconds | Saturation percentage |
|---|---|---|---|
| A | 7367 | 81 | 1.099498% |
| B | 7368 | 95 | 1.289359% |
| C | 7368 | 105 | 1.425081% |
| D | 7367 | 214 | 2.904846% |
Noise dominated data is calculated using 1-second bins in cleaned event files. If a bin has >2000 counts, and if more than 50% of those come from <1% of pixels, then it is considered to be noise-dominated and hence unusable.
| Quadrant | # 1 sec bins | Bins with >0 counts | Bins with >2000 counts | High rate bins dominated by noise | Noise dominated (total time) | Noise dominated (detector-on time) | Marked lightcurve |
|---|---|---|---|---|---|---|---|
| A | 7727 | 7367 | 0 | 0 | 0.00% | 0.00% | 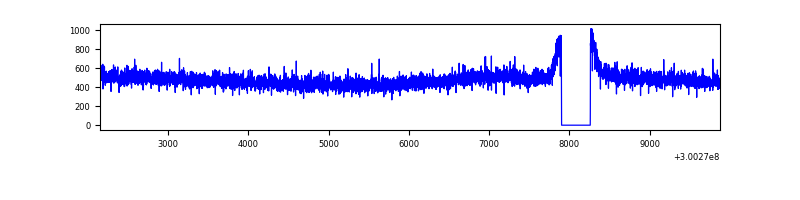 |
| B | 7728 | 7369 | 4 | 4 | 0.05% | 0.05% | 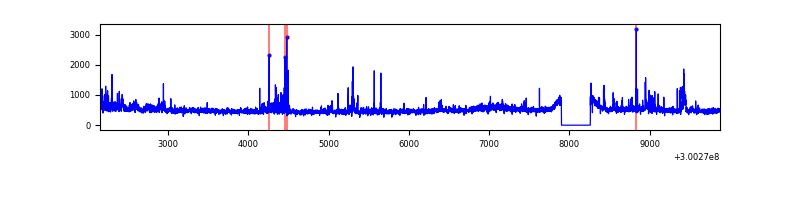 |
| C | 7728 | 7369 | 0 | 0 | 0.00% | 0.00% | 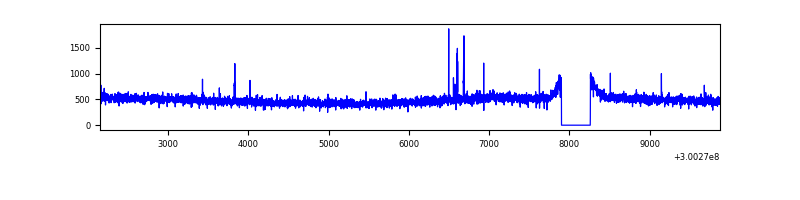 |
| D | 7727 | 7368 | 116 | 116 | 1.50% | 1.57% | 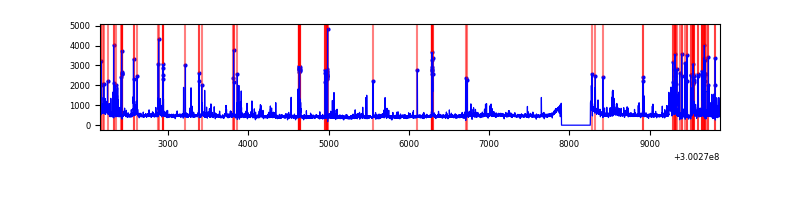 |
Top three noisy pixels from each quadrant. If the there are fewer than three noisy pixels in the level2.evt file, extra rows are filled as -1
| Pixel properties | Quadrant properties | ||||||
|---|---|---|---|---|---|---|---|
| Quadrant | DetID | PixID | Counts | Sigma | Mean | Median | Sigma |
| A | 0 | 226 | 7896 | 37.33 | 915 | 897 | 187.5 |
| A | 12 | 16 | 7699 | 36.28 | 915 | 897 | 187.5 |
| A | 12 | 194 | 7667 | 36.11 | 915 | 897 | 187.5 |
| B | 10 | 245 | 170078 | 976.89 | 900 | 880 | 173.2 |
| B | 7 | 220 | 49345 | 279.82 | 900 | 880 | 173.2 |
| B | 0 | 189 | 39081 | 220.56 | 900 | 880 | 173.2 |
| C | 14 | 238 | 136348 | 659.76 | 871 | 881 | 205.3 |
| C | 0 | 207 | 28447 | 134.25 | 871 | 881 | 205.3 |
| C | 8 | 128 | 11789 | 53.12 | 871 | 881 | 205.3 |
| D | 1 | 52 | 537817 | 2484.7 | 884 | 861 | 216.1 |
| D | 13 | 153 | 162789 | 749.3 | 884 | 861 | 216.1 |
| D | 2 | 153 | 44110 | 200.13 | 884 | 861 | 216.1 |
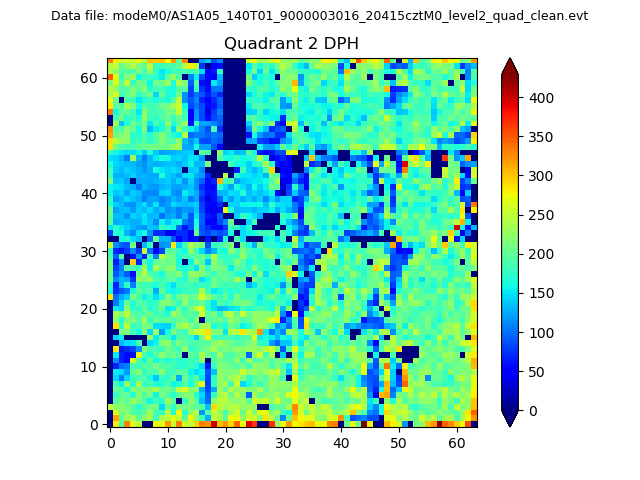
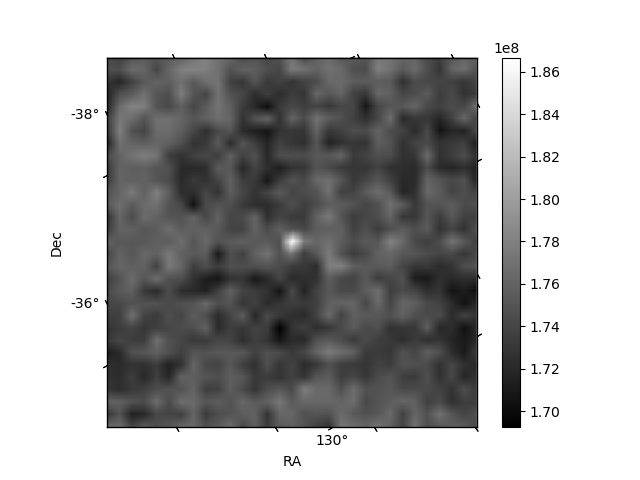
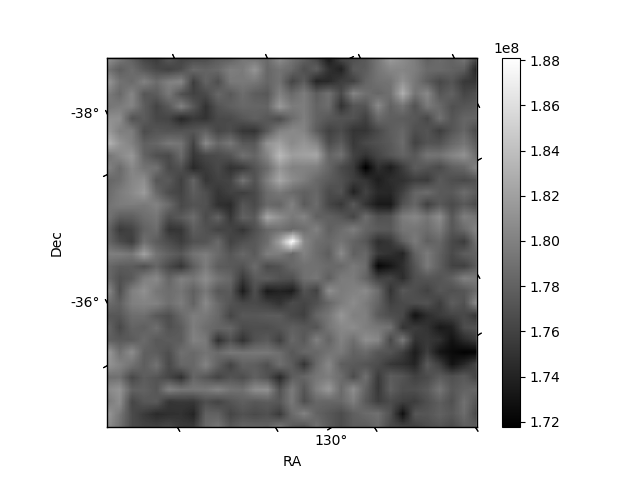
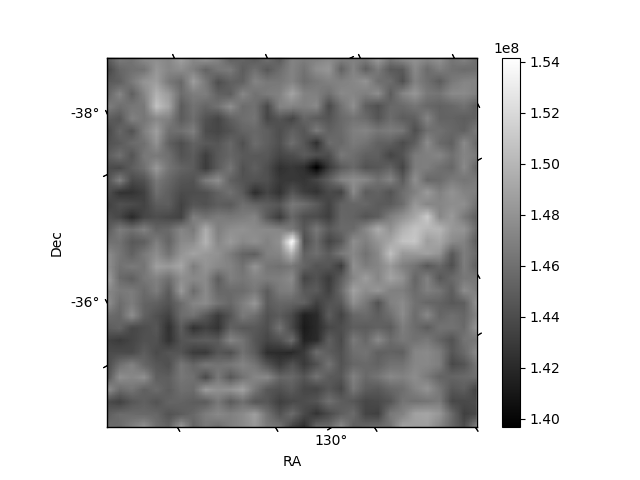
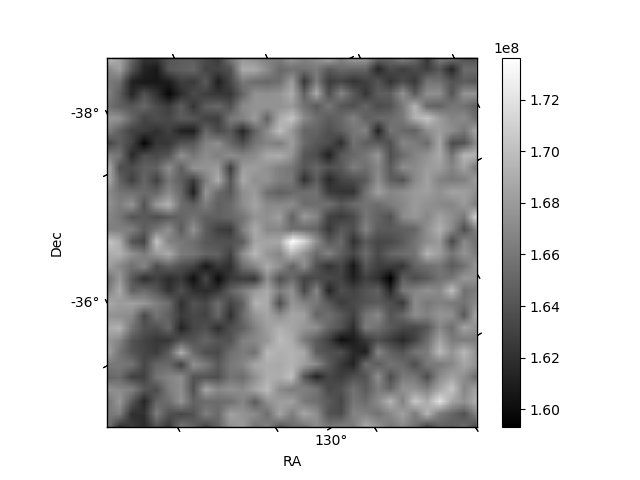
Histogram calculated using DETX and DETY for each event in the final _common_clean file
| Quadrant A | 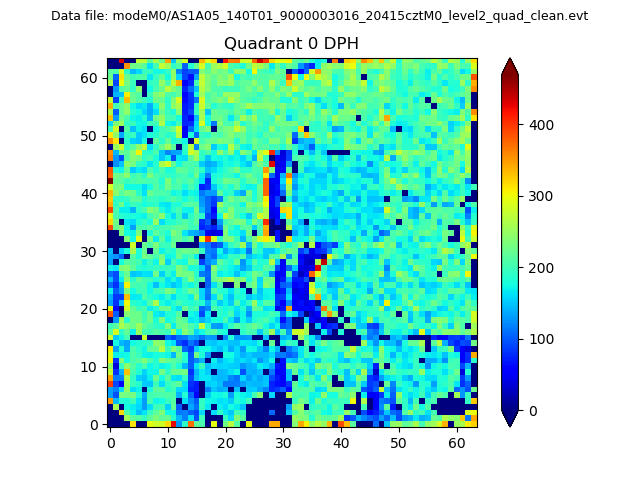 |
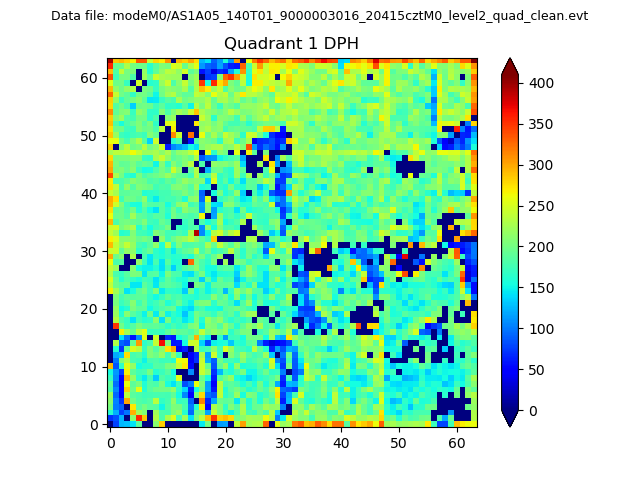 |
Quadrant B |
|---|---|---|---|
| Quadrant D | 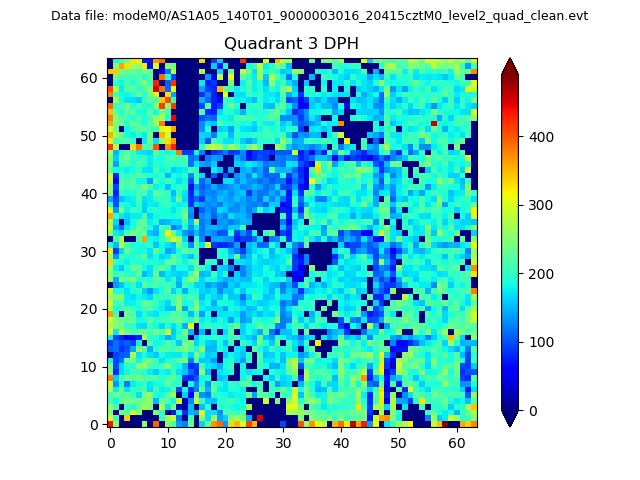 |
 |
Quadrant C |
| Plot type | Count rate plots | Images |
|---|---|---|
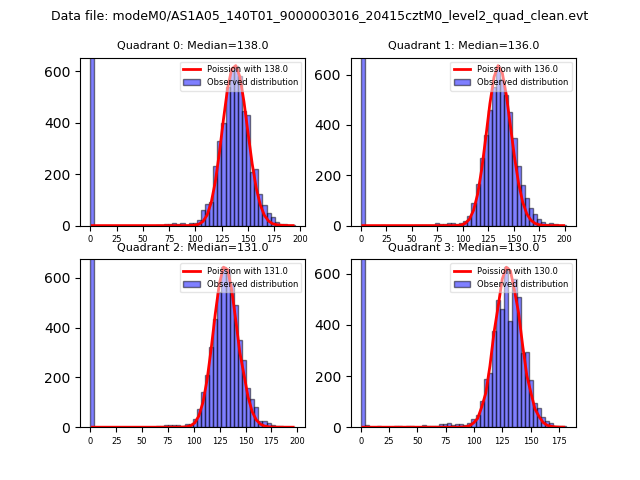
| Comparison with Poisson distribution Blue bars denote a histogram of data divided into 1 sec bins. Red curve is a Poisson curve with rate = median count rate of data. |
 |
 |
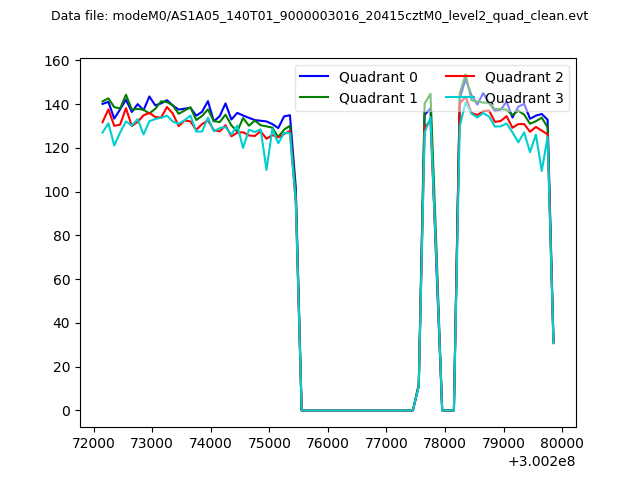
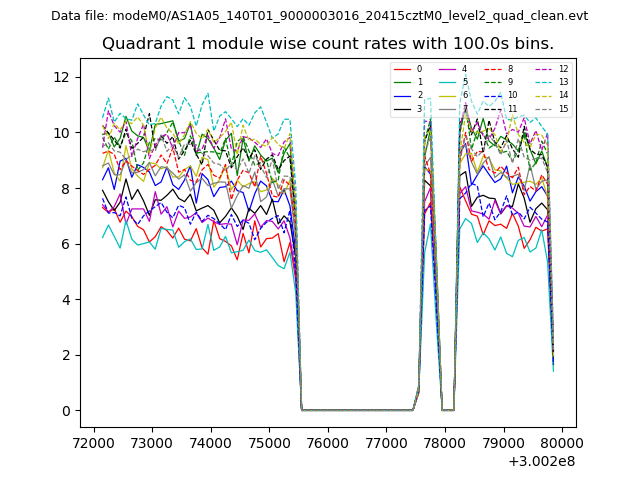
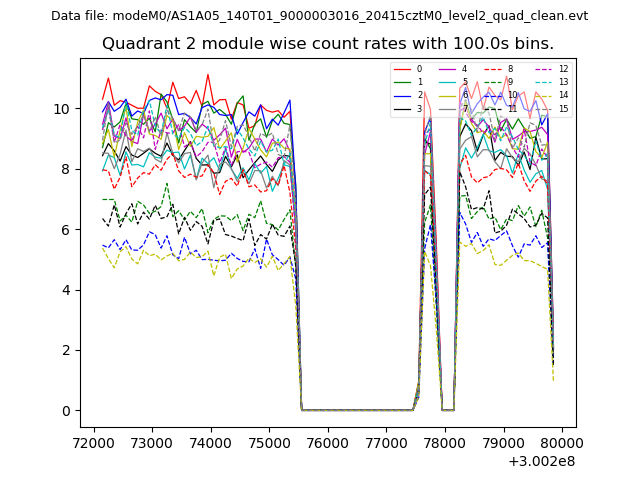
| Quadrant-wise count rates Data is divided into 100 sec bins |
 |
|
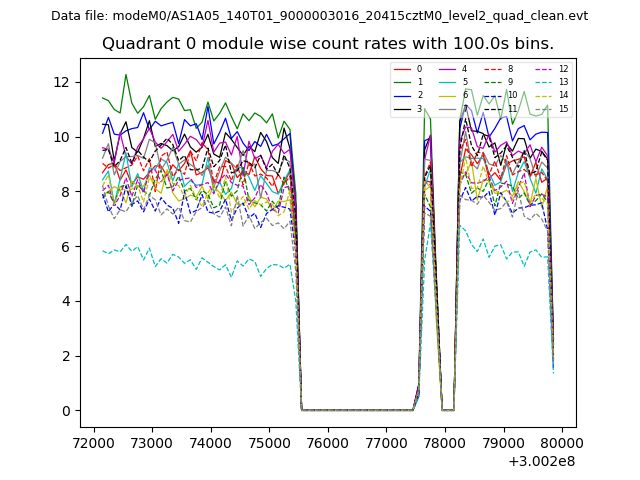
| Module-wise count rates for Quadrant A Data is divided into 100 sec bins |
 |
 |
| Module-wise count rates for Quadrant B Data is divided into 100 sec bins |
 |
 |
| Module-wise count rates for Quadrant C Data is divided into 100 sec bins |
 |
 |
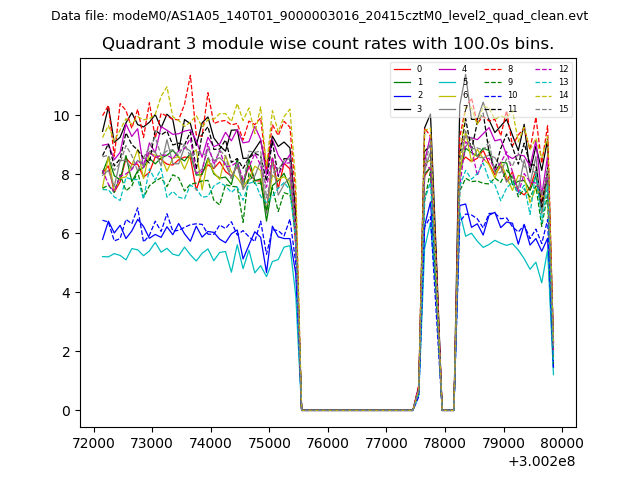
| Module-wise count rates for Quadrant D Data is divided into 100 sec bins |
 |
 |
| Parameter | Plot |
|---|---|
| CZT HV Monitor | 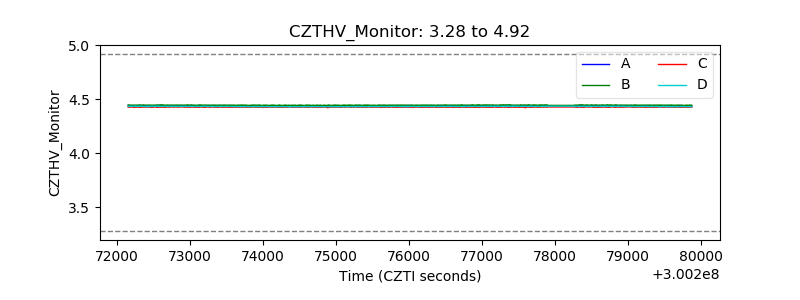 |
| D_VDD | 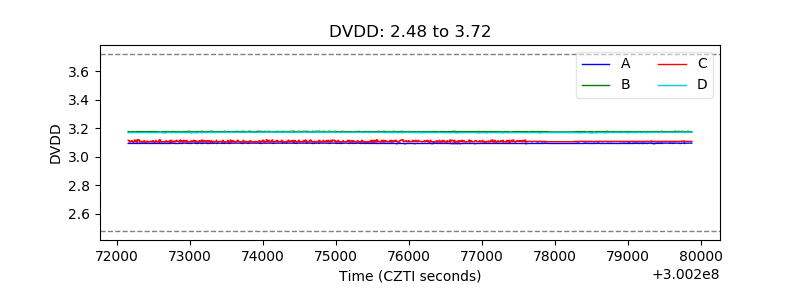 |
| Temperature 1 | 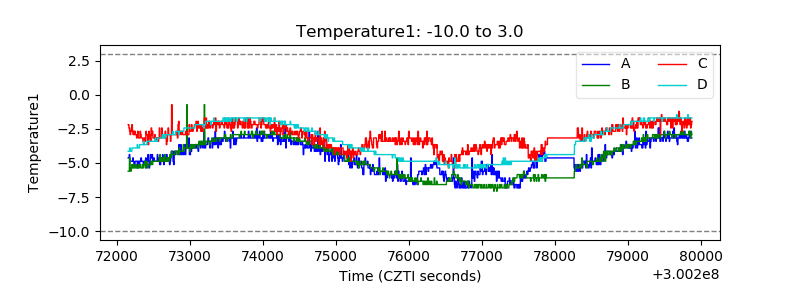 |
| Veto HV Monitor | 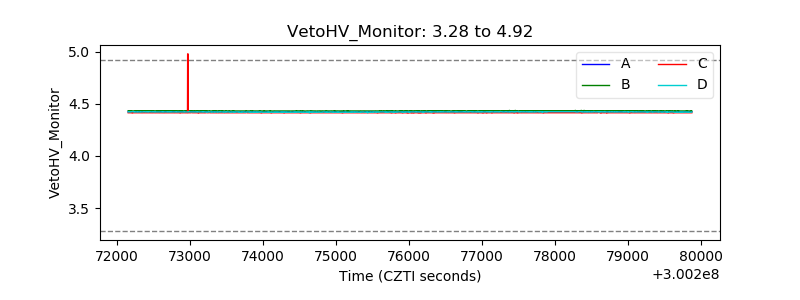 |
| Veto LLD | 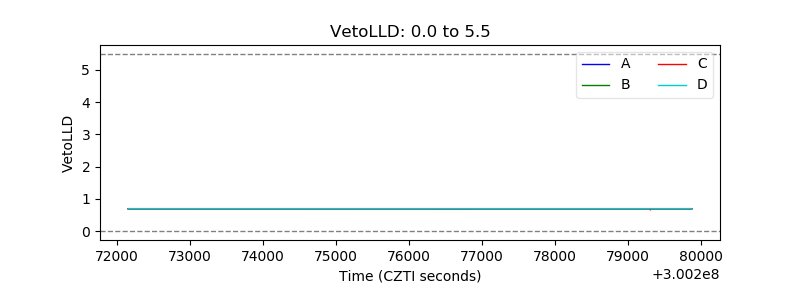 |
| Alpha Counter | 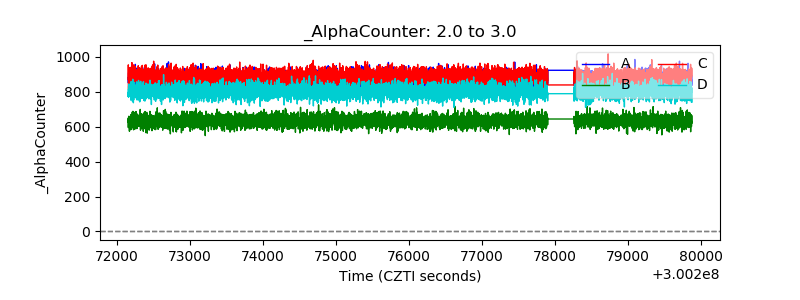 |
| _CPM_Rate | 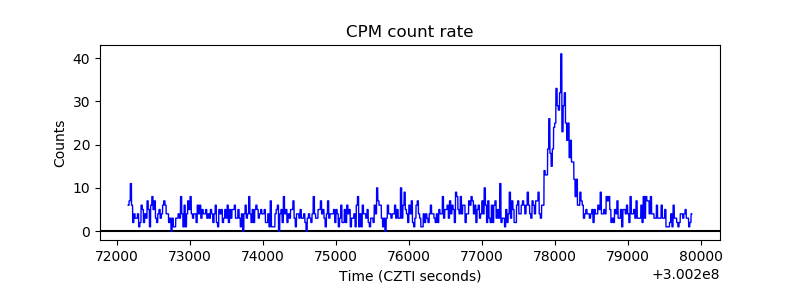 |
| CZT Counter | 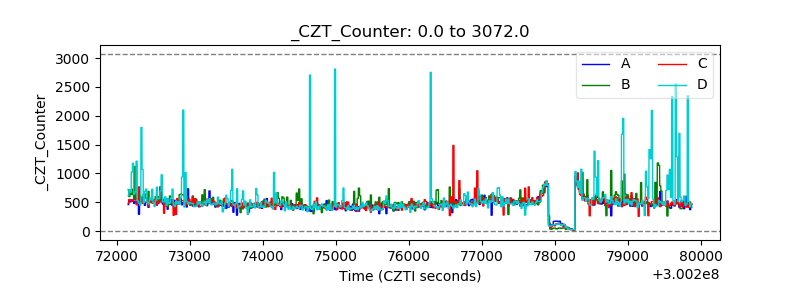 |
| +2.5 Volts monitor |  |
| +5 Volts monitor |  |
| _ROLL_ROT |  |
| _Roll_DEC | 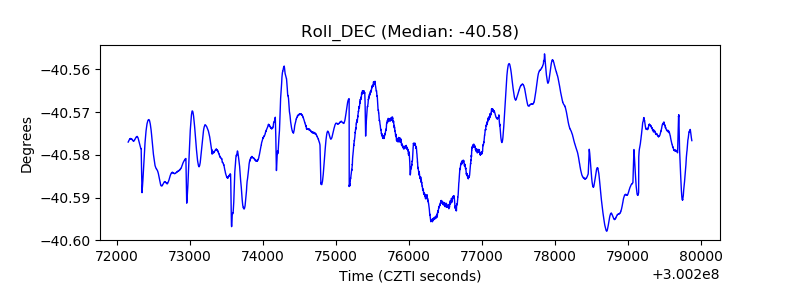 |
| _Roll_RA | 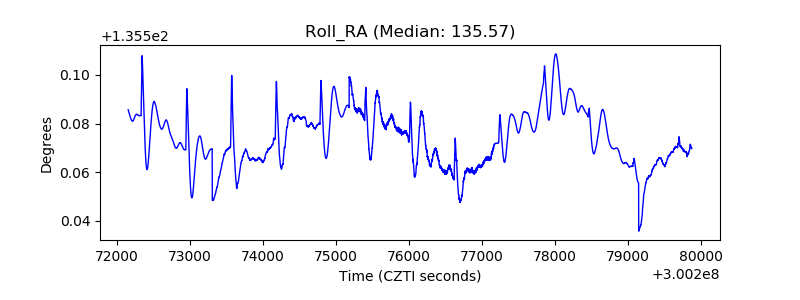 |
| Veto Counter |  |