| Param | Original file | Final file |
|---|---|---|
| Filename | modeM0/AS1A05_140T01_9000003016_20417cztM0_level2.evt | modeM0/AS1A05_140T01_9000003016_20417cztM0_level2_quad_clean.evt |
| Size (bytes) | 851,639,040 | 172,846,080 |
| Size | 812.2 MB | 164.8 MB |
| Events in quadrant A | 5,999,063 | 1,125,771 |
| Events in quadrant B | 6,338,257 | 1,115,420 |
| Events in quadrant C | 5,927,214 | 1,071,908 |
| Events in quadrant D | 6,684,186 | 1,061,115 |
| Mode SS | |||
|---|---|---|---|
| Quadrant | BADHDUFLAG | Total packets | Discarded packets |
| A | 0 | 252 | 0 |
| B | 0 | 252 | 0 |
| C | 0 | 252 | 0 |
| D | 0 | 252 | 0 |
| Mode M9 | |||
|---|---|---|---|
| Quadrant | BADHDUFLAG | Total packets | Discarded packets |
| A | 0 | 14 | 0 |
| B | 0 | 14 | 0 |
| C | 0 | 14 | 0 |
| D | 0 | 14 | 0 |
| Mode M0 | |||
|---|---|---|---|
| Quadrant | BADHDUFLAG | Total packets | Discarded packets |
| A | 0 | 25565 | 2 |
| B | 0 | 26620 | 2 |
| C | 0 | 25534 | 2 |
| D | 0 | 28198 | 2 |
| Quadrant | Total seconds | Saturated seconds | Saturation percentage |
|---|---|---|---|
| A | 12459 | 71 | 0.569869% |
| B | 12459 | 101 | 0.810659% |
| C | 12459 | 107 | 0.858817% |
| D | 12459 | 215 | 1.725660% |
Noise dominated data is calculated using 1-second bins in cleaned event files. If a bin has >2000 counts, and if more than 50% of those come from <1% of pixels, then it is considered to be noise-dominated and hence unusable.
| Quadrant | # 1 sec bins | Bins with >0 counts | Bins with >2000 counts | High rate bins dominated by noise | Noise dominated (total time) | Noise dominated (detector-on time) | Marked lightcurve |
|---|---|---|---|---|---|---|---|
| A | 13824 | 12461 | 0 | 0 | 0.00% | 0.00% |  |
| B | 13824 | 12461 | 10 | 10 | 0.07% | 0.08% | 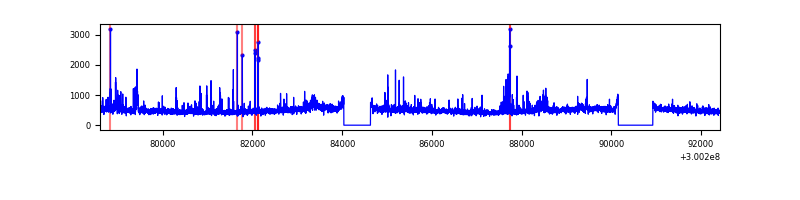 |
| C | 13824 | 12461 | 0 | 0 | 0.00% | 0.00% | 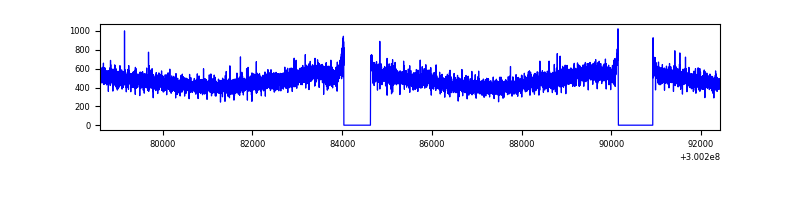 |
| D | 13824 | 12461 | 178 | 178 | 1.29% | 1.43% | 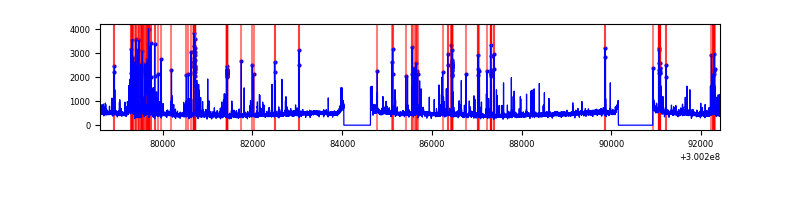 |
Top three noisy pixels from each quadrant. If the there are fewer than three noisy pixels in the level2.evt file, extra rows are filled as -1
| Pixel properties | Quadrant properties | ||||||
|---|---|---|---|---|---|---|---|
| Quadrant | DetID | PixID | Counts | Sigma | Mean | Median | Sigma |
| A | 12 | 16 | 131297 | 427.85 | 1520 | 1490 | 303.4 |
| A | 12 | 194 | 30869 | 96.83 | 1520 | 1490 | 303.4 |
| A | 0 | 226 | 13005 | 37.95 | 1520 | 1490 | 303.4 |
| B | 10 | 245 | 315049 | 1080.0 | 1499 | 1461 | 290.4 |
| B | 0 | 189 | 77904 | 263.27 | 1499 | 1461 | 290.4 |
| B | 12 | 111 | 35328 | 116.64 | 1499 | 1461 | 290.4 |
| C | 14 | 238 | 227574 | 670.25 | 1442 | 1455 | 337.4 |
| C | 3 | 233 | 48892 | 140.61 | 1442 | 1455 | 337.4 |
| C | 7 | 220 | 17287 | 46.93 | 1442 | 1455 | 337.4 |
| D | 1 | 52 | 885707 | 2475.02 | 1469 | 1432 | 357.3 |
| D | 13 | 153 | 104462 | 288.37 | 1469 | 1432 | 357.3 |
| D | 2 | 16 | 88289 | 243.11 | 1469 | 1432 | 357.3 |
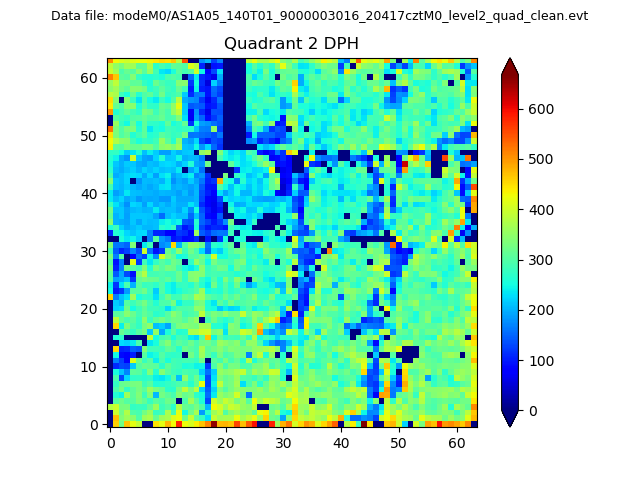
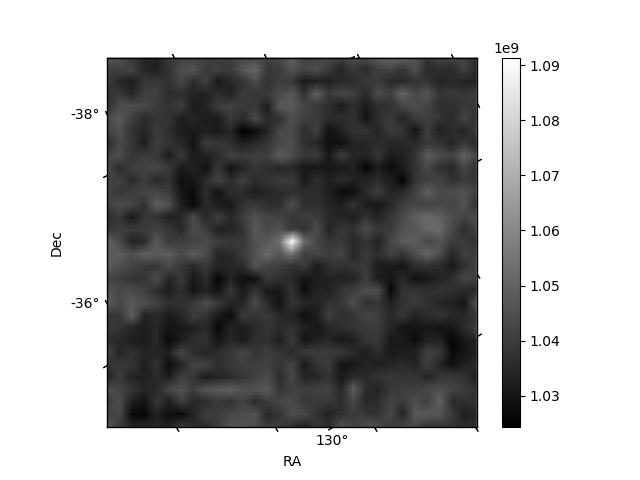
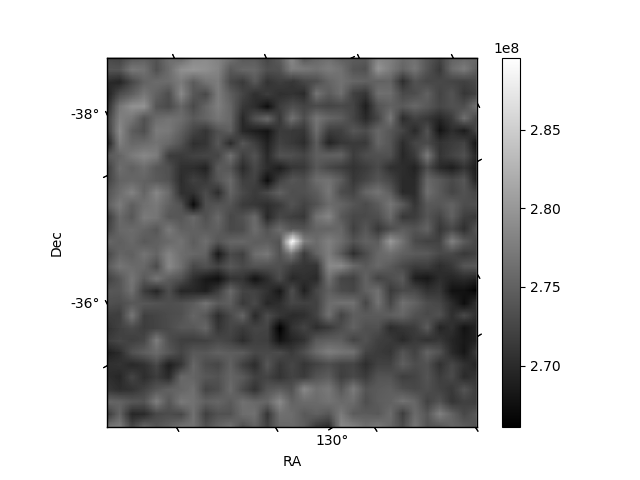
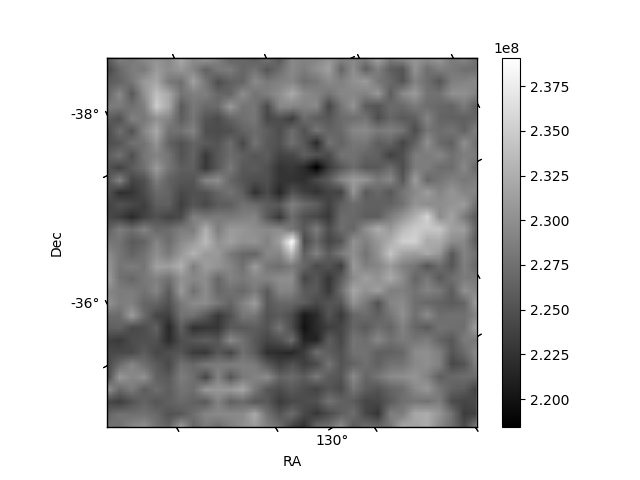
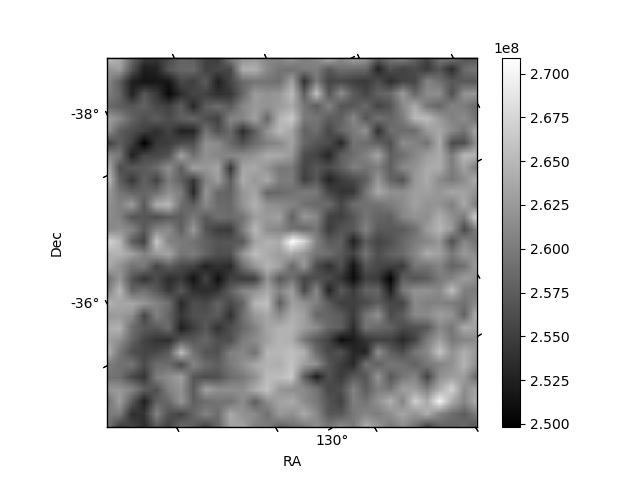
Histogram calculated using DETX and DETY for each event in the final _common_clean file
| Quadrant A |  |
 |
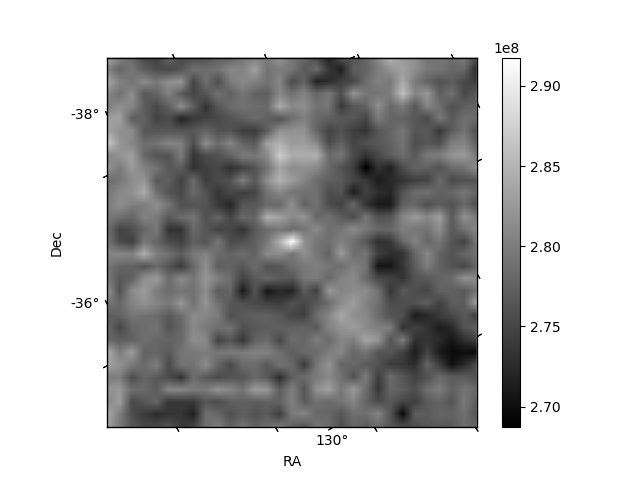
Quadrant B |
|---|---|---|---|
| Quadrant D |  |
 |
Quadrant C |
| Plot type | Count rate plots | Images |
|---|---|---|
| Comparison with Poisson distribution Blue bars denote a histogram of data divided into 1 sec bins. Red curve is a Poisson curve with rate = median count rate of data. |
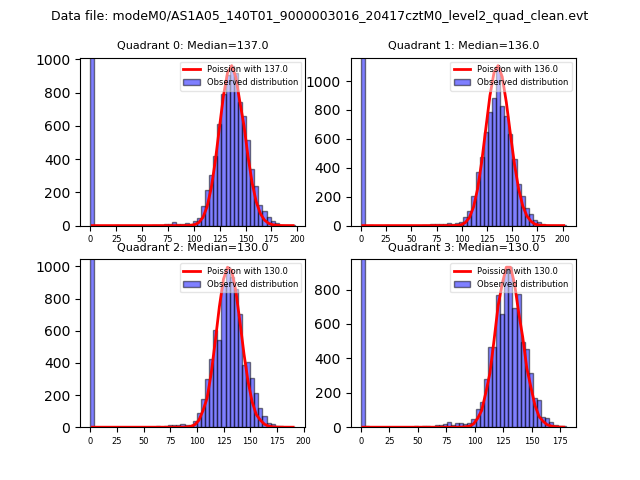 |
 |
| Quadrant-wise count rates Data is divided into 100 sec bins |
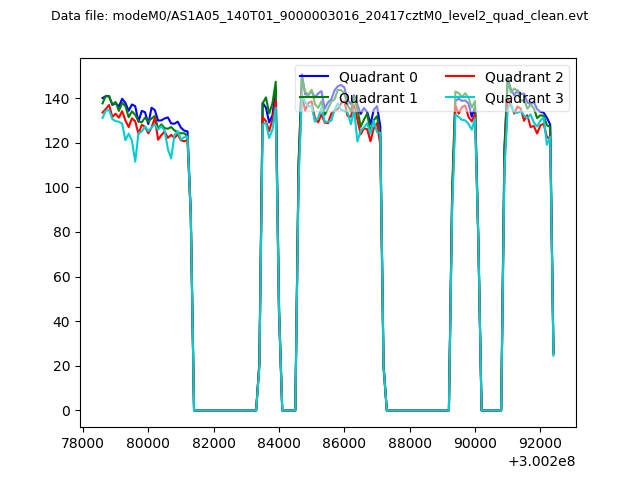 |
|
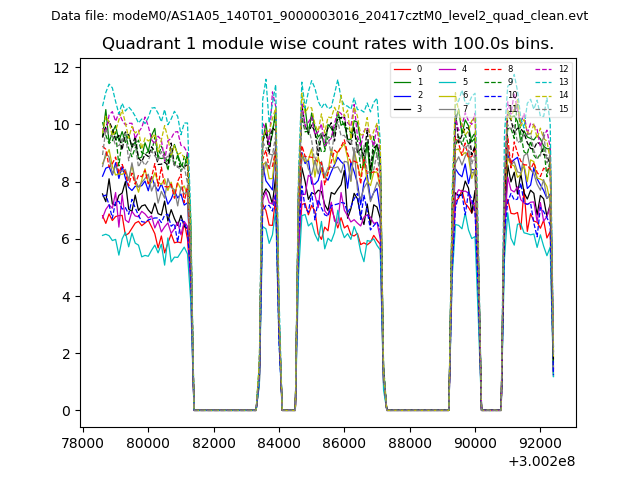
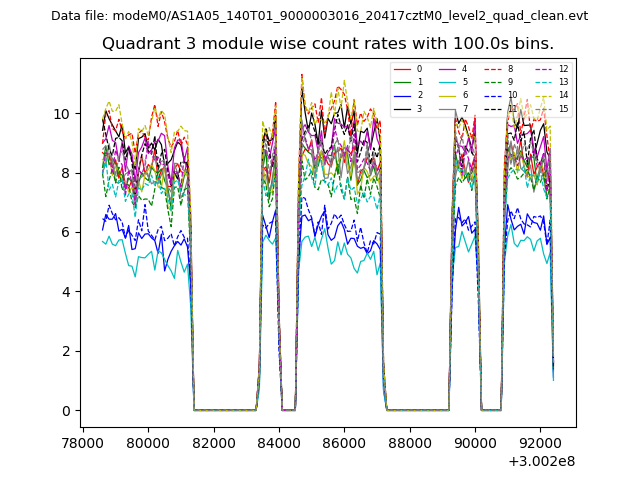
| Module-wise count rates for Quadrant A Data is divided into 100 sec bins |
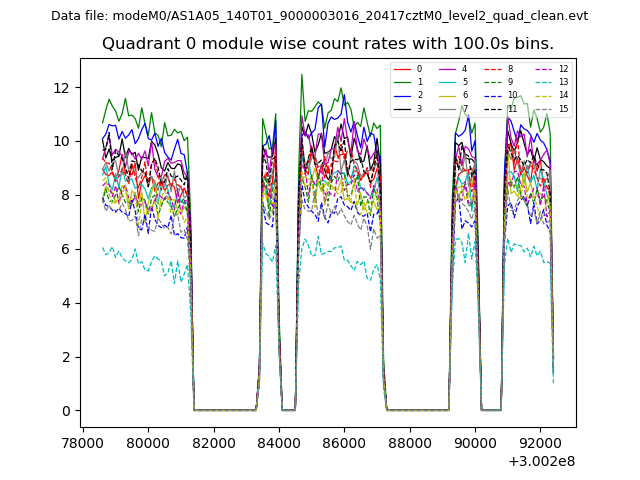 |
 |
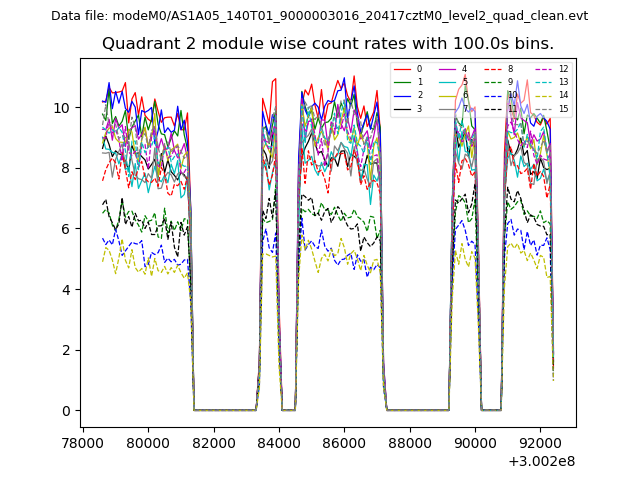
| Module-wise count rates for Quadrant B Data is divided into 100 sec bins |
 |
 |
| Module-wise count rates for Quadrant C Data is divided into 100 sec bins |
 |
 |
| Module-wise count rates for Quadrant D Data is divided into 100 sec bins |
 |
 |
| Parameter | Plot |
|---|---|
| CZT HV Monitor | 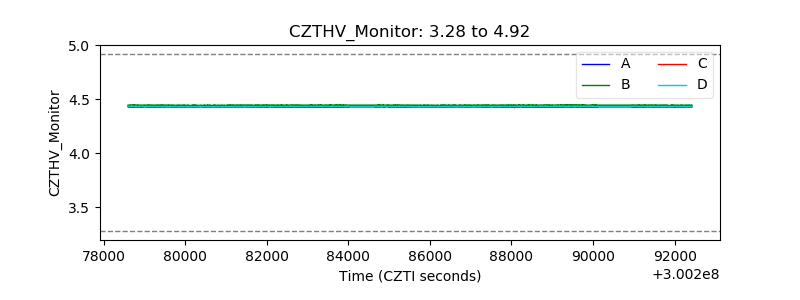 |
| D_VDD | 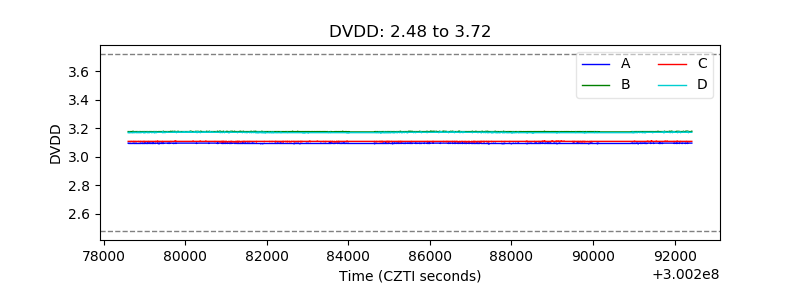 |
| Temperature 1 | 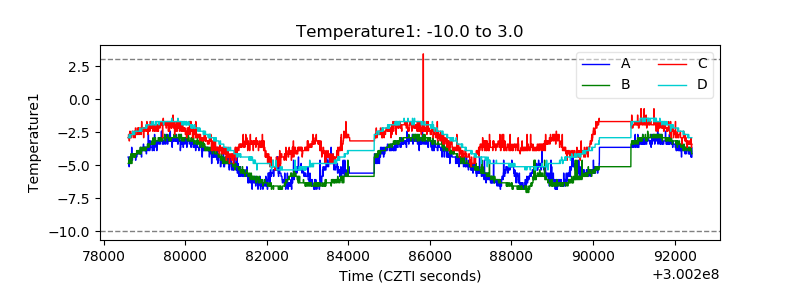 |
| Veto HV Monitor | 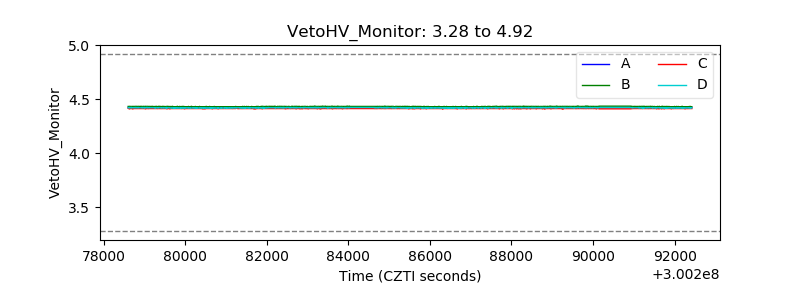 |
| Veto LLD |  |
| Alpha Counter | 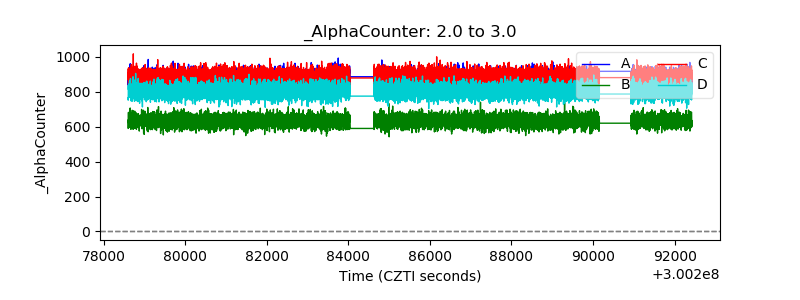 |
| _CPM_Rate | 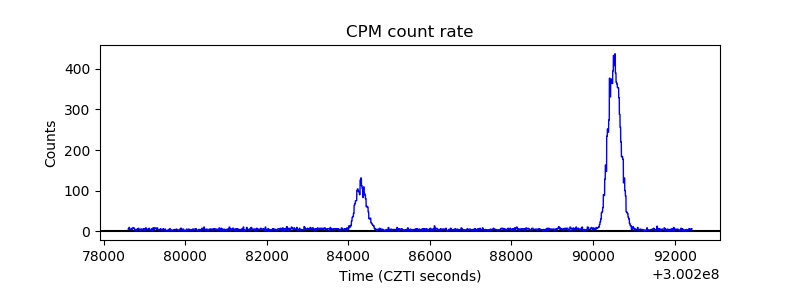 |
| CZT Counter | 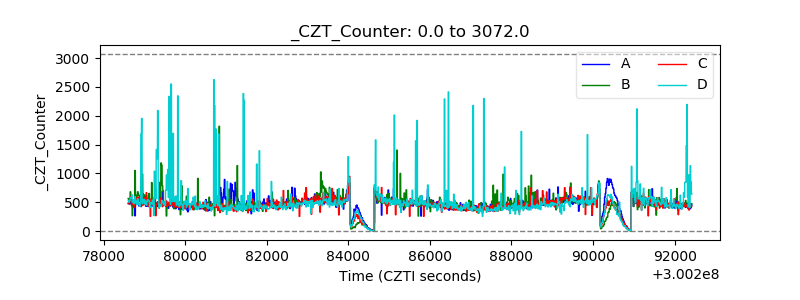 |
| +2.5 Volts monitor |  |
| +5 Volts monitor | 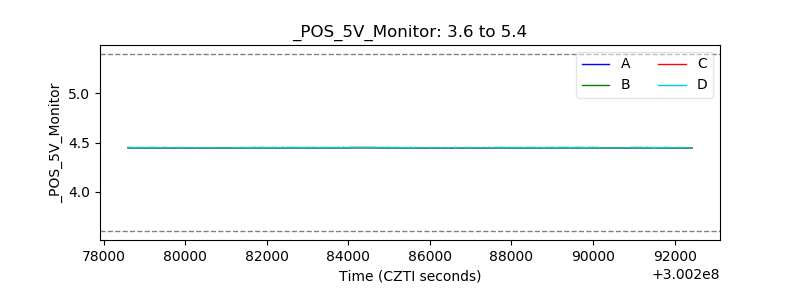 |
| _ROLL_ROT | 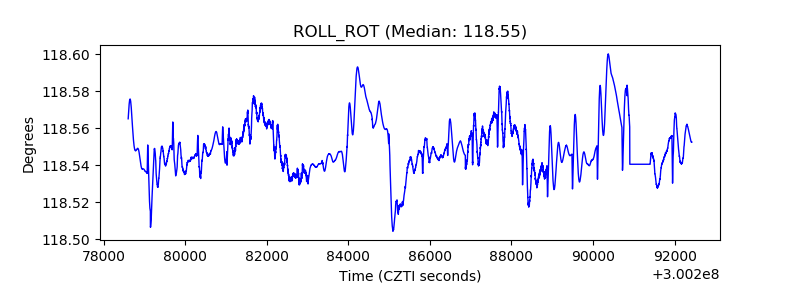 |
| _Roll_DEC | 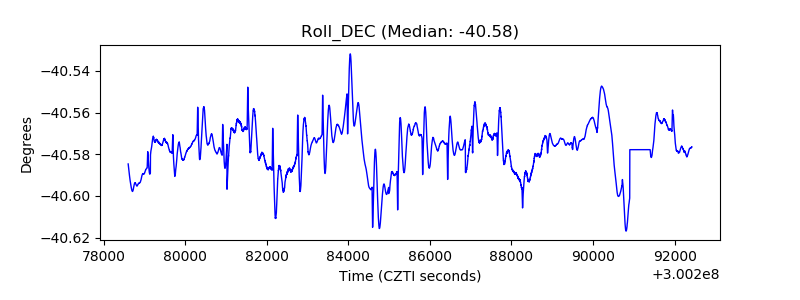 |
| _Roll_RA | 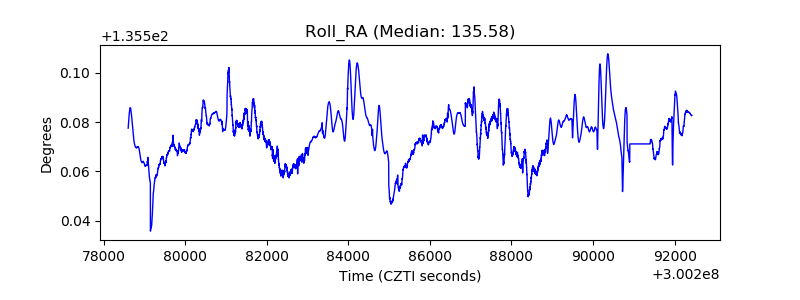 |
| Veto Counter | 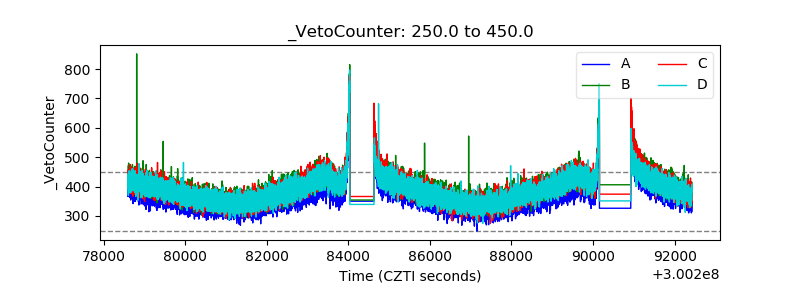 |