| Param | Original file | Final file |
|---|---|---|
| Filename | modeM0/AS1A05_188T01_9000003018cztM0_level2.fits | modeM0/AS1A05_188T01_9000003018cztM0_level2_quad_clean.evt |
| Size (bytes) | 1,057,766,400 | 835,104,960 |
| Size | 1008.8 MB | 796.4 MB |
| Events in quadrant A | 6,617,370 | 4,805,945 |
| Events in quadrant B | 6,366,744 | 4,784,482 |
| Events in quadrant C | 6,438,342 | 4,560,734 |
| Events in quadrant D | 5,519,864 | 4,045,169 |
| Mode SS | |||
|---|---|---|---|
| Quadrant | BADHDUFLAG | Total packets | Discarded packets |
| A | 0 | 2110 | 0 |
| B | 0 | 2110 | 0 |
| C | 0 | 2110 | 0 |
| D | 0 | 2110 | 0 |
| Mode M9 | |||
|---|---|---|---|
| Quadrant | BADHDUFLAG | Total packets | Discarded packets |
| A | 0 | 190 | 0 |
| B | 0 | 190 | 0 |
| C | 0 | 190 | 0 |
| D | 0 | 190 | 0 |
| Mode M0 | |||
|---|---|---|---|
| Quadrant | BADHDUFLAG | Total packets | Discarded packets |
| A | 0 | 215641 | 0 |
| B | 0 | 225166 | 0 |
| C | 0 | 215406 | 0 |
| D | 0 | 278433 | 0 |
| Quadrant | Total seconds | Saturated seconds | Saturation percentage |
|---|---|---|---|
| A | 103466 | 1093 | 1.056386% |
| B | 103466 | 1622 | 1.567665% |
| C | 103466 | 1469 | 1.419790% |
| D | 103466 | 5699 | 5.508090% |
Noise dominated data is calculated using 1-second bins in cleaned event files. If a bin has >2000 counts, and if more than 50% of those come from <1% of pixels, then it is considered to be noise-dominated and hence unusable.
| Quadrant | # 1 sec bins | Bins with >0 counts | Bins with >2000 counts | High rate bins dominated by noise | Noise dominated (total time) | Noise dominated (detector-on time) | Marked lightcurve |
|---|---|---|---|---|---|---|---|
| A | 122301 | 103458 | 0 | 0 | 0.00% | 0.00% | 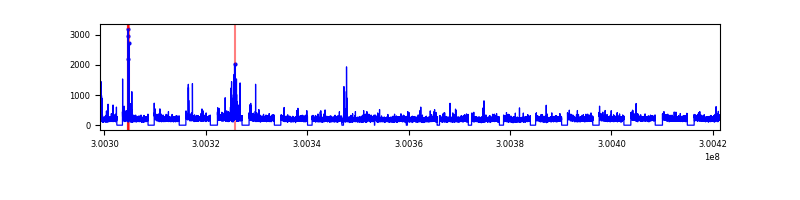 |
| B | 122300 | 103460 | 0 | 0 | 0.00% | 0.00% | 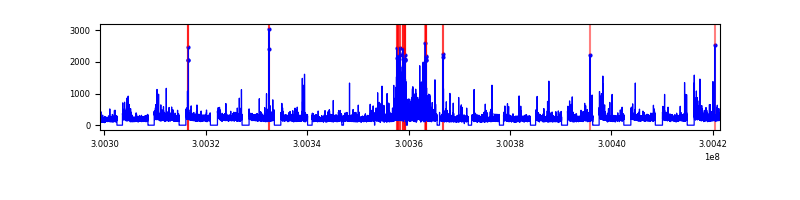 |
| C | 122301 | 103463 | 0 | 0 | 0.00% | 0.00% | 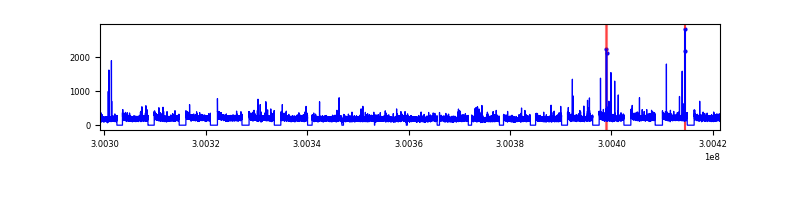 |
| D | 122301 | 103420 | 0 | 0 | 0.00% | 0.00% |  |
Top three noisy pixels from each quadrant. If the there are fewer than three noisy pixels in the level2.evt file, extra rows are filled as -1
| Pixel properties | Quadrant properties | ||||||
|---|---|---|---|---|---|---|---|
| Quadrant | DetID | PixID | Counts | Sigma | Mean | Median | Sigma |
| A | 0 | 29 | 6285 | 11.17 | 1722 | 1626 | 417.2 |
| A | 7 | 110 | 5255 | 8.7 | 1722 | 1626 | 417.2 |
| A | 9 | 19 | 5053 | 8.21 | 1722 | 1626 | 417.2 |
| B | 2 | 9 | 5120 | 10.82 | 1681 | 1612 | 324.2 |
| B | 2 | 8 | 4224 | 8.06 | 1681 | 1612 | 324.2 |
| B | 5 | 128 | 4083 | 7.62 | 1681 | 1612 | 324.2 |
| C | 1 | 81 | 4816 | 7.53 | 1700 | 1596 | 427.7 |
| C | 1 | 80 | 4706 | 7.27 | 1700 | 1596 | 427.7 |
| C | 3 | 126 | 4360 | 6.46 | 1700 | 1596 | 427.7 |
| D | 3 | 14 | 4021 | 6.24 | 1574 | 1441 | 413.3 |
| D | 6 | 231 | 3932 | 6.03 | 1574 | 1441 | 413.3 |
| D | 7 | 3 | 3930 | 6.02 | 1574 | 1441 | 413.3 |
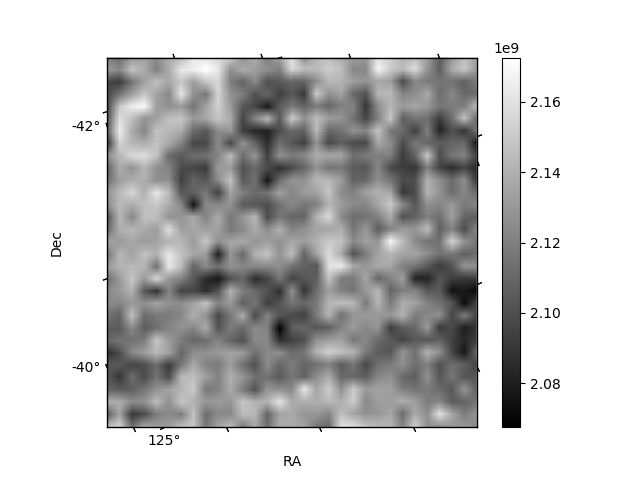
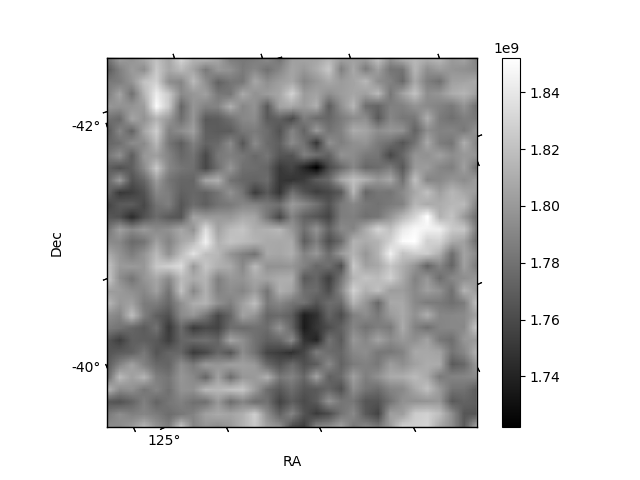
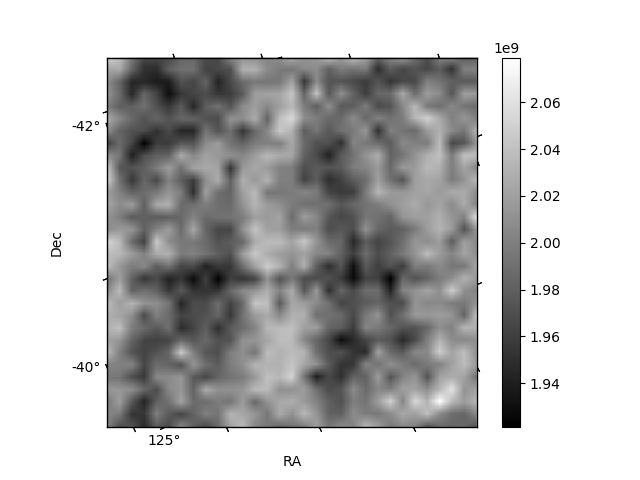
Histogram calculated using DETX and DETY for each event in the final _common_clean file
| Quadrant A | 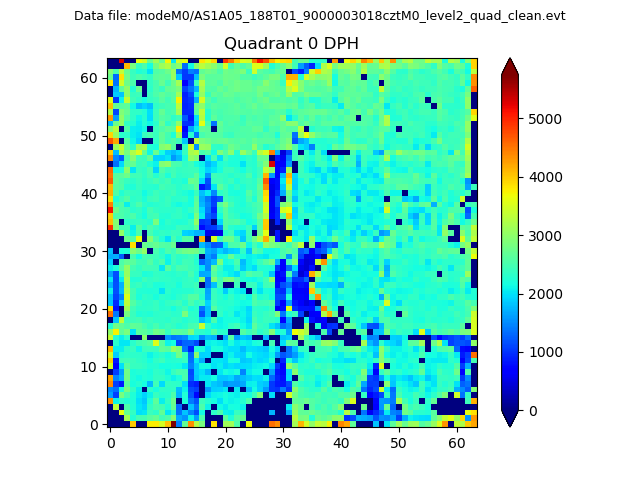 |
 |
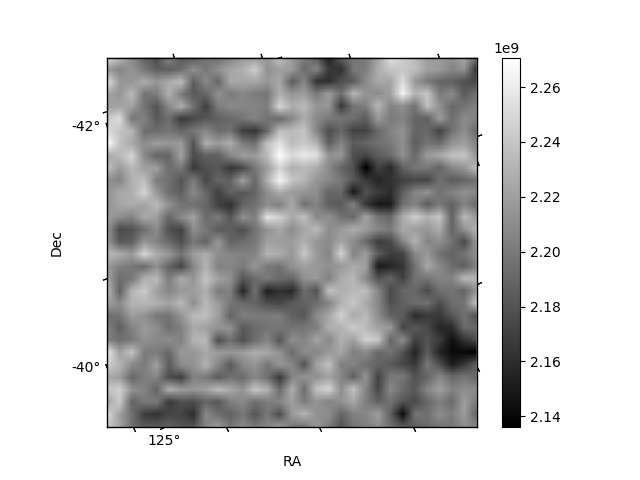
Quadrant B |
|---|---|---|---|
| Quadrant D |  |
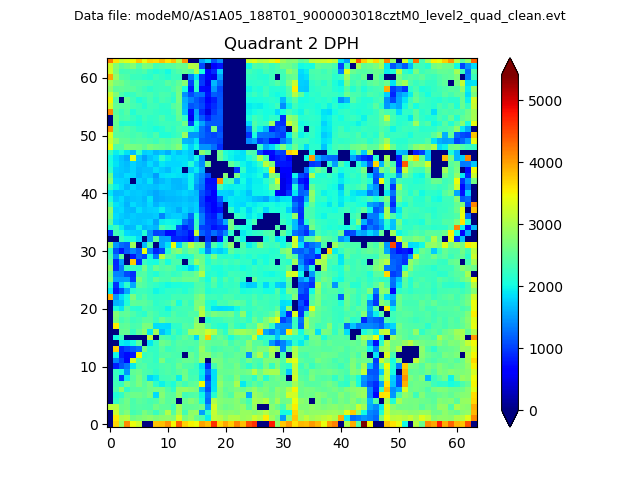 |
Quadrant C |
| Plot type | Count rate plots | Images |
|---|---|---|
| Comparison with Poisson distribution Blue bars denote a histogram of data divided into 1 sec bins. Red curve is a Poisson curve with rate = median count rate of data. |
 |
 |
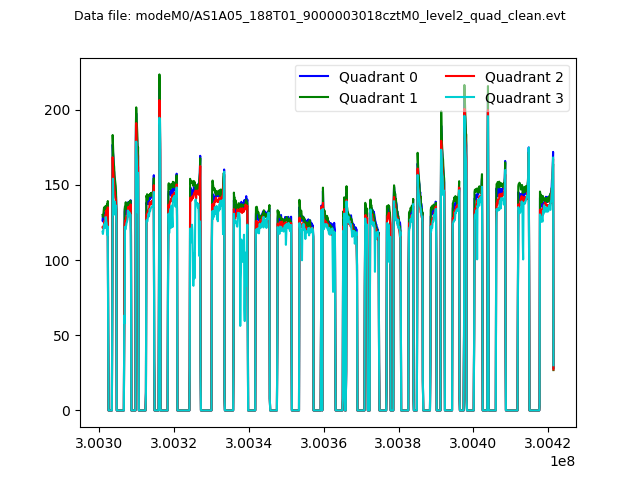
| Quadrant-wise count rates Data is divided into 100 sec bins |
 |
|
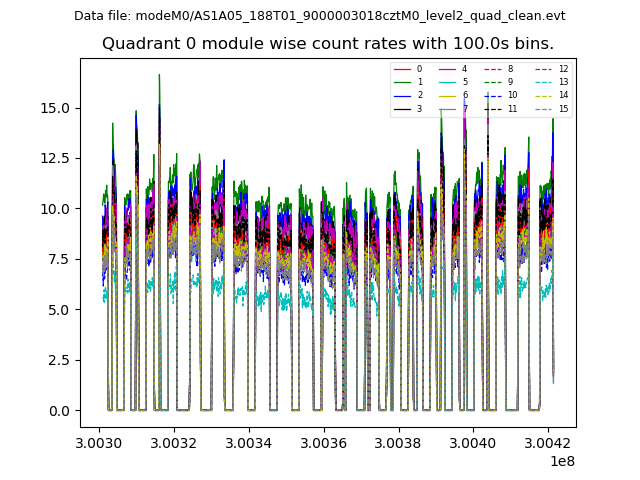
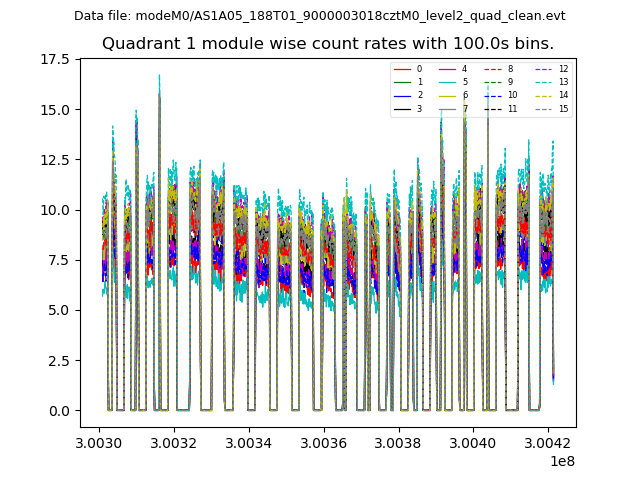
| Module-wise count rates for Quadrant A Data is divided into 100 sec bins |
 |
 |
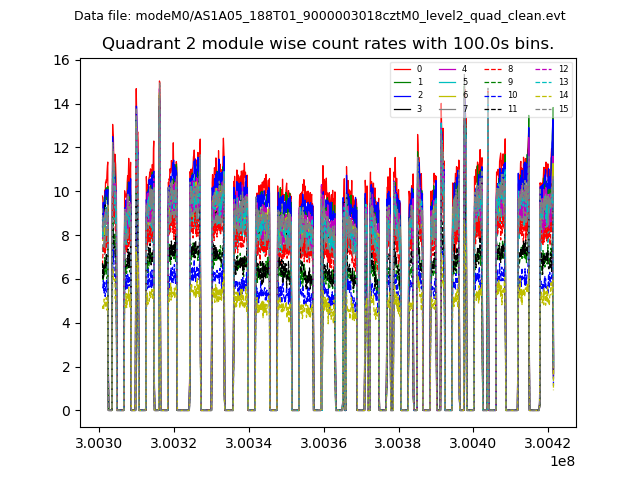
| Module-wise count rates for Quadrant B Data is divided into 100 sec bins |
 |
 |
| Module-wise count rates for Quadrant C Data is divided into 100 sec bins |
 |
 |
| Module-wise count rates for Quadrant D Data is divided into 100 sec bins |
 |
 |
| Parameter | Plot |
|---|---|
| CZT HV Monitor |  |
| D_VDD | 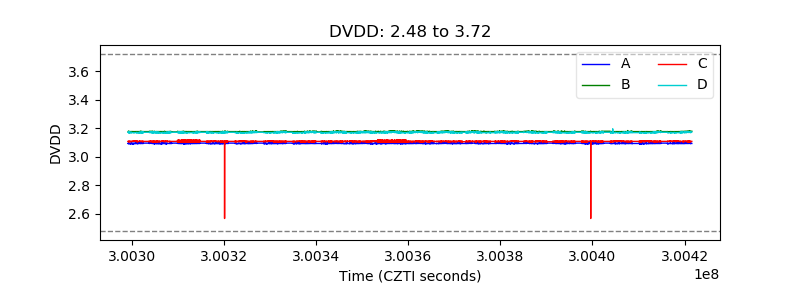 |
| Temperature 1 |  |
| Veto HV Monitor | 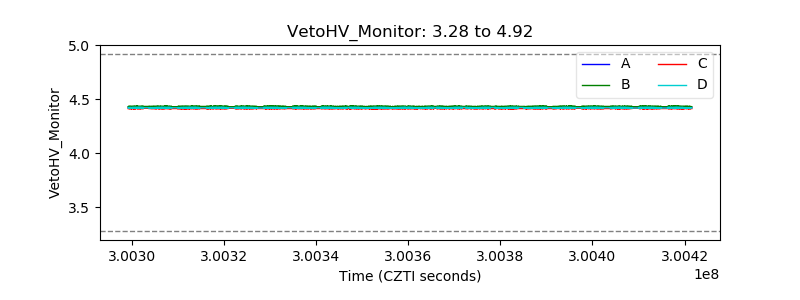 |
| Veto LLD | 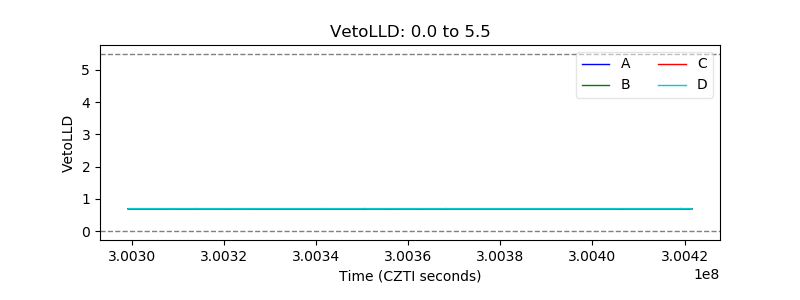 |
| Alpha Counter | 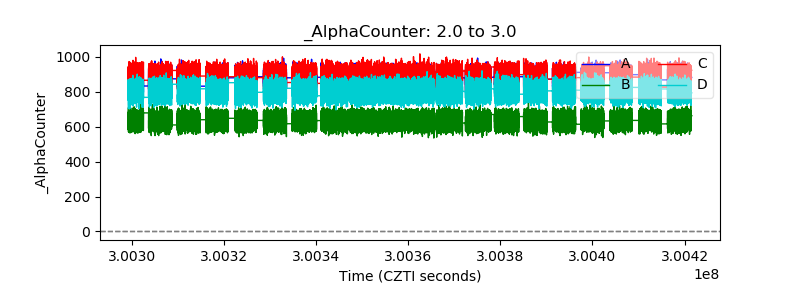 |
| _CPM_Rate |  |
| CZT Counter | 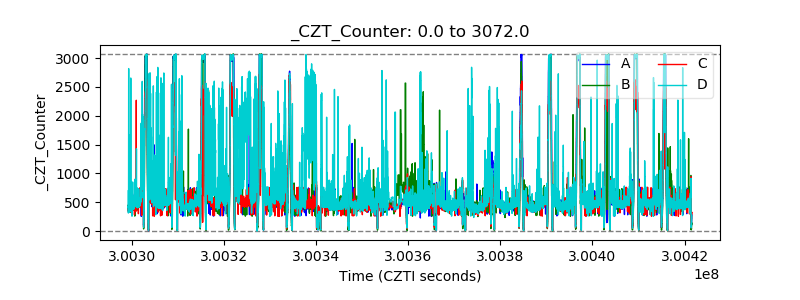 |
| +2.5 Volts monitor |  |
| +5 Volts monitor |  |
| _ROLL_ROT | 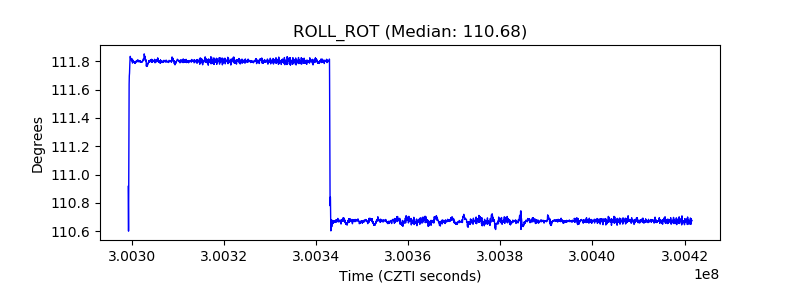 |
| _Roll_DEC |  |
| _Roll_RA | 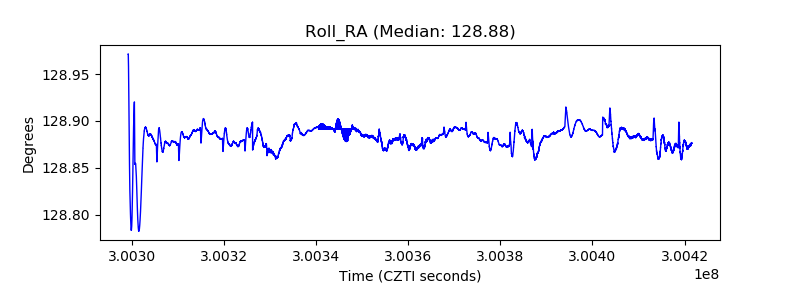 |
| Veto Counter | 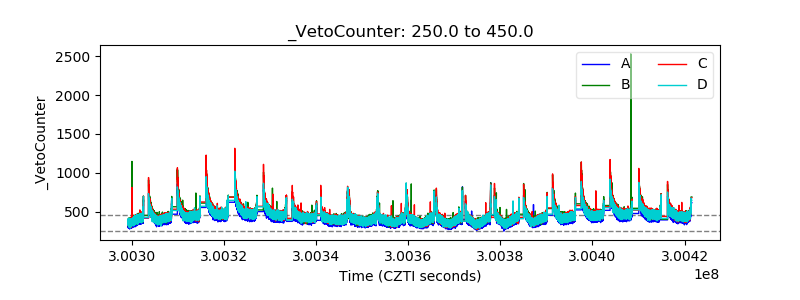 |