| Param | Original file | Final file |
|---|---|---|
| Filename | modeM0/AS1A05_188T01_9000003018_20419cztM0_level2.evt | modeM0/AS1A05_188T01_9000003018_20419cztM0_level2_quad_clean.evt |
| Size (bytes) | 355,438,080 | 59,889,600 |
| Size | 339.0 MB | 57.1 MB |
| Events in quadrant A | 2,259,146 | 383,654 |
| Events in quadrant B | 2,244,389 | 391,128 |
| Events in quadrant C | 2,210,731 | 369,365 |
| Events in quadrant D | 3,739,605 | 348,468 |
| Mode SS | |||
|---|---|---|---|
| Quadrant | BADHDUFLAG | Total packets | Discarded packets |
| A | 0 | 92 | 0 |
| B | 0 | 92 | 0 |
| C | 0 | 92 | 0 |
| D | 0 | 92 | 0 |
| Mode M9 | |||
|---|---|---|---|
| Quadrant | BADHDUFLAG | Total packets | Discarded packets |
| A | 0 | 11 | 0 |
| B | 0 | 11 | 0 |
| C | 0 | 11 | 0 |
| D | 0 | 11 | 0 |
| Mode M0 | |||
|---|---|---|---|
| Quadrant | BADHDUFLAG | Total packets | Discarded packets |
| A | 0 | 9630 | 2 |
| B | 0 | 9599 | 1 |
| C | 0 | 9418 | 1 |
| D | 0 | 14175 | 1 |
| Quadrant | Total seconds | Saturated seconds | Saturation percentage |
|---|---|---|---|
| A | 4564 | 24 | 0.525855% |
| B | 4564 | 26 | 0.569676% |
| C | 4564 | 36 | 0.788782% |
| D | 4564 | 302 | 6.617003% |
Noise dominated data is calculated using 1-second bins in cleaned event files. If a bin has >2000 counts, and if more than 50% of those come from <1% of pixels, then it is considered to be noise-dominated and hence unusable.
| Quadrant | # 1 sec bins | Bins with >0 counts | Bins with >2000 counts | High rate bins dominated by noise | Noise dominated (total time) | Noise dominated (detector-on time) | Marked lightcurve |
|---|---|---|---|---|---|---|---|
| A | 5674 | 4565 | 8 | 8 | 0.14% | 0.18% | 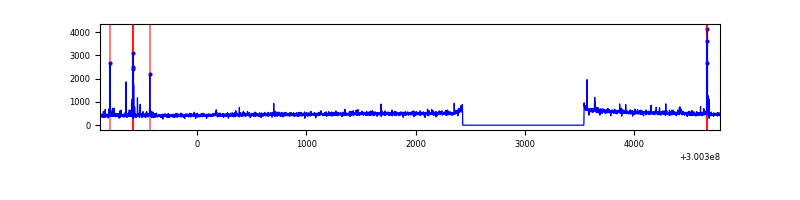 |
| B | 5674 | 4564 | 0 | 0 | 0.00% | 0.00% | 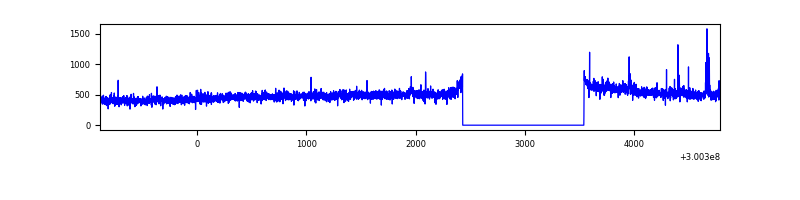 |
| C | 5674 | 4565 | 4 | 4 | 0.07% | 0.09% | 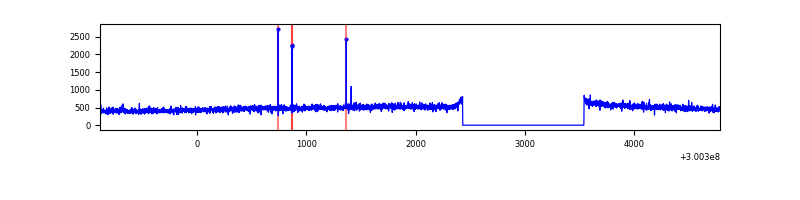 |
| D | 5674 | 4565 | 245 | 245 | 4.32% | 5.37% | 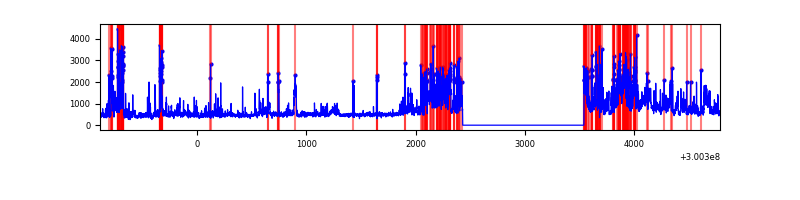 |
Top three noisy pixels from each quadrant. If the there are fewer than three noisy pixels in the level2.evt file, extra rows are filled as -1
| Pixel properties | Quadrant properties | ||||||
|---|---|---|---|---|---|---|---|
| Quadrant | DetID | PixID | Counts | Sigma | Mean | Median | Sigma |
| A | 5 | 16 | 46022 | 402.54 | 565 | 554 | 113.0 |
| A | 12 | 96 | 32290 | 280.97 | 565 | 554 | 113.0 |
| A | 0 | 226 | 5000 | 39.36 | 565 | 554 | 113.0 |
| B | 0 | 189 | 13765 | 123.95 | 561 | 548 | 106.6 |
| B | 12 | 111 | 12891 | 115.75 | 561 | 548 | 106.6 |
| B | 10 | 245 | 11944 | 106.87 | 561 | 548 | 106.6 |
| C | 14 | 238 | 84906 | 668.06 | 538 | 540 | 126.3 |
| C | 3 | 9 | 10403 | 78.1 | 538 | 540 | 126.3 |
| C | 3 | 233 | 10153 | 76.12 | 538 | 540 | 126.3 |
| D | 2 | 16 | 1456476 | 11201.03 | 534 | 516 | 130.0 |
| D | 1 | 52 | 154539 | 1184.93 | 534 | 516 | 130.0 |
| D | 13 | 153 | 93378 | 714.41 | 534 | 516 | 130.0 |
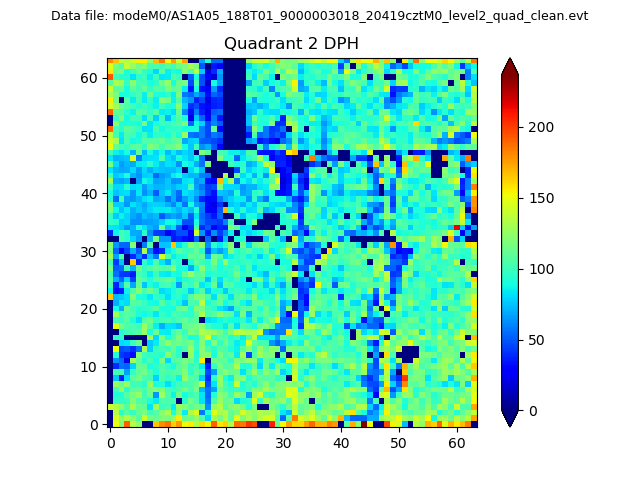
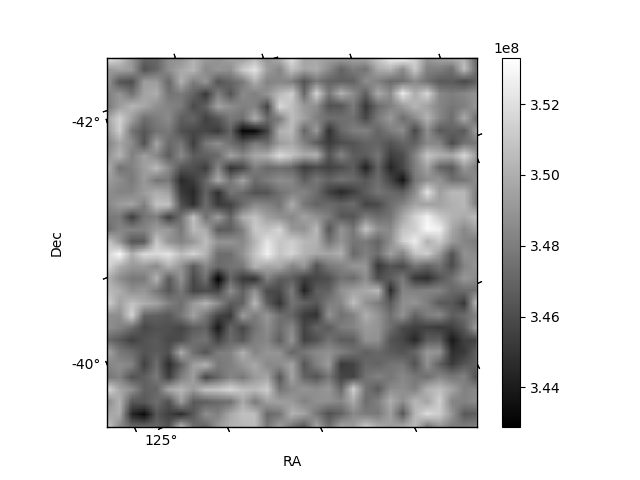
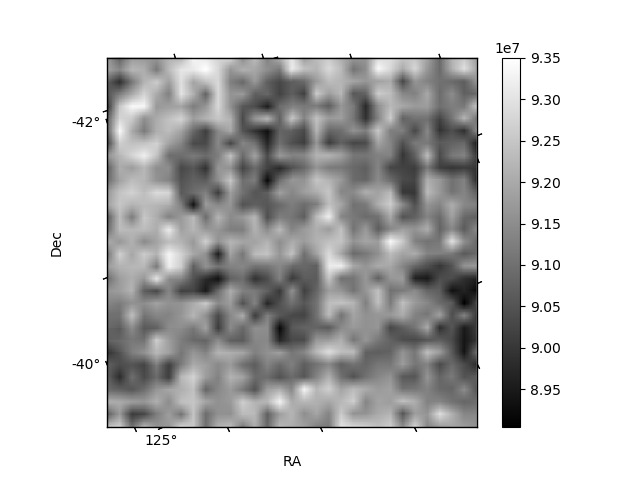
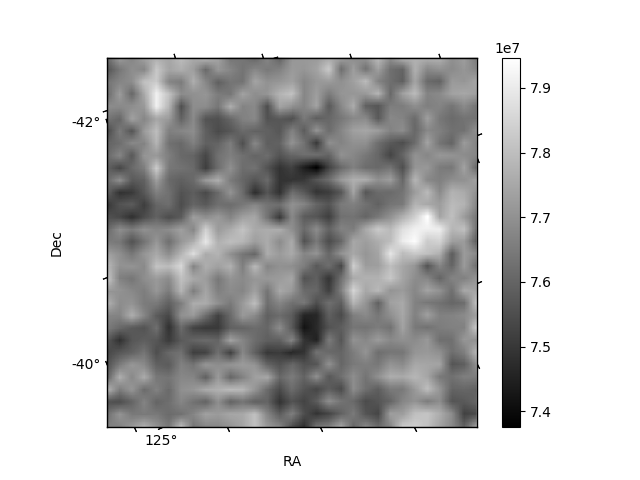
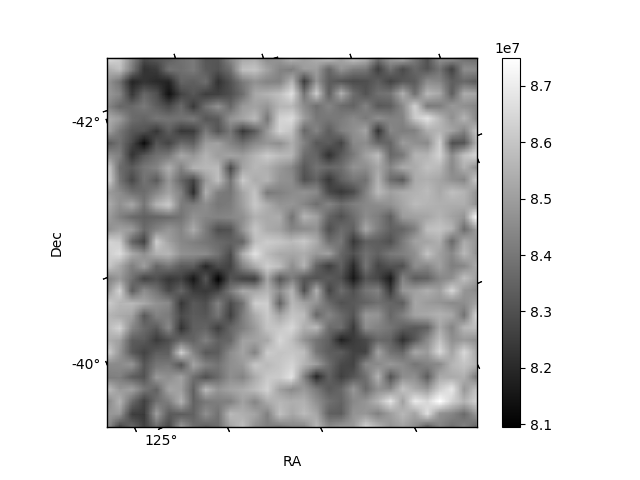
Histogram calculated using DETX and DETY for each event in the final _common_clean file
| Quadrant A | 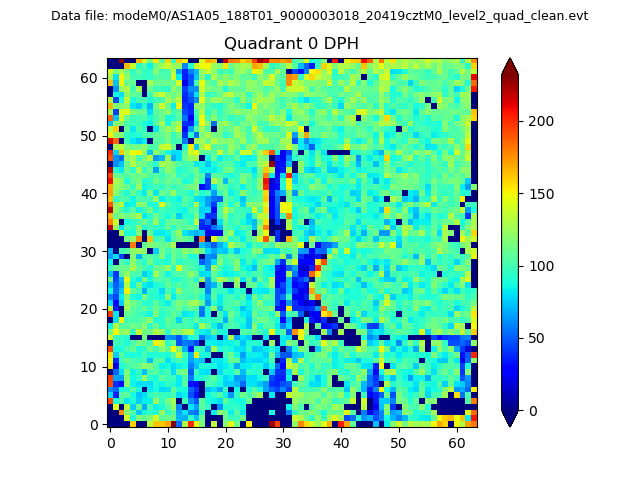 |
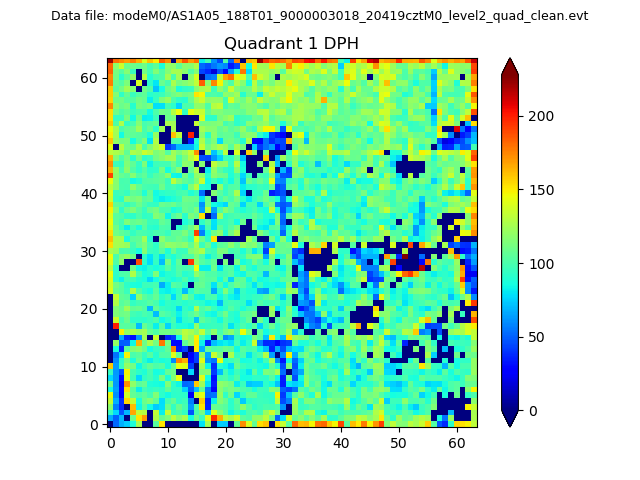 |
Quadrant B |
|---|---|---|---|
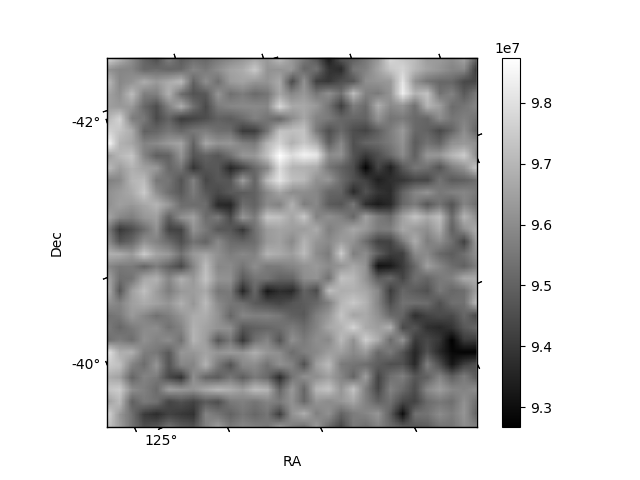
| Quadrant D | 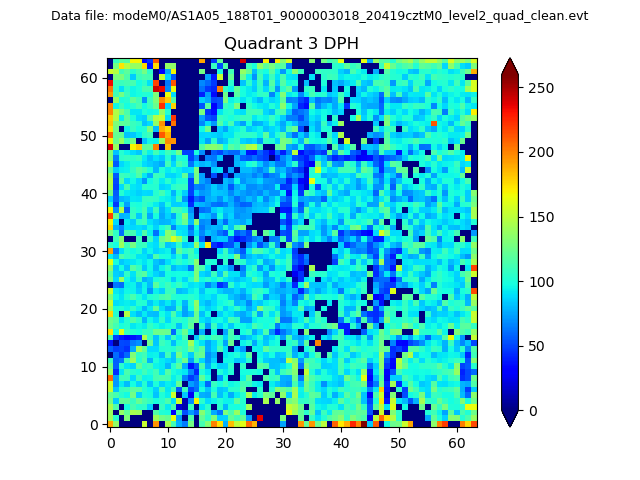 |
 |
Quadrant C |
| Plot type | Count rate plots | Images |
|---|---|---|
| Comparison with Poisson distribution Blue bars denote a histogram of data divided into 1 sec bins. Red curve is a Poisson curve with rate = median count rate of data. |
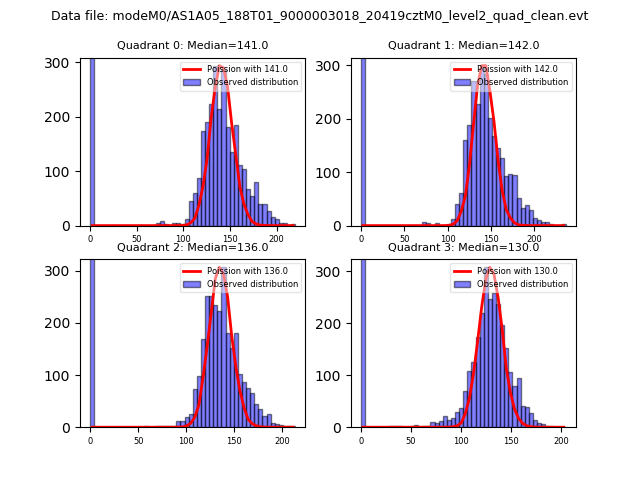 |
 |
| Quadrant-wise count rates Data is divided into 100 sec bins |
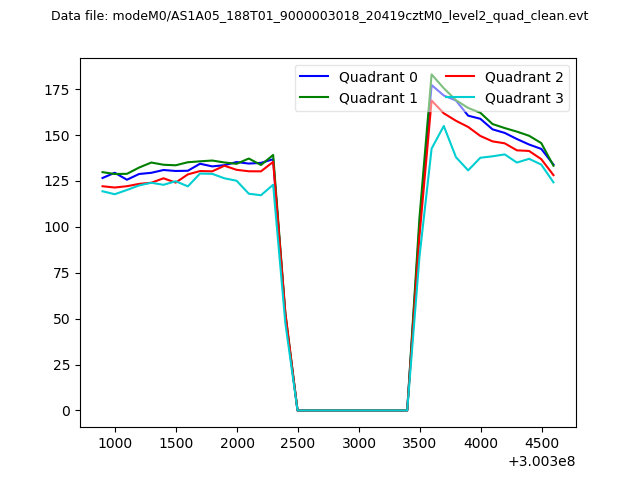 |
|
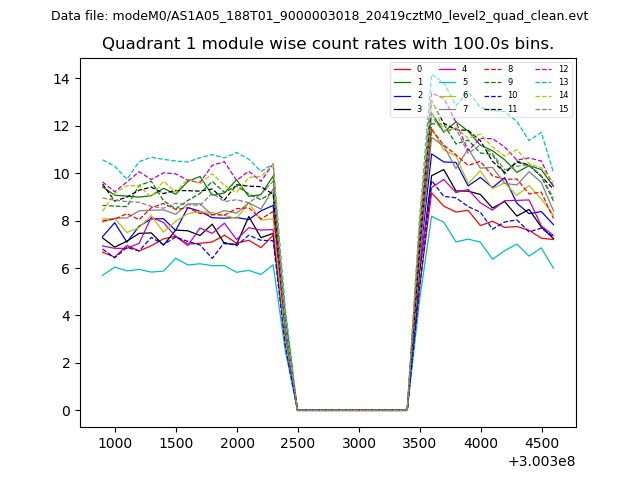
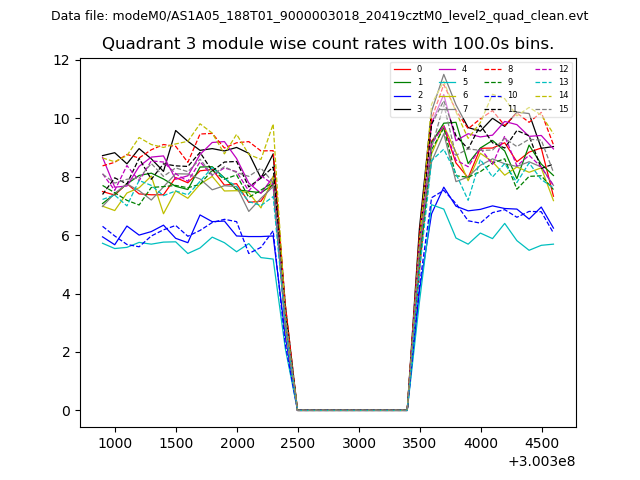
| Module-wise count rates for Quadrant A Data is divided into 100 sec bins |
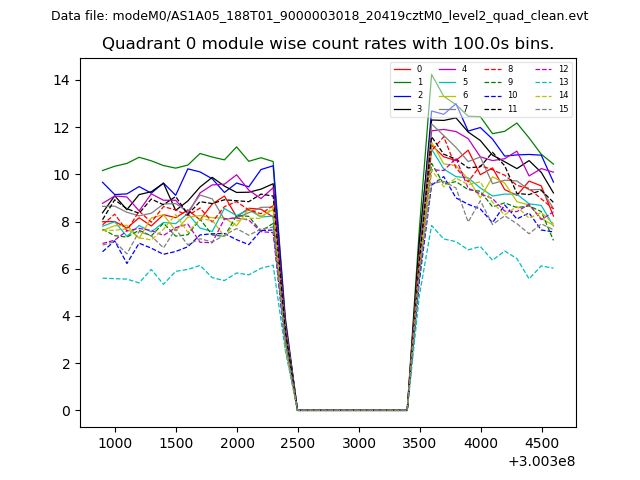 |
 |
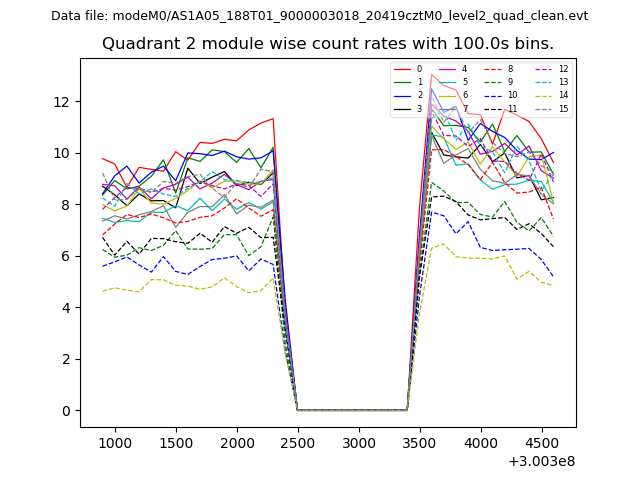
| Module-wise count rates for Quadrant B Data is divided into 100 sec bins |
 |
 |
| Module-wise count rates for Quadrant C Data is divided into 100 sec bins |
 |
 |
| Module-wise count rates for Quadrant D Data is divided into 100 sec bins |
 |
 |
| Parameter | Plot |
|---|---|
| CZT HV Monitor | 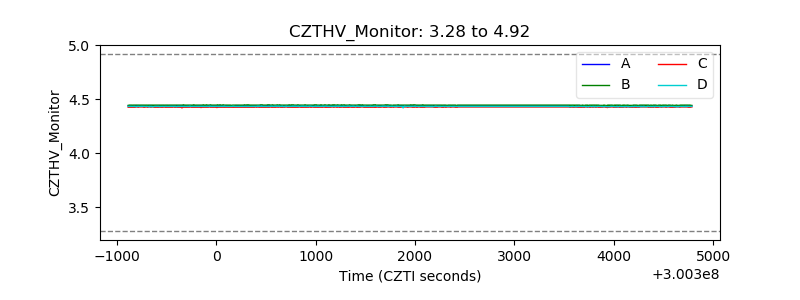 |
| D_VDD | 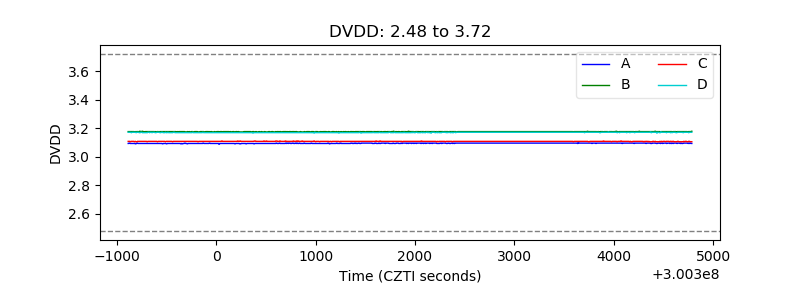 |
| Temperature 1 |  |
| Veto HV Monitor | 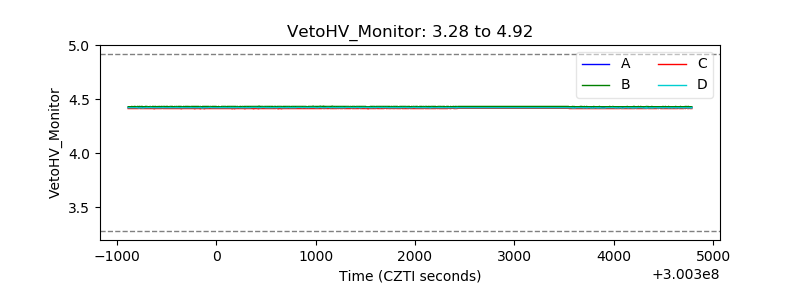 |
| Veto LLD | 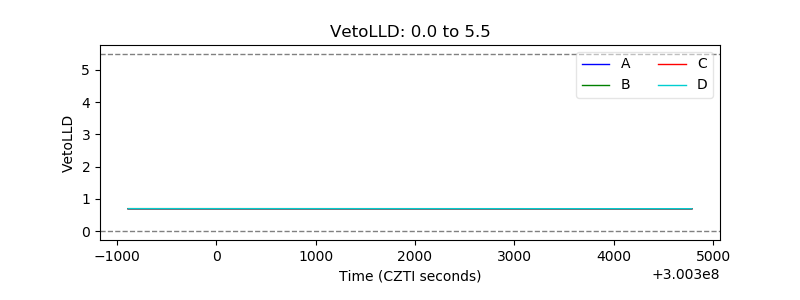 |
| Alpha Counter | 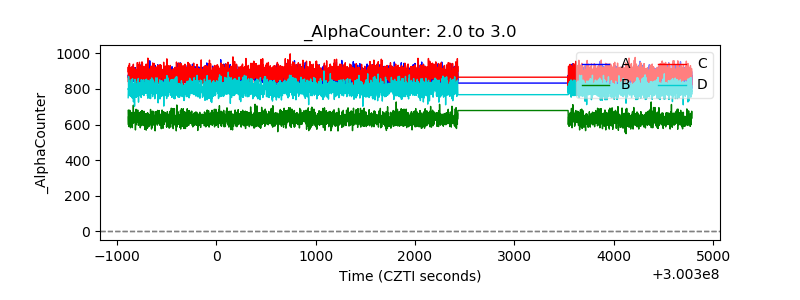 |
| _CPM_Rate | 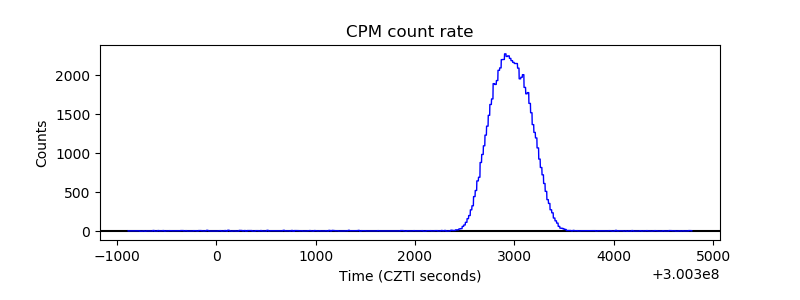 |
| CZT Counter | 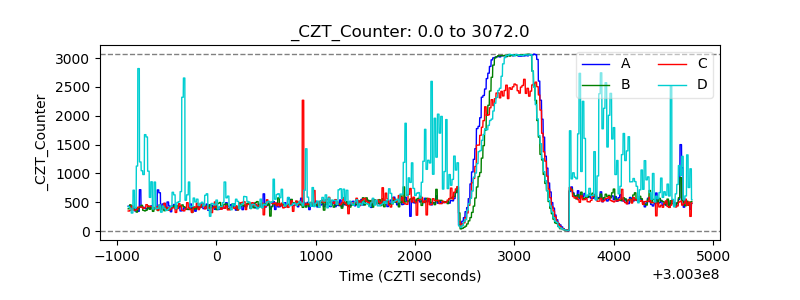 |
| +2.5 Volts monitor |  |
| +5 Volts monitor |  |
| _ROLL_ROT | 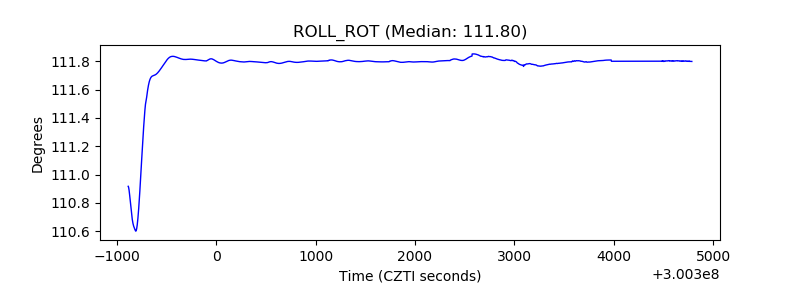 |
| _Roll_DEC |  |
| _Roll_RA | 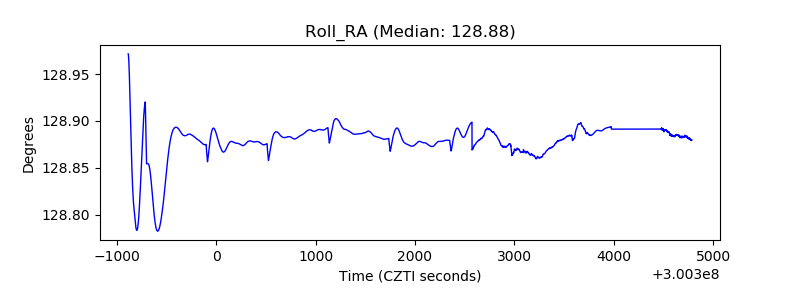 |
| Veto Counter | 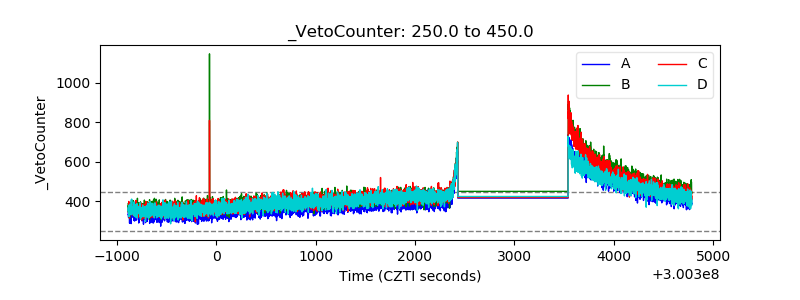 |