| Param | Original file | Final file |
|---|---|---|
| Filename | modeM0/AS1A05_188T01_9000003018_20421cztM0_level2.evt | modeM0/AS1A05_188T01_9000003018_20421cztM0_level2_quad_clean.evt |
| Size (bytes) | 502,712,640 | 86,466,240 |
| Size | 479.4 MB | 82.5 MB |
| Events in quadrant A | 3,162,183 | 563,240 |
| Events in quadrant B | 3,255,972 | 574,900 |
| Events in quadrant C | 3,114,294 | 540,736 |
| Events in quadrant D | 5,268,630 | 503,721 |
| Mode SS | |||
|---|---|---|---|
| Quadrant | BADHDUFLAG | Total packets | Discarded packets |
| A | 0 | 126 | 0 |
| B | 0 | 126 | 0 |
| C | 0 | 126 | 0 |
| D | 0 | 126 | 0 |
| Mode M9 | |||
|---|---|---|---|
| Quadrant | BADHDUFLAG | Total packets | Discarded packets |
| A | 0 | 13 | 0 |
| B | 0 | 13 | 0 |
| C | 0 | 13 | 0 |
| D | 0 | 13 | 0 |
| Mode M0 | |||
|---|---|---|---|
| Quadrant | BADHDUFLAG | Total packets | Discarded packets |
| A | 0 | 13324 | 2 |
| B | 0 | 13630 | 2 |
| C | 0 | 13110 | 2 |
| D | 0 | 19853 | 3 |
| Quadrant | Total seconds | Saturated seconds | Saturation percentage |
|---|---|---|---|
| A | 6247 | 33 | 0.528254% |
| B | 6248 | 35 | 0.560179% |
| C | 6248 | 41 | 0.656210% |
| D | 6247 | 460 | 7.363534% |
Noise dominated data is calculated using 1-second bins in cleaned event files. If a bin has >2000 counts, and if more than 50% of those come from <1% of pixels, then it is considered to be noise-dominated and hence unusable.
| Quadrant | # 1 sec bins | Bins with >0 counts | Bins with >2000 counts | High rate bins dominated by noise | Noise dominated (total time) | Noise dominated (detector-on time) | Marked lightcurve |
|---|---|---|---|---|---|---|---|
| A | 7477 | 6248 | 5 | 5 | 0.07% | 0.08% | 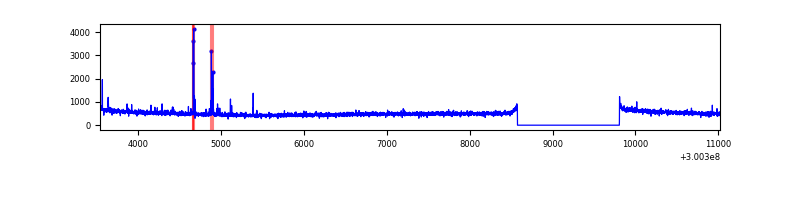 |
| B | 7478 | 6249 | 1 | 1 | 0.01% | 0.02% | 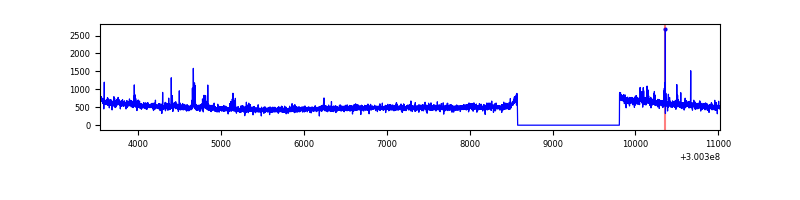 |
| C | 7478 | 6249 | 0 | 0 | 0.00% | 0.00% | 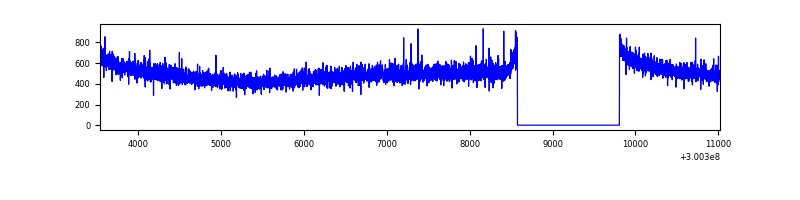 |
| D | 7477 | 6248 | 399 | 399 | 5.34% | 6.39% |  |
Top three noisy pixels from each quadrant. If the there are fewer than three noisy pixels in the level2.evt file, extra rows are filled as -1
| Pixel properties | Quadrant properties | ||||||
|---|---|---|---|---|---|---|---|
| Quadrant | DetID | PixID | Counts | Sigma | Mean | Median | Sigma |
| A | 5 | 16 | 48692 | 300.32 | 805 | 791 | 159.5 |
| A | 11 | 29 | 7273 | 40.64 | 805 | 791 | 159.5 |
| A | 0 | 226 | 6959 | 38.67 | 805 | 791 | 159.5 |
| B | 10 | 245 | 36265 | 237.13 | 802 | 785 | 149.6 |
| B | 0 | 189 | 34195 | 223.29 | 802 | 785 | 149.6 |
| B | 0 | 197 | 25174 | 163.0 | 802 | 785 | 149.6 |
| C | 14 | 238 | 122013 | 690.7 | 760 | 767 | 175.5 |
| C | 7 | 220 | 13380 | 71.85 | 760 | 767 | 175.5 |
| C | 3 | 233 | 9509 | 49.8 | 760 | 767 | 175.5 |
| D | 2 | 16 | 1244614 | 7017.73 | 740 | 720 | 177.3 |
| D | 1 | 52 | 657756 | 3706.83 | 740 | 720 | 177.3 |
| D | 13 | 153 | 410275 | 2310.6 | 740 | 720 | 177.3 |
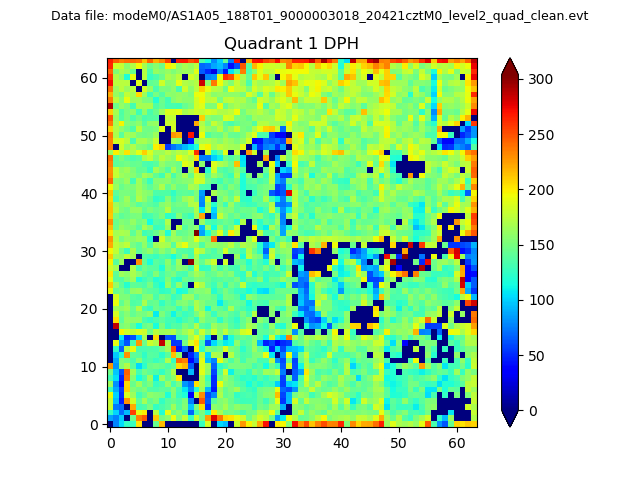
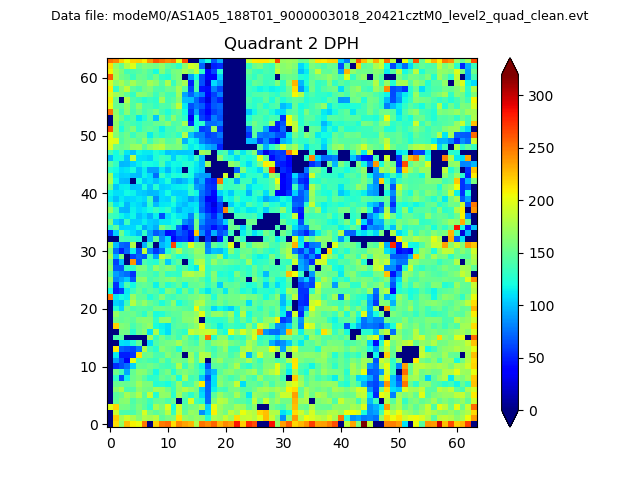
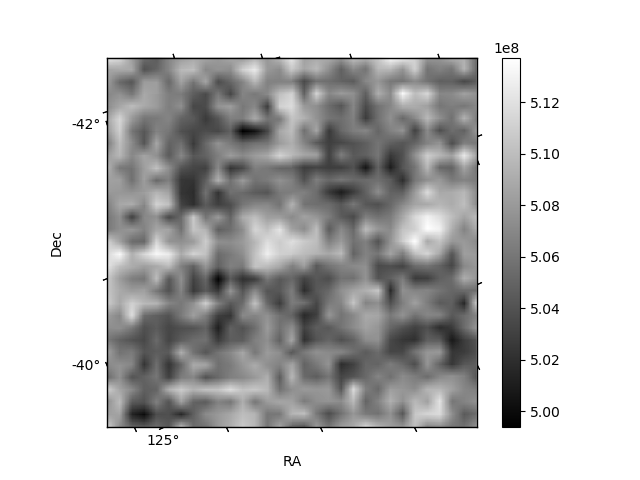
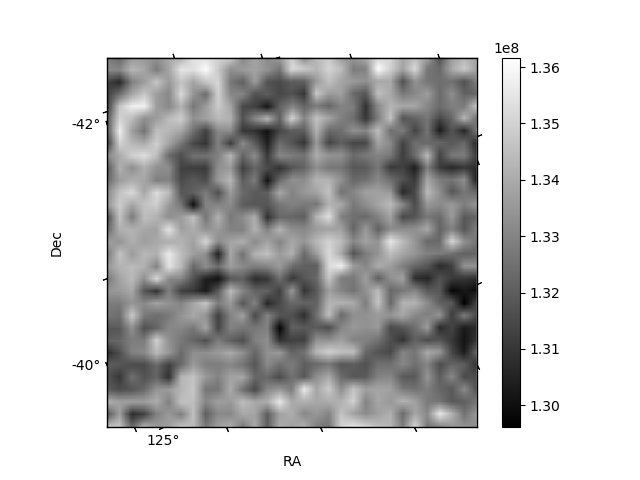
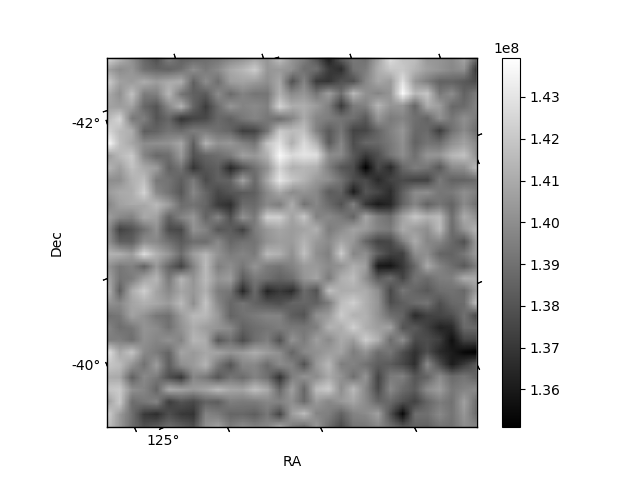
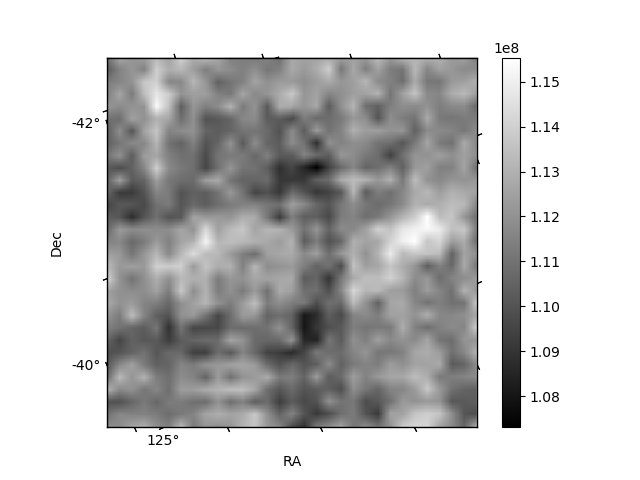
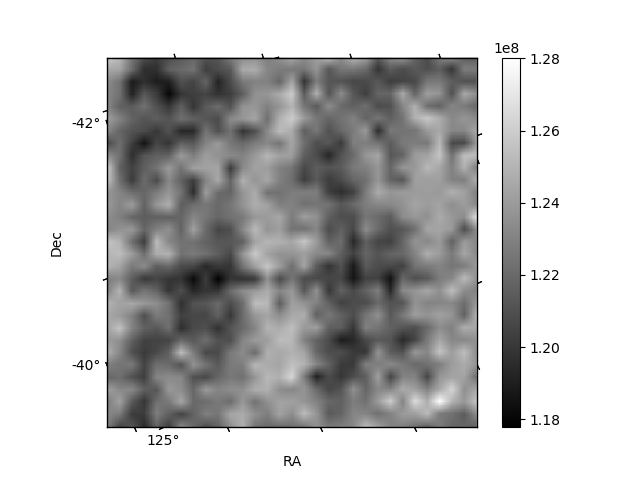
Histogram calculated using DETX and DETY for each event in the final _common_clean file
| Quadrant A | 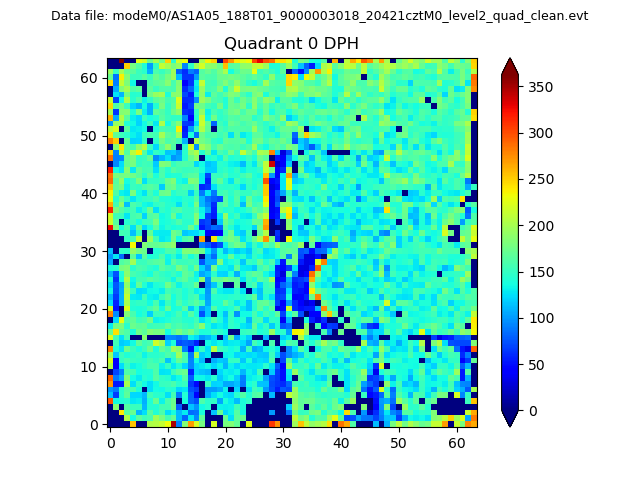 |
 |
Quadrant B |
|---|---|---|---|
| Quadrant D | 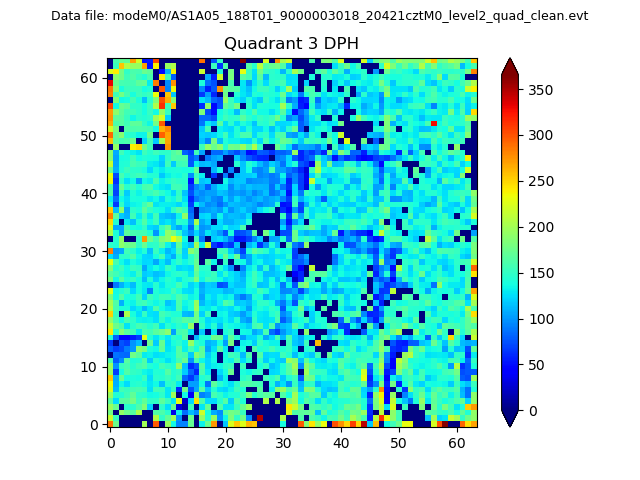 |
 |
Quadrant C |
| Plot type | Count rate plots | Images |
|---|---|---|
| Comparison with Poisson distribution Blue bars denote a histogram of data divided into 1 sec bins. Red curve is a Poisson curve with rate = median count rate of data. |
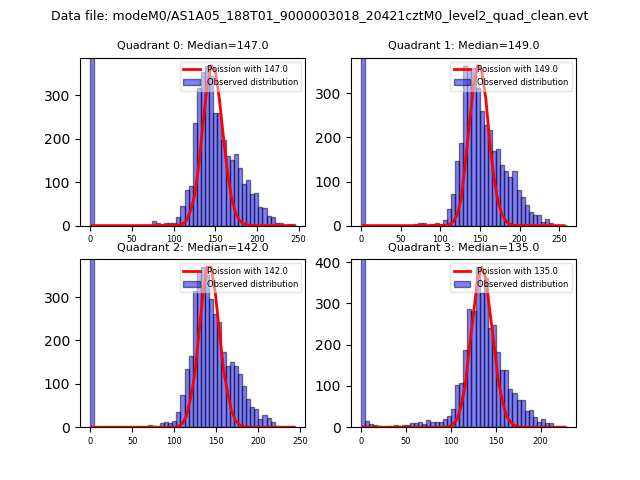 |
 |
| Quadrant-wise count rates Data is divided into 100 sec bins |
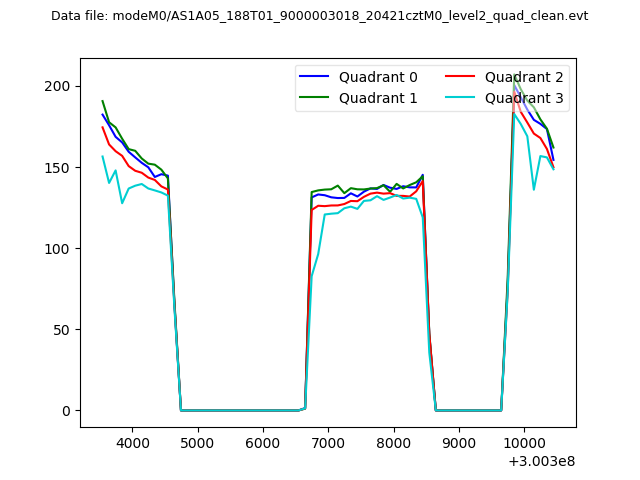 |
|
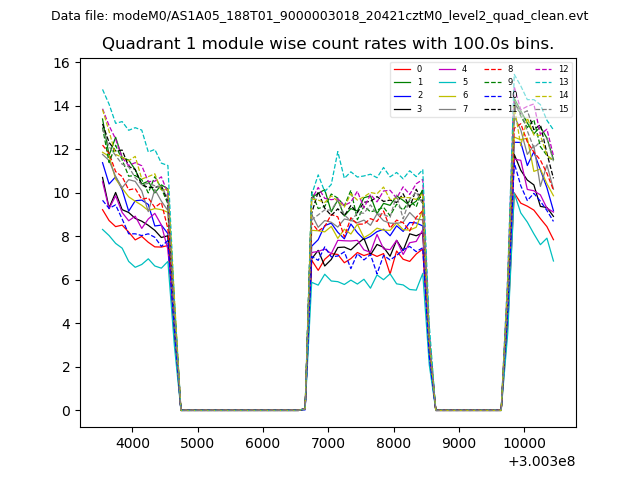
| Module-wise count rates for Quadrant A Data is divided into 100 sec bins |
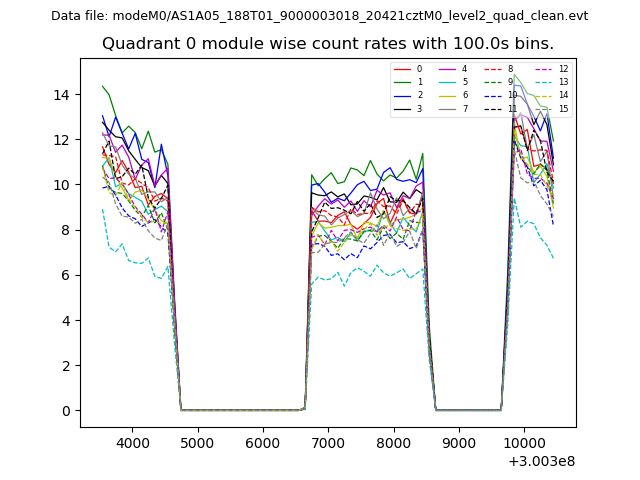 |
 |
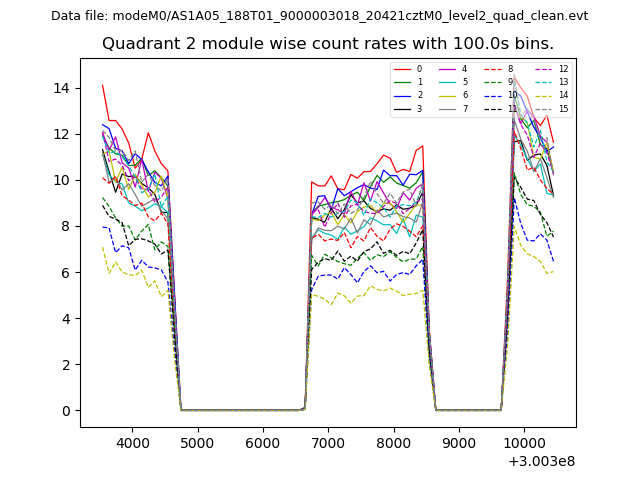
| Module-wise count rates for Quadrant B Data is divided into 100 sec bins |
 |
 |
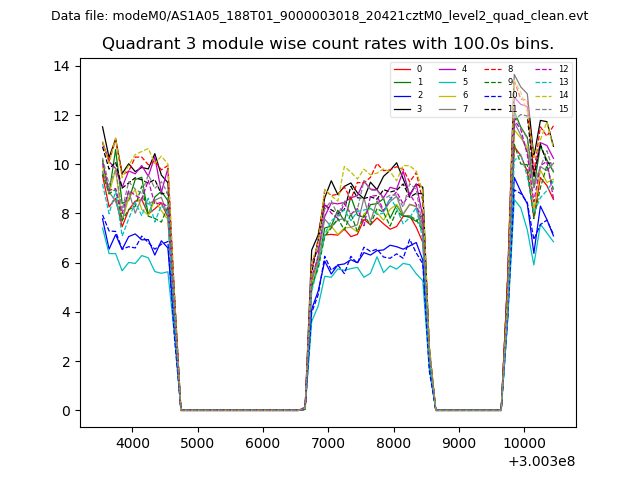
| Module-wise count rates for Quadrant C Data is divided into 100 sec bins |
 |
 |
| Module-wise count rates for Quadrant D Data is divided into 100 sec bins |
 |
 |
| Parameter | Plot |
|---|---|
| CZT HV Monitor | 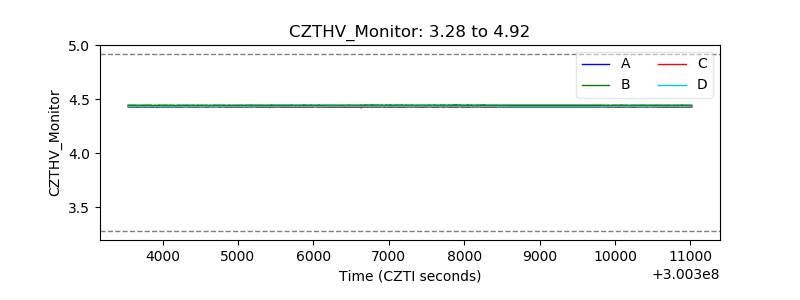 |
| D_VDD | 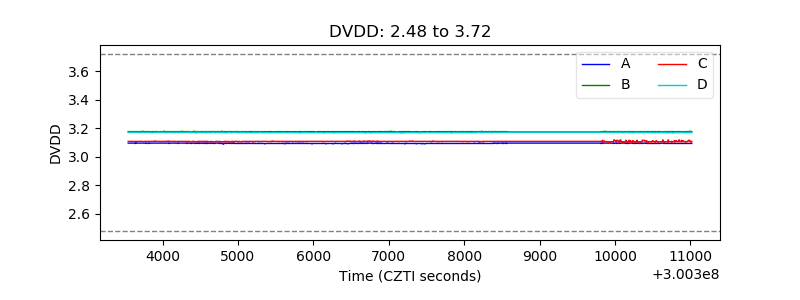 |
| Temperature 1 | 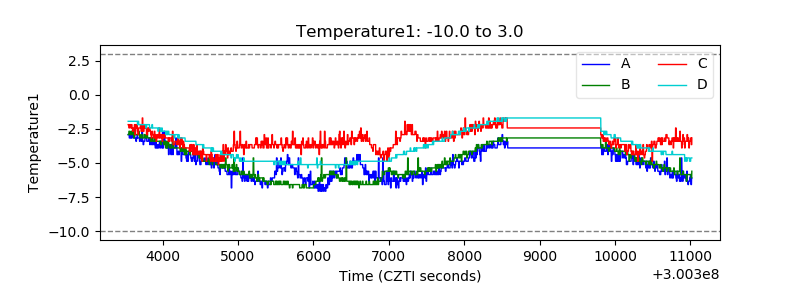 |
| Veto HV Monitor | 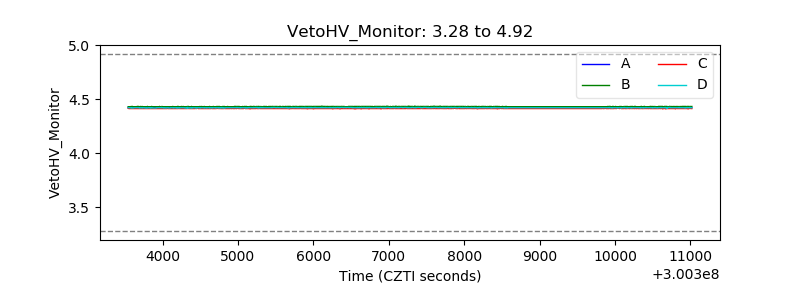 |
| Veto LLD | 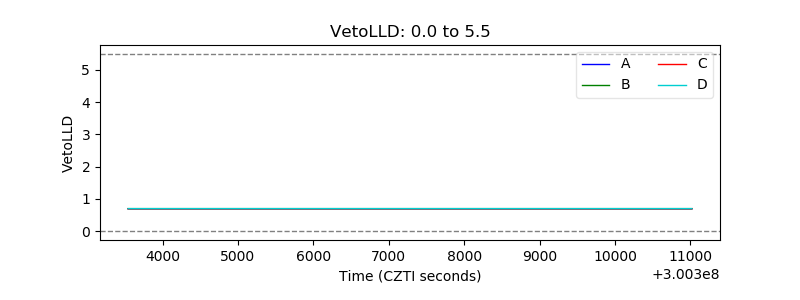 |
| Alpha Counter | 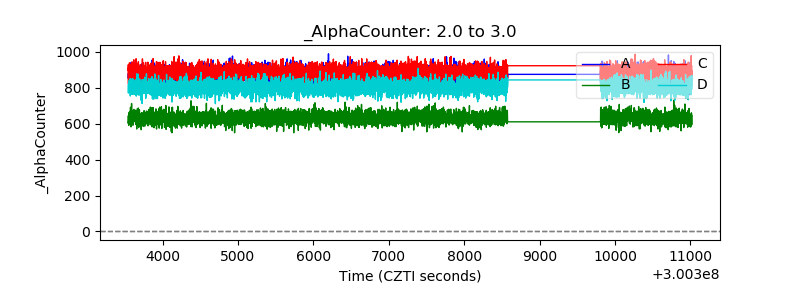 |
| _CPM_Rate | 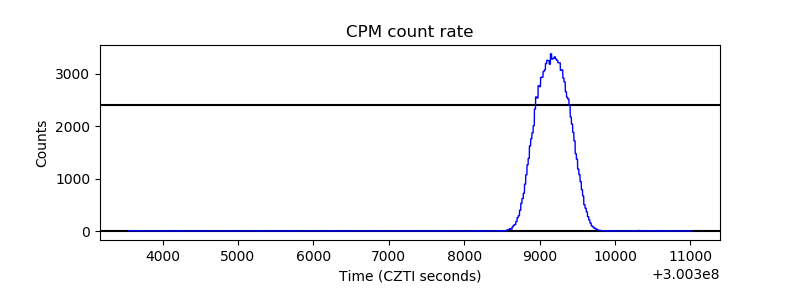 |
| CZT Counter | 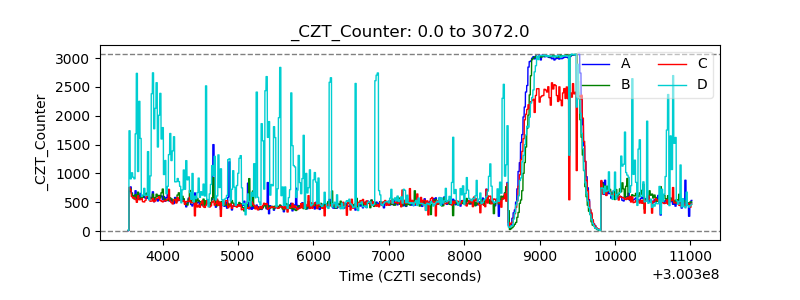 |
| +2.5 Volts monitor |  |
| +5 Volts monitor |  |
| _ROLL_ROT | 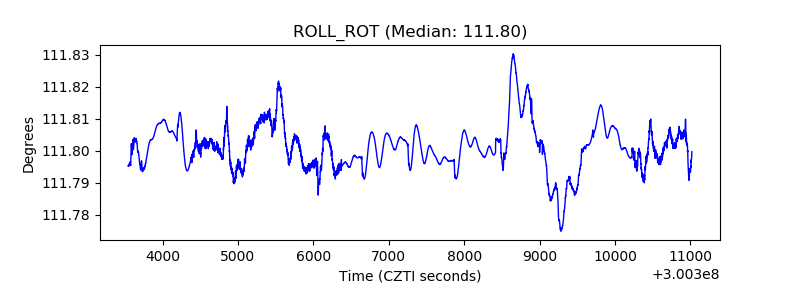 |
| _Roll_DEC | 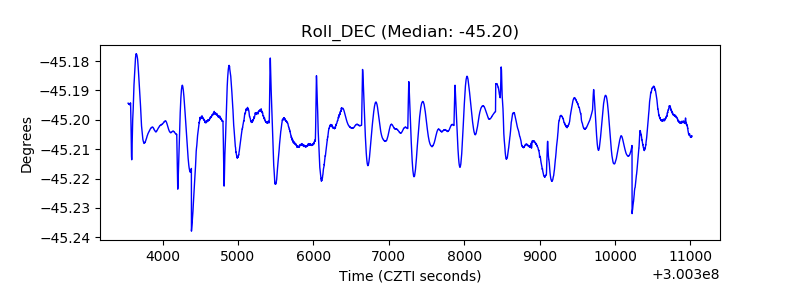 |
| _Roll_RA | 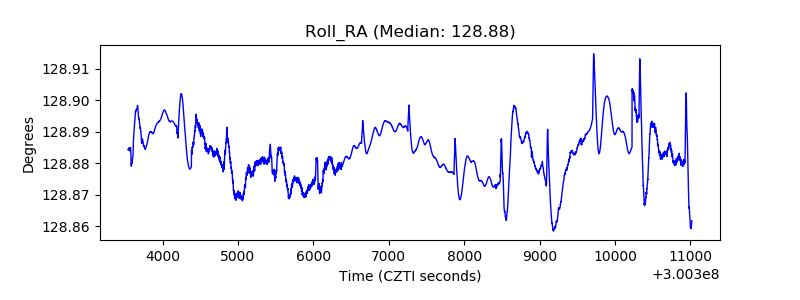 |
| Veto Counter | 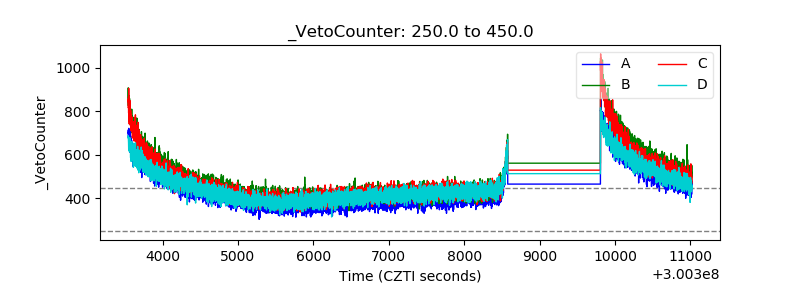 |