| Param | Original file | Final file |
|---|---|---|
| Filename | modeM0/AS1A05_188T01_9000003018_20422cztM0_level2.evt | modeM0/AS1A05_188T01_9000003018_20422cztM0_level2_quad_clean.evt |
| Size (bytes) | 477,947,520 | 79,439,040 |
| Size | 455.8 MB | 75.8 MB |
| Events in quadrant A | 3,222,329 | 505,447 |
| Events in quadrant B | 3,450,913 | 516,219 |
| Events in quadrant C | 3,227,376 | 486,005 |
| Events in quadrant D | 4,154,733 | 466,445 |
| Mode SS | |||
|---|---|---|---|
| Quadrant | BADHDUFLAG | Total packets | Discarded packets |
| A | 0 | 126 | 0 |
| B | 0 | 126 | 0 |
| C | 0 | 126 | 0 |
| D | 0 | 126 | 0 |
| Mode M9 | |||
|---|---|---|---|
| Quadrant | BADHDUFLAG | Total packets | Discarded packets |
| A | 0 | 17 | 0 |
| B | 0 | 18 | 0 |
| C | 0 | 18 | 0 |
| D | 0 | 18 | 0 |
| Mode M0 | |||
|---|---|---|---|
| Quadrant | BADHDUFLAG | Total packets | Discarded packets |
| A | 0 | 13319 | 2 |
| B | 0 | 13968 | 3 |
| C | 0 | 13245 | 2 |
| D | 0 | 16510 | 2 |
| Quadrant | Total seconds | Saturated seconds | Saturation percentage |
|---|---|---|---|
| A | 6179 | 23 | 0.372229% |
| B | 6178 | 44 | 0.712205% |
| C | 6178 | 42 | 0.679832% |
| D | 6178 | 185 | 2.994497% |
Noise dominated data is calculated using 1-second bins in cleaned event files. If a bin has >2000 counts, and if more than 50% of those come from <1% of pixels, then it is considered to be noise-dominated and hence unusable.
| Quadrant | # 1 sec bins | Bins with >0 counts | Bins with >2000 counts | High rate bins dominated by noise | Noise dominated (total time) | Noise dominated (detector-on time) | Marked lightcurve |
|---|---|---|---|---|---|---|---|
| A | 7514 | 6180 | 0 | 0 | 0.00% | 0.00% | 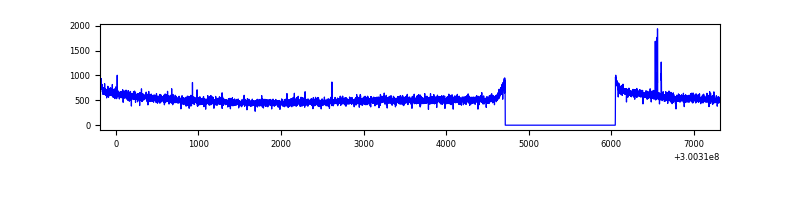 |
| B | 7513 | 6179 | 9 | 9 | 0.12% | 0.15% | 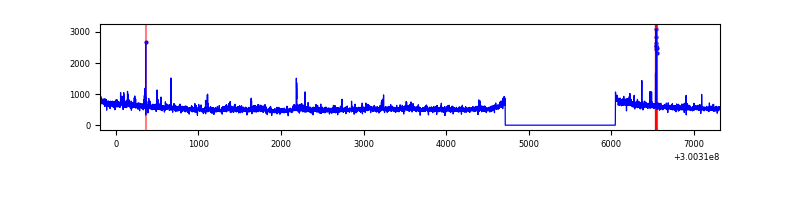 |
| C | 7513 | 6179 | 0 | 0 | 0.00% | 0.00% | 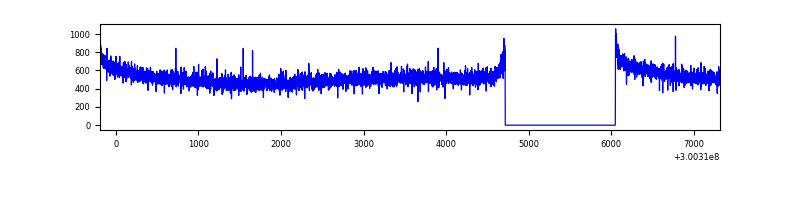 |
| D | 7513 | 6179 | 167 | 167 | 2.22% | 2.70% | 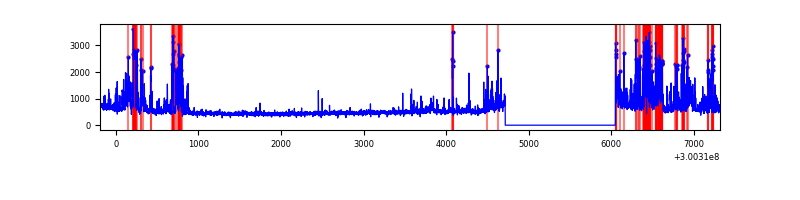 |
Top three noisy pixels from each quadrant. If the there are fewer than three noisy pixels in the level2.evt file, extra rows are filled as -1
| Pixel properties | Quadrant properties | ||||||
|---|---|---|---|---|---|---|---|
| Quadrant | DetID | PixID | Counts | Sigma | Mean | Median | Sigma |
| A | 5 | 16 | 10659 | 60.35 | 833 | 819 | 163.1 |
| A | 0 | 226 | 7229 | 39.31 | 833 | 819 | 163.1 |
| A | 3 | 137 | 6370 | 34.04 | 833 | 819 | 163.1 |
| B | 10 | 245 | 80947 | 524.89 | 832 | 816 | 152.7 |
| B | 0 | 219 | 34628 | 221.48 | 832 | 816 | 152.7 |
| B | 4 | 216 | 34121 | 218.16 | 832 | 816 | 152.7 |
| C | 14 | 238 | 128516 | 707.82 | 788 | 796 | 180.4 |
| C | 8 | 128 | 12207 | 63.24 | 788 | 796 | 180.4 |
| C | 8 | 112 | 5600 | 26.62 | 788 | 796 | 180.4 |
| D | 2 | 16 | 522481 | 2787.25 | 786 | 766 | 187.2 |
| D | 13 | 153 | 362506 | 1932.59 | 786 | 766 | 187.2 |
| D | 1 | 52 | 241778 | 1287.6 | 786 | 766 | 187.2 |
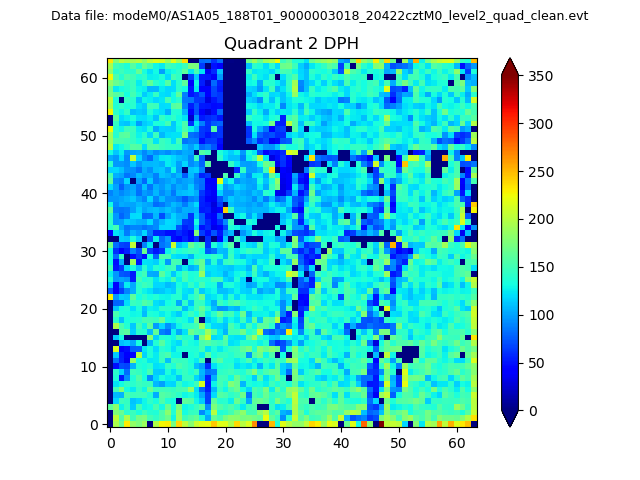
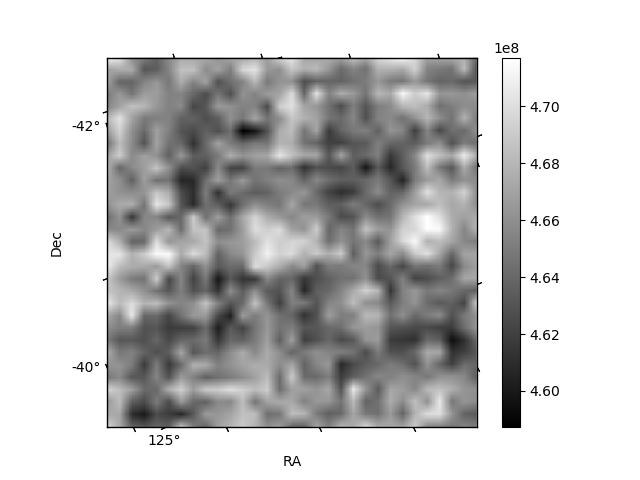
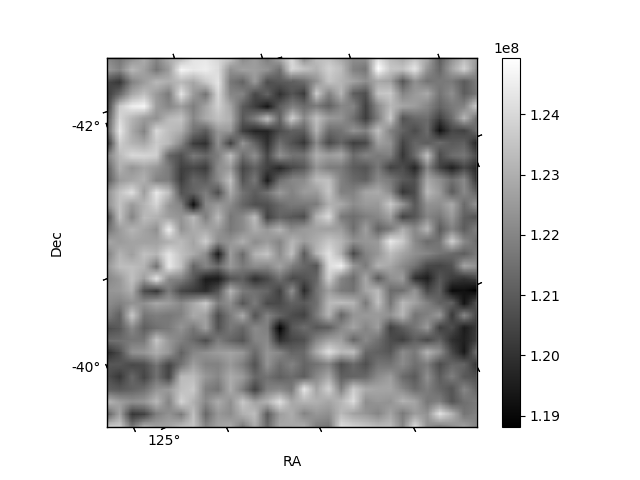
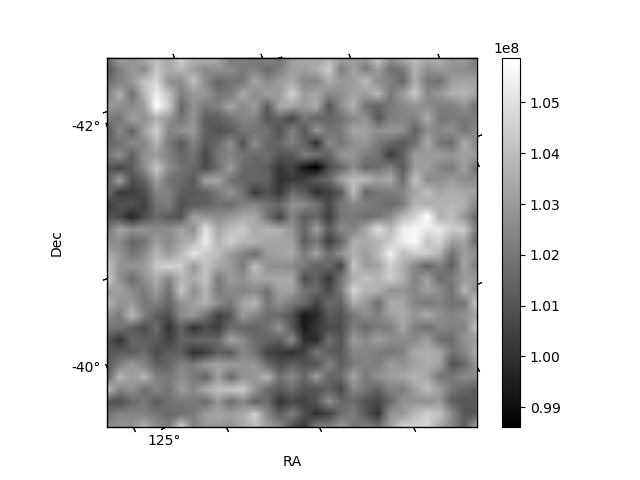
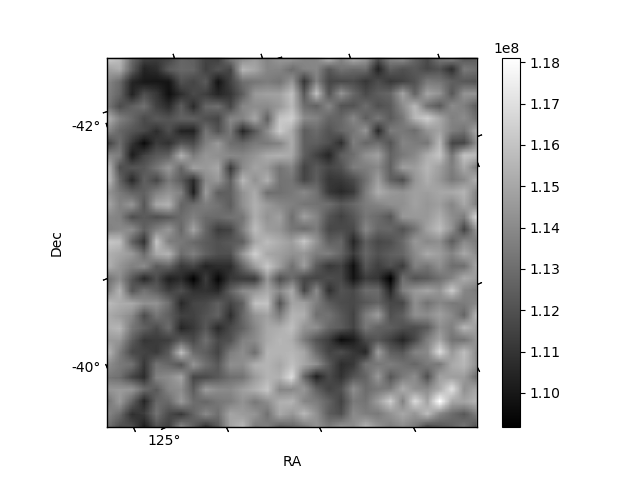
Histogram calculated using DETX and DETY for each event in the final _common_clean file
| Quadrant A | 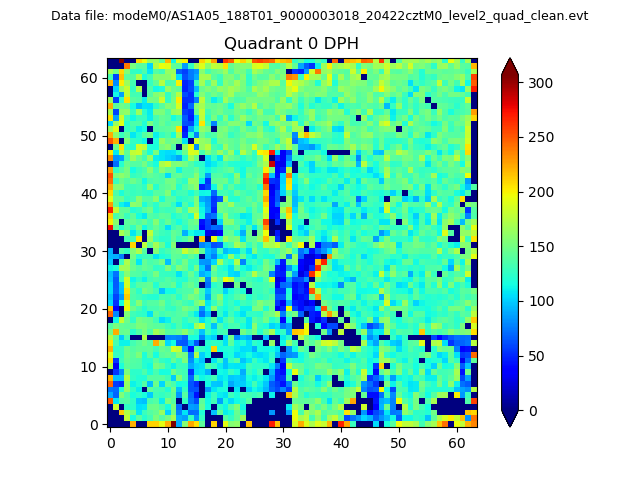 |
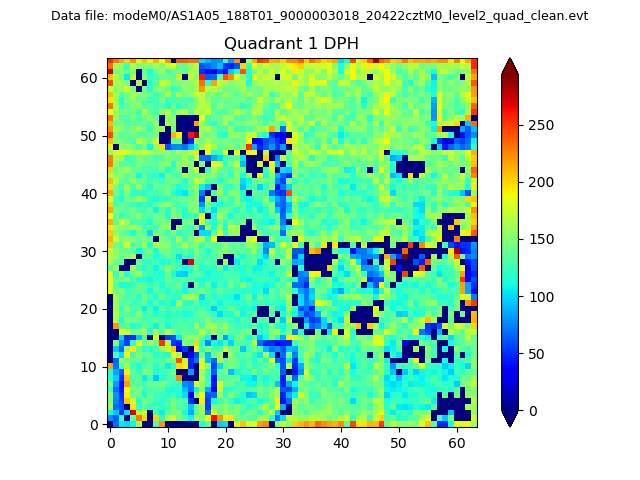 |
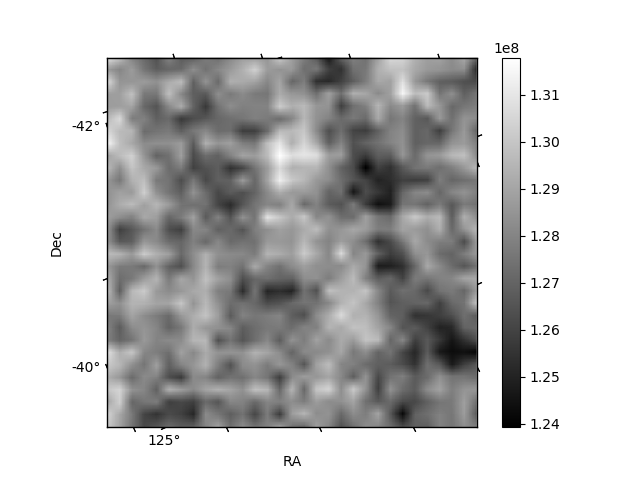
Quadrant B |
|---|---|---|---|
| Quadrant D | 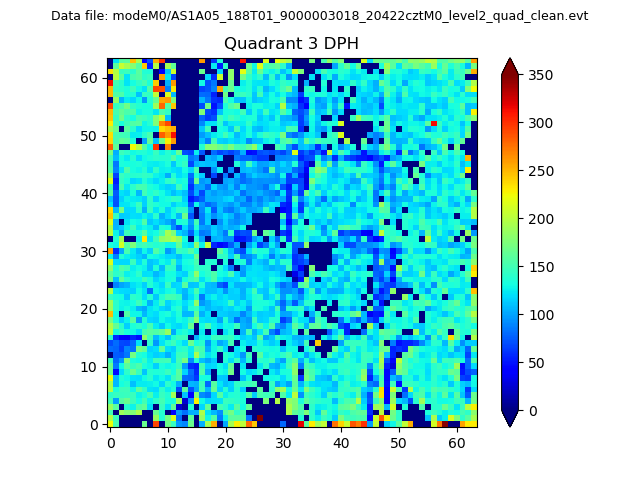 |
 |
Quadrant C |
| Plot type | Count rate plots | Images |
|---|---|---|
| Comparison with Poisson distribution Blue bars denote a histogram of data divided into 1 sec bins. Red curve is a Poisson curve with rate = median count rate of data. |
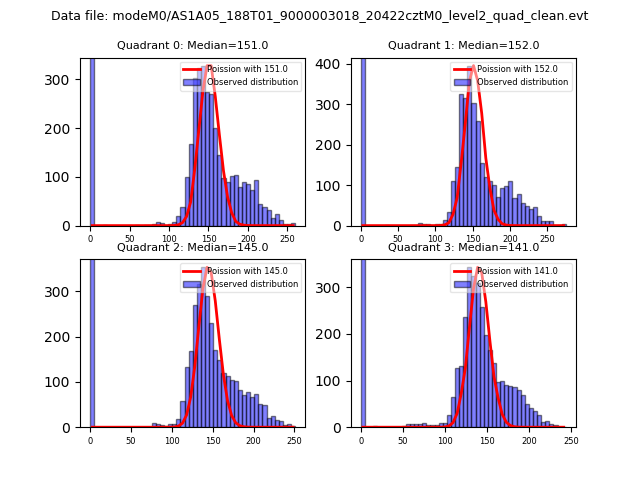 |
 |
| Quadrant-wise count rates Data is divided into 100 sec bins |
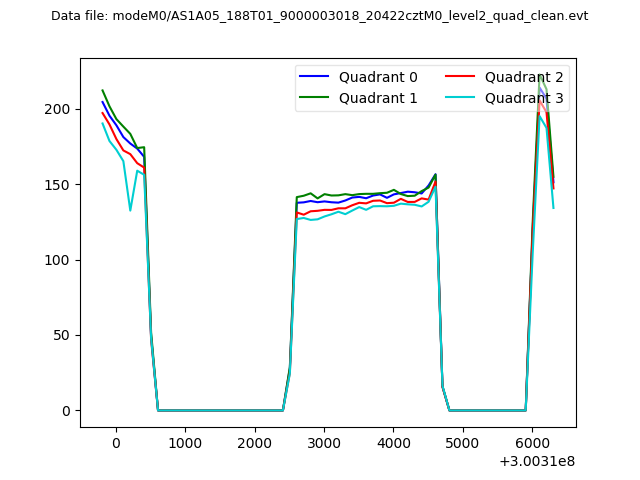 |
|
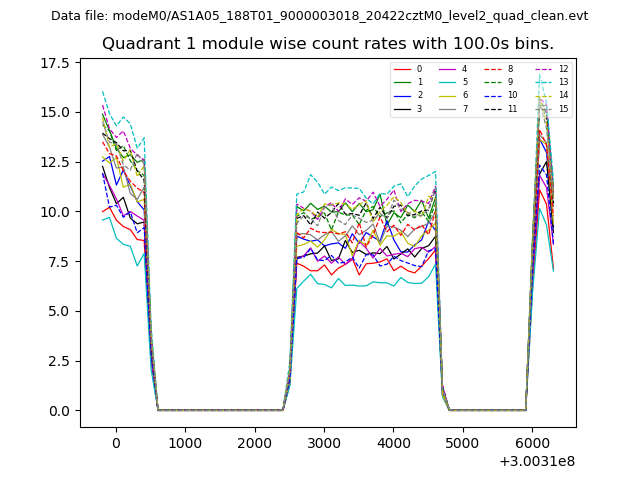
| Module-wise count rates for Quadrant A Data is divided into 100 sec bins |
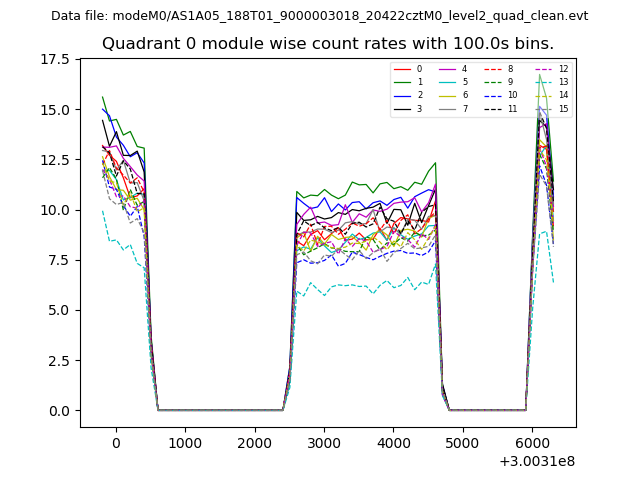 |
 |
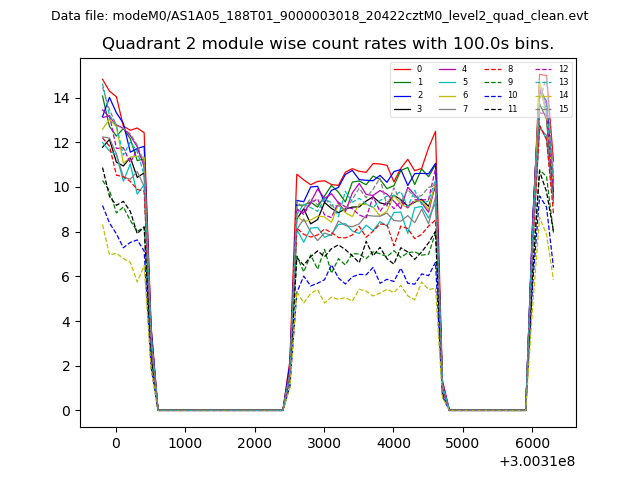
| Module-wise count rates for Quadrant B Data is divided into 100 sec bins |
 |
 |
| Module-wise count rates for Quadrant C Data is divided into 100 sec bins |
 |
 |
| Module-wise count rates for Quadrant D Data is divided into 100 sec bins |
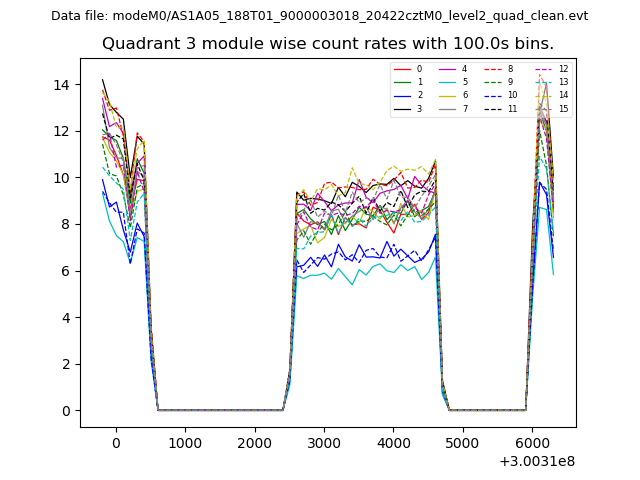 |
 |
| Parameter | Plot |
|---|---|
| CZT HV Monitor | 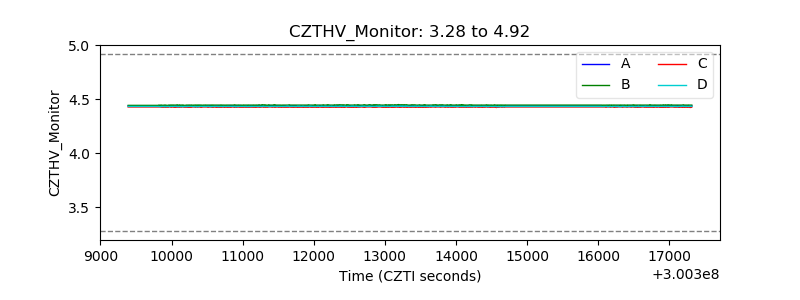 |
| D_VDD | 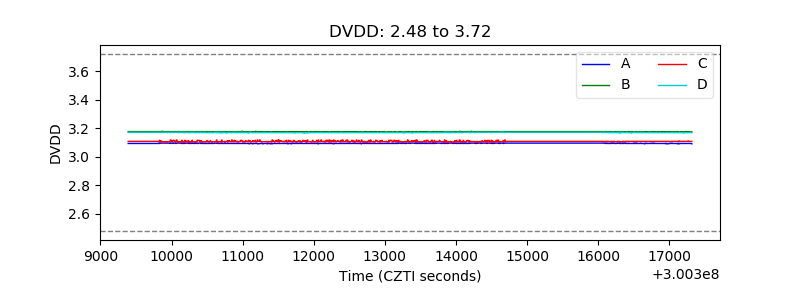 |
| Temperature 1 | 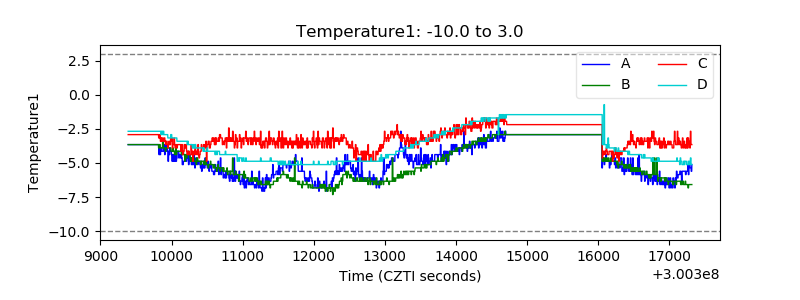 |
| Veto HV Monitor | 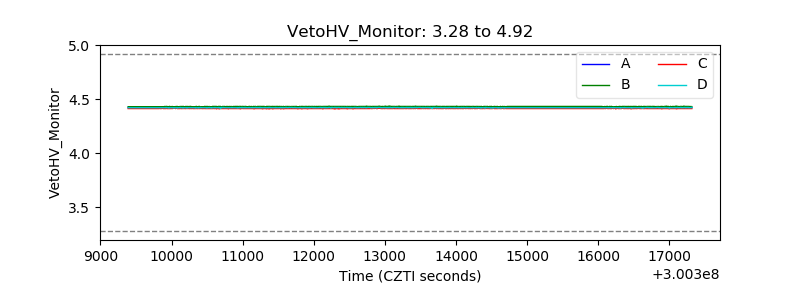 |
| Veto LLD | 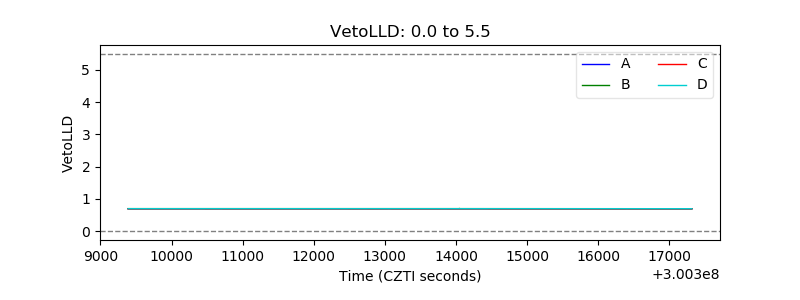 |
| Alpha Counter | 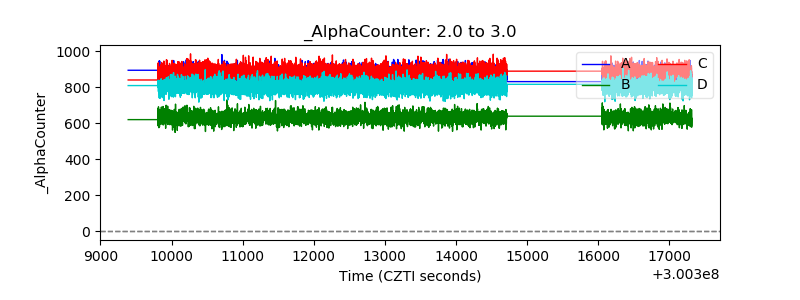 |
| _CPM_Rate | 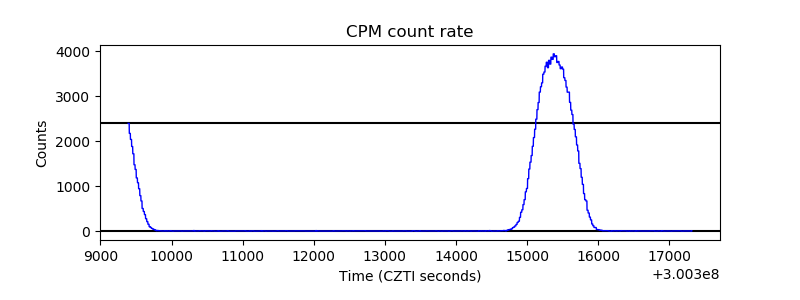 |
| CZT Counter | 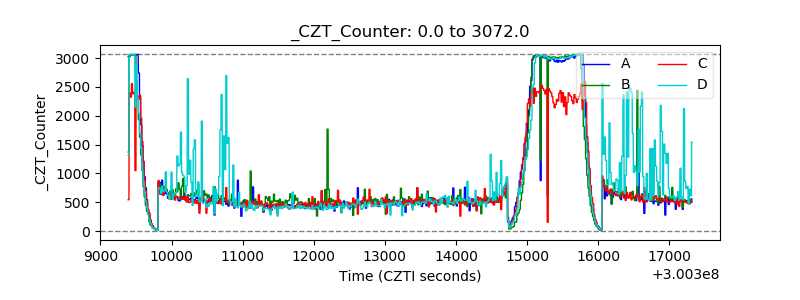 |
| +2.5 Volts monitor |  |
| +5 Volts monitor |  |
| _ROLL_ROT | 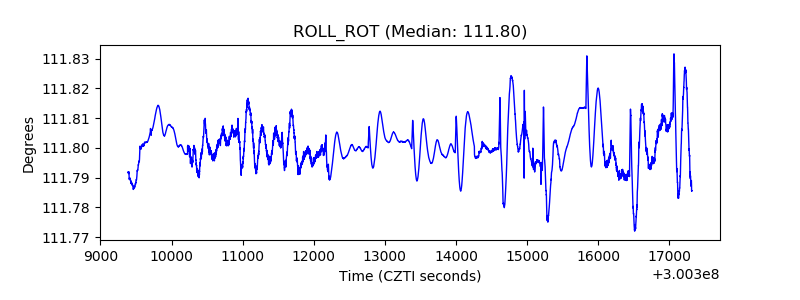 |
| _Roll_DEC | 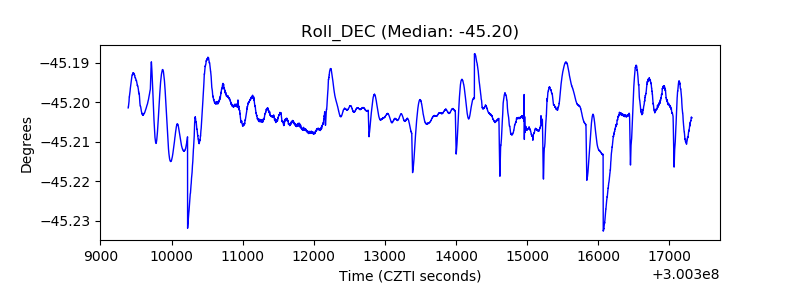 |
| _Roll_RA | 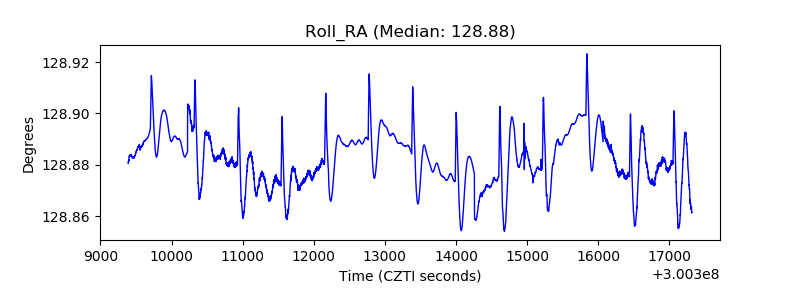 |
| Veto Counter | 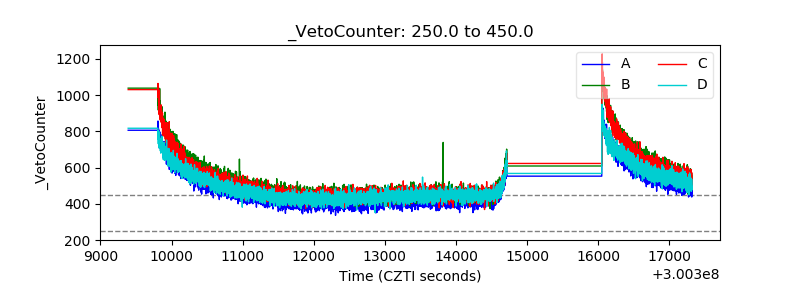 |