| Param | Original file | Final file |
|---|---|---|
| Filename | modeM0/AS1A05_188T01_9000003018_20424cztM0_level2.evt | modeM0/AS1A05_188T01_9000003018_20424cztM0_level2_quad_clean.evt |
| Size (bytes) | 606,288,960 | 67,072,320 |
| Size | 578.2 MB | 64.0 MB |
| Events in quadrant A | 3,466,863 | 421,980 |
| Events in quadrant B | 3,348,724 | 431,721 |
| Events in quadrant C | 3,308,152 | 411,722 |
| Events in quadrant D | 7,824,862 | 338,592 |
| Mode SS | |||
|---|---|---|---|
| Quadrant | BADHDUFLAG | Total packets | Discarded packets |
| A | 0 | 124 | 0 |
| B | 0 | 124 | 0 |
| C | 0 | 124 | 0 |
| D | 0 | 124 | 0 |
| Mode M9 | |||
|---|---|---|---|
| Quadrant | BADHDUFLAG | Total packets | Discarded packets |
| A | 0 | 25 | 0 |
| B | 0 | 26 | 0 |
| C | 0 | 26 | 0 |
| D | 0 | 26 | 0 |
| Mode M0 | |||
|---|---|---|---|
| Quadrant | BADHDUFLAG | Total packets | Discarded packets |
| A | 0 | 13871 | 2 |
| B | 0 | 13406 | 2 |
| C | 0 | 13234 | 2 |
| D | 0 | 27355 | 2 |
| Quadrant | Total seconds | Saturated seconds | Saturation percentage |
|---|---|---|---|
| A | 6105 | 60 | 0.982801% |
| B | 6105 | 66 | 1.081081% |
| C | 6105 | 82 | 1.343161% |
| D | 6105 | 1379 | 22.588043% |
Noise dominated data is calculated using 1-second bins in cleaned event files. If a bin has >2000 counts, and if more than 50% of those come from <1% of pixels, then it is considered to be noise-dominated and hence unusable.
| Quadrant | # 1 sec bins | Bins with >0 counts | Bins with >2000 counts | High rate bins dominated by noise | Noise dominated (total time) | Noise dominated (detector-on time) | Marked lightcurve |
|---|---|---|---|---|---|---|---|
| A | 7505 | 6106 | 7 | 7 | 0.09% | 0.11% | 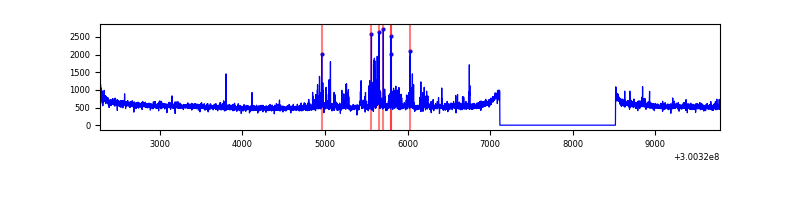 |
| B | 7505 | 6106 | 0 | 0 | 0.00% | 0.00% | 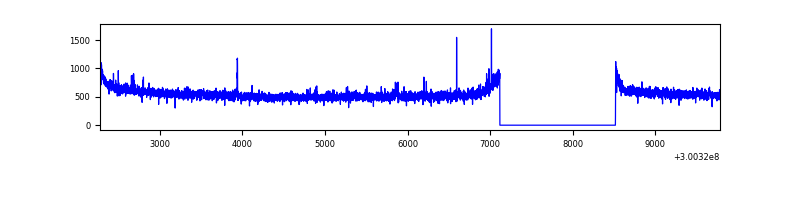 |
| C | 7505 | 6106 | 0 | 0 | 0.00% | 0.00% | 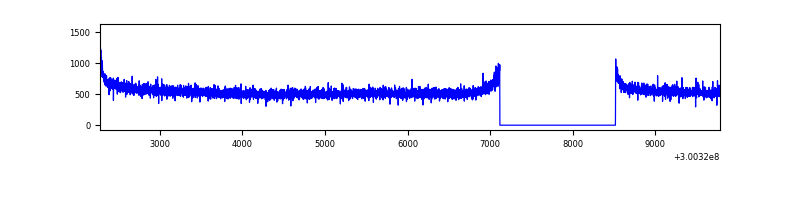 |
| D | 7505 | 6106 | 1379 | 1379 | 18.37% | 22.58% | 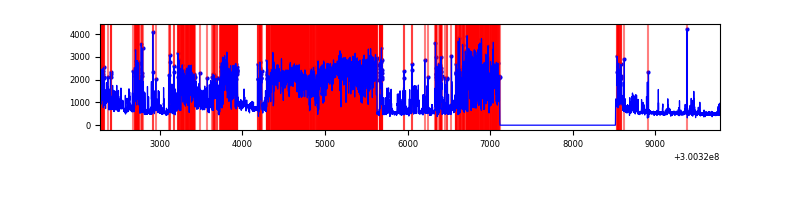 |
Top three noisy pixels from each quadrant. If the there are fewer than three noisy pixels in the level2.evt file, extra rows are filled as -1
| Pixel properties | Quadrant properties | ||||||
|---|---|---|---|---|---|---|---|
| Quadrant | DetID | PixID | Counts | Sigma | Mean | Median | Sigma |
| A | 5 | 16 | 205469 | 1238.43 | 844 | 831 | 165.2 |
| A | 0 | 226 | 7383 | 39.65 | 844 | 831 | 165.2 |
| A | 3 | 137 | 6252 | 32.81 | 844 | 831 | 165.2 |
| B | 10 | 245 | 17940 | 109.44 | 843 | 827 | 156.4 |
| B | 12 | 111 | 17918 | 109.3 | 843 | 827 | 156.4 |
| B | 11 | 111 | 16084 | 97.57 | 843 | 827 | 156.4 |
| C | 14 | 238 | 133152 | 712.81 | 812 | 818 | 185.7 |
| C | 3 | 233 | 10028 | 49.61 | 812 | 818 | 185.7 |
| C | 13 | 61 | 5862 | 27.17 | 812 | 818 | 185.7 |
| D | 2 | 16 | 4586536 | 25098.39 | 768 | 748 | 182.7 |
| D | 13 | 153 | 194782 | 1061.96 | 768 | 748 | 182.7 |
| D | 1 | 52 | 147312 | 802.16 | 768 | 748 | 182.7 |
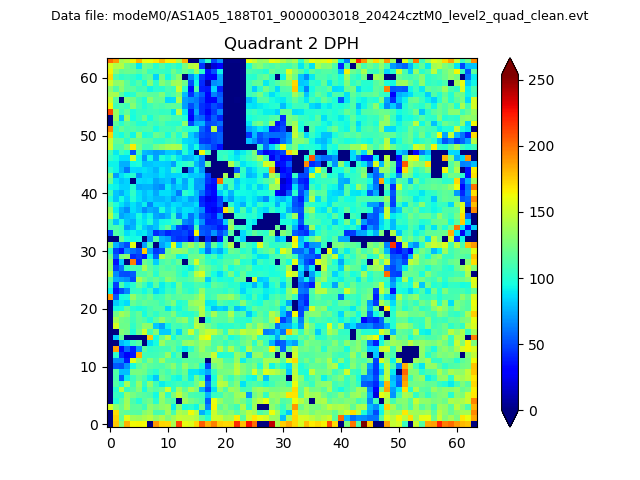
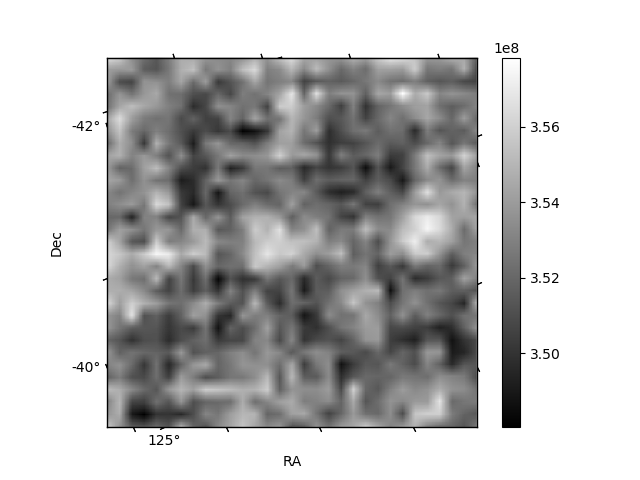
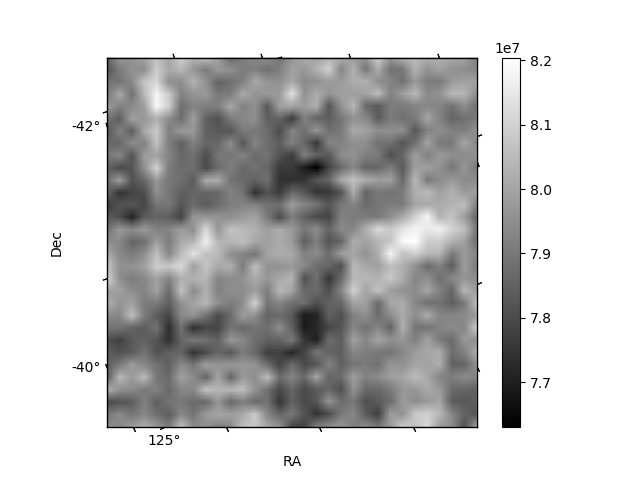
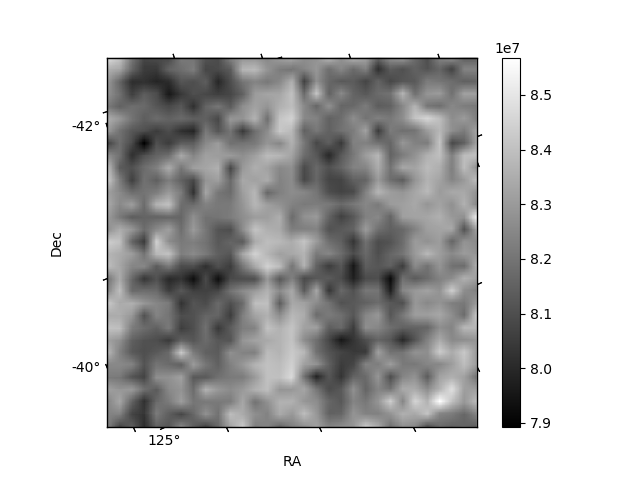
Histogram calculated using DETX and DETY for each event in the final _common_clean file
| Quadrant A | 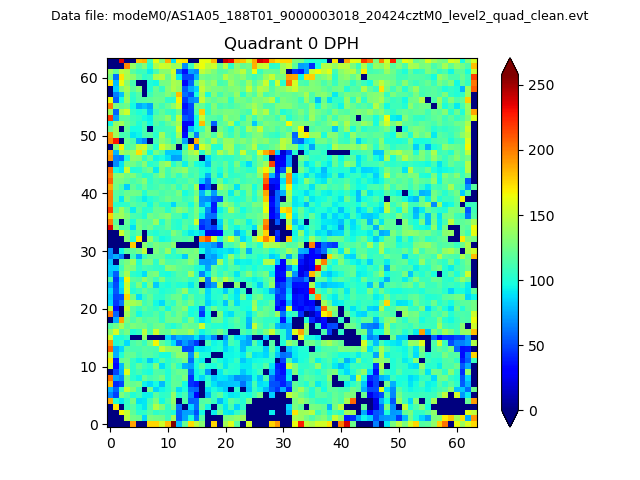 |
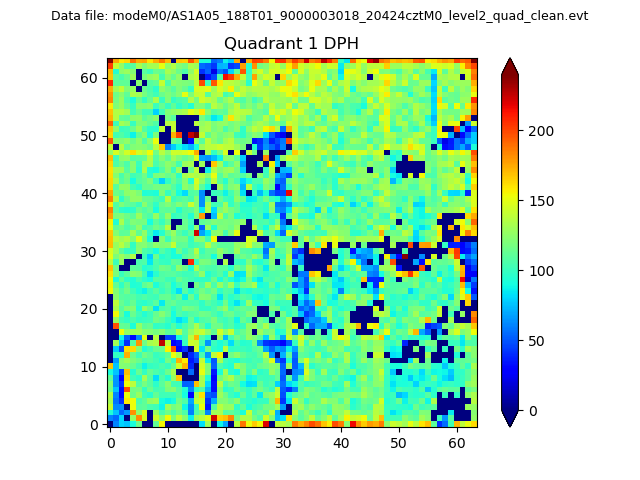 |
Quadrant B |
|---|---|---|---|
| Quadrant D | 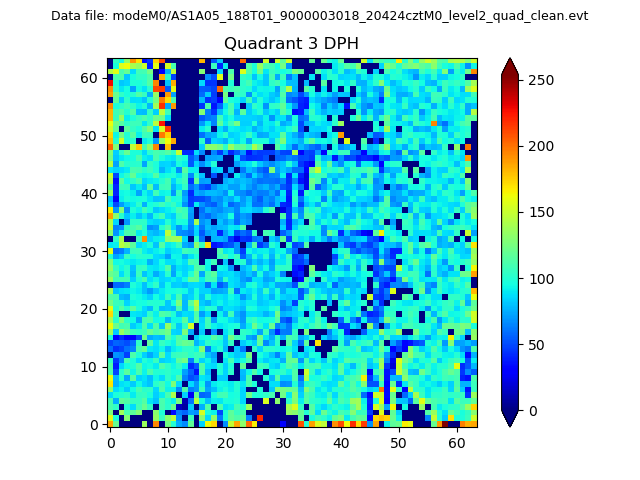 |
 |
Quadrant C |
| Plot type | Count rate plots | Images |
|---|---|---|
| Comparison with Poisson distribution Blue bars denote a histogram of data divided into 1 sec bins. Red curve is a Poisson curve with rate = median count rate of data. |
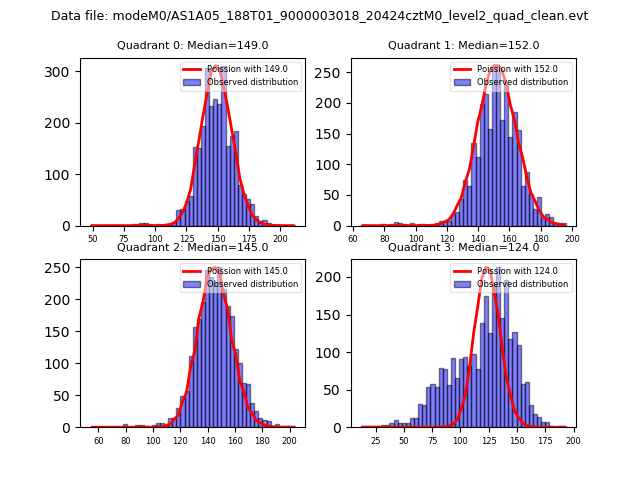 |
 |
| Quadrant-wise count rates Data is divided into 100 sec bins |
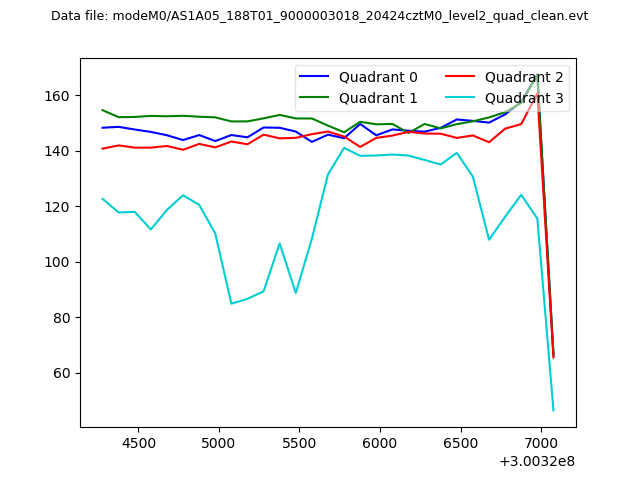 |
|
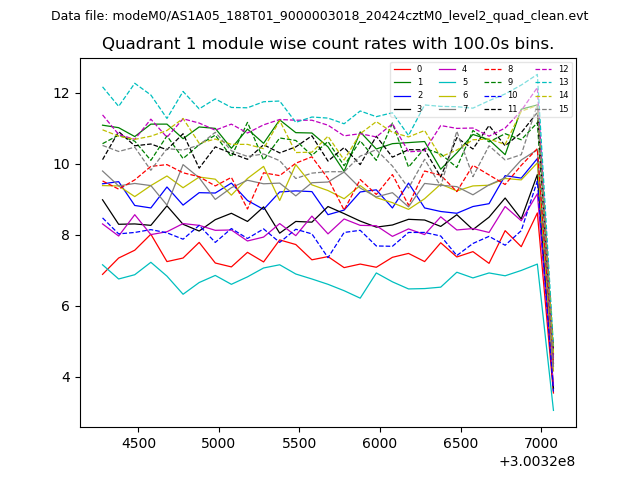
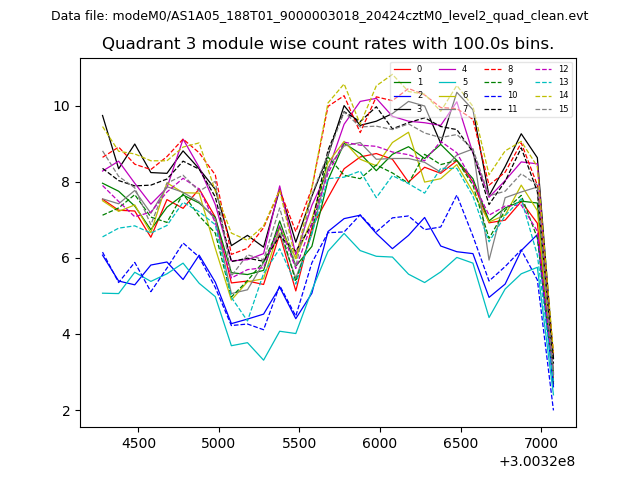
| Module-wise count rates for Quadrant A Data is divided into 100 sec bins |
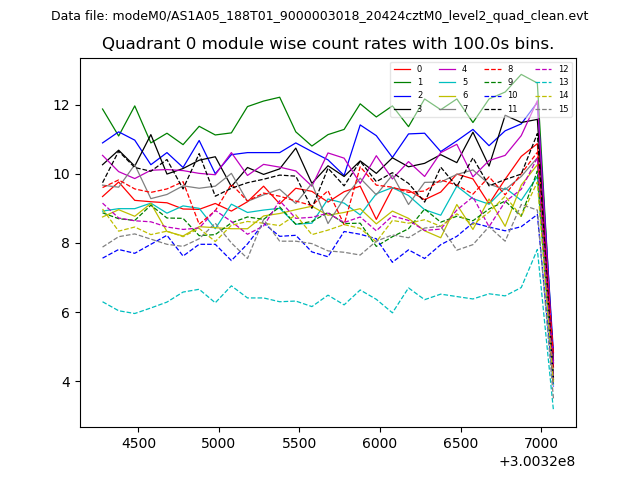 |
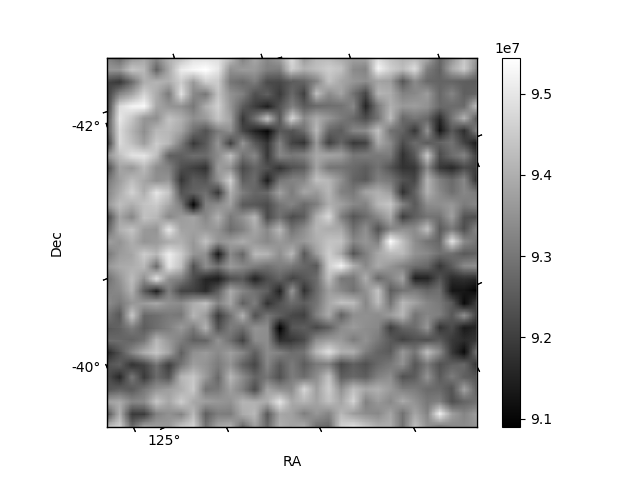 |
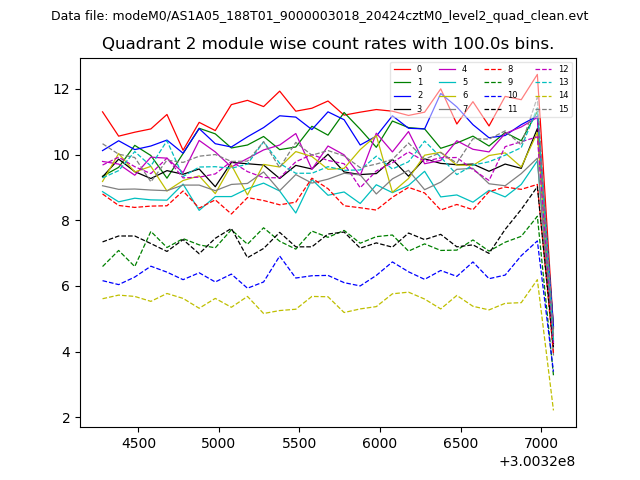
| Module-wise count rates for Quadrant B Data is divided into 100 sec bins |
 |
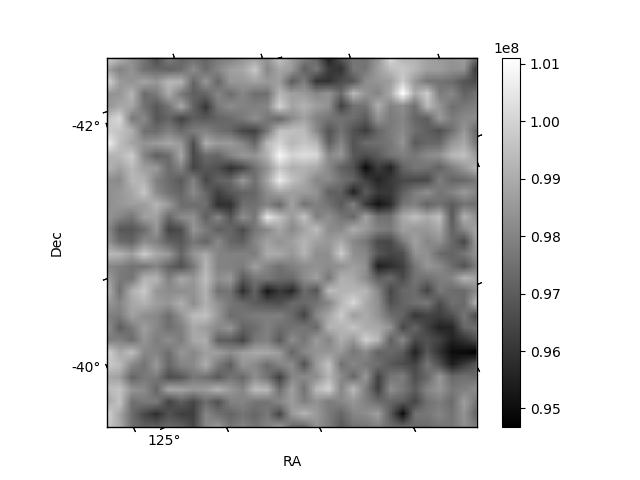 |
| Module-wise count rates for Quadrant C Data is divided into 100 sec bins |
 |
 |
| Module-wise count rates for Quadrant D Data is divided into 100 sec bins |
 |
 |
| Parameter | Plot |
|---|---|
| CZT HV Monitor | 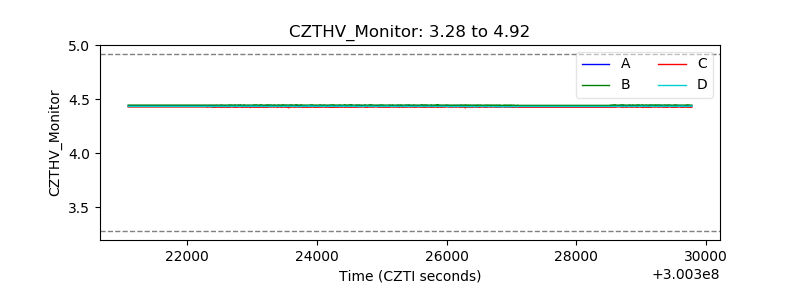 |
| D_VDD | 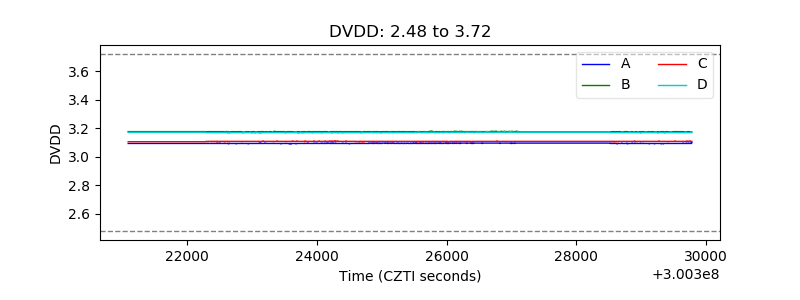 |
| Temperature 1 | 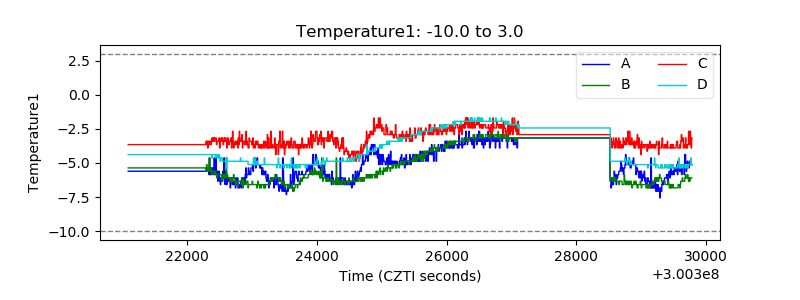 |
| Veto HV Monitor | 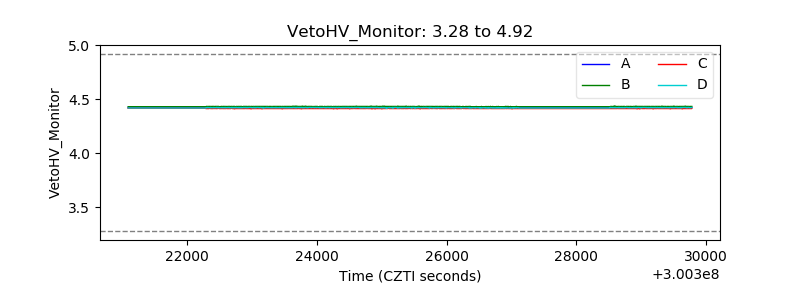 |
| Veto LLD | 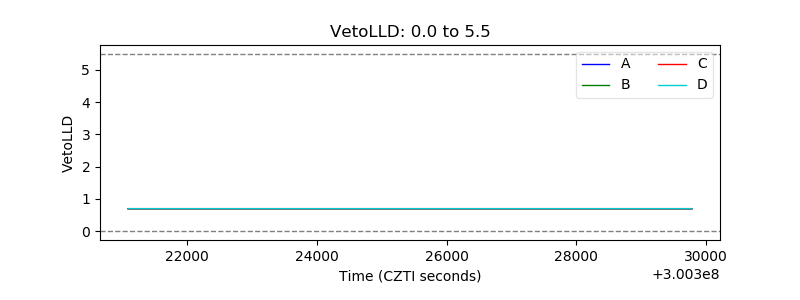 |
| Alpha Counter | 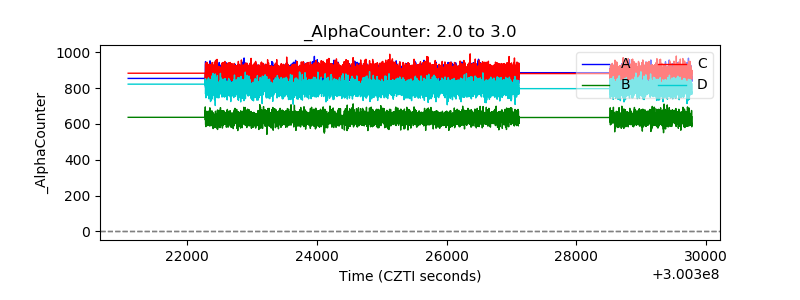 |
| _CPM_Rate | 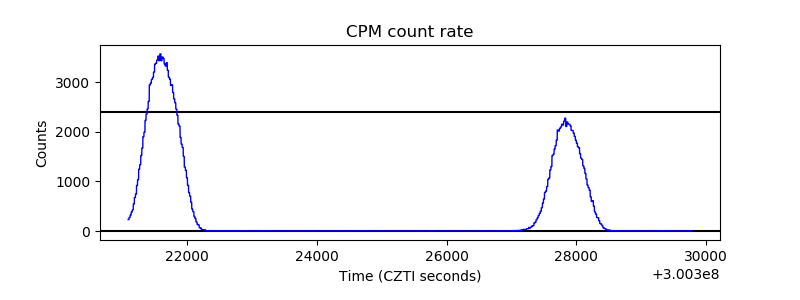 |
| CZT Counter | 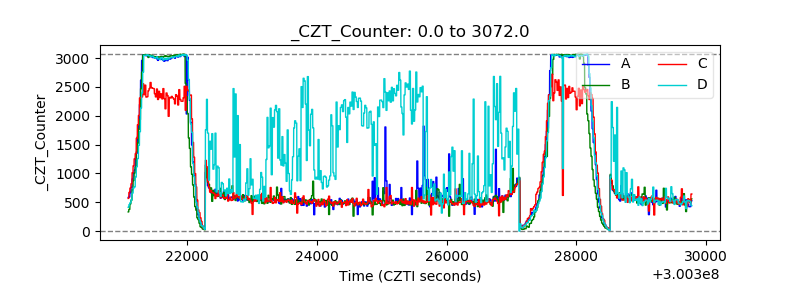 |
| +2.5 Volts monitor |  |
| +5 Volts monitor |  |
| _ROLL_ROT | 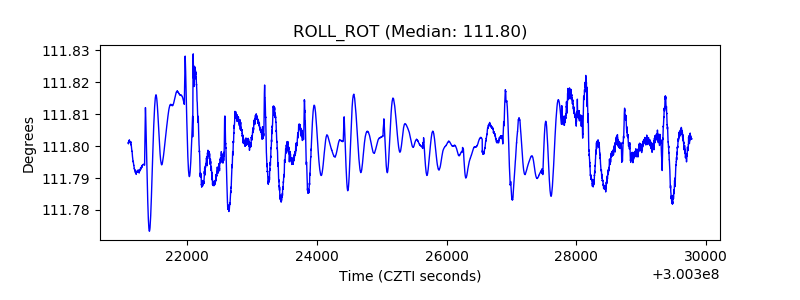 |
| _Roll_DEC | 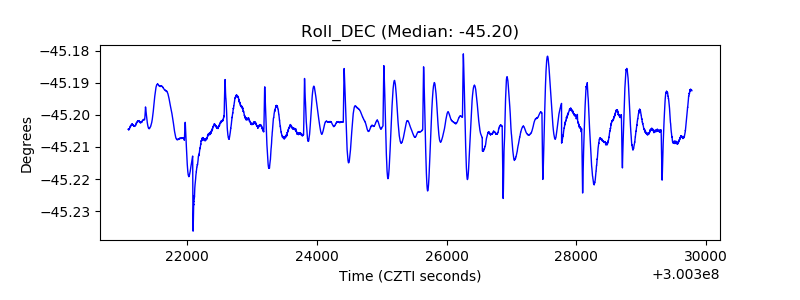 |
| _Roll_RA | 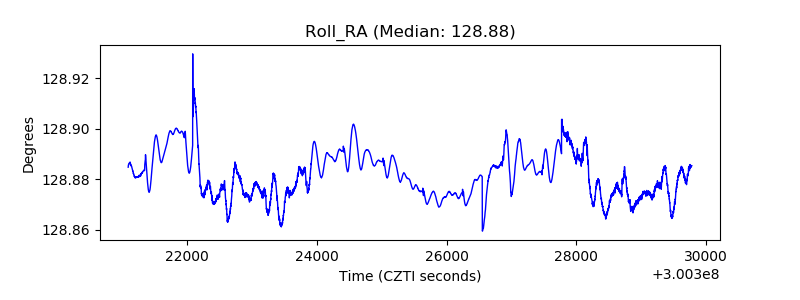 |
| Veto Counter | 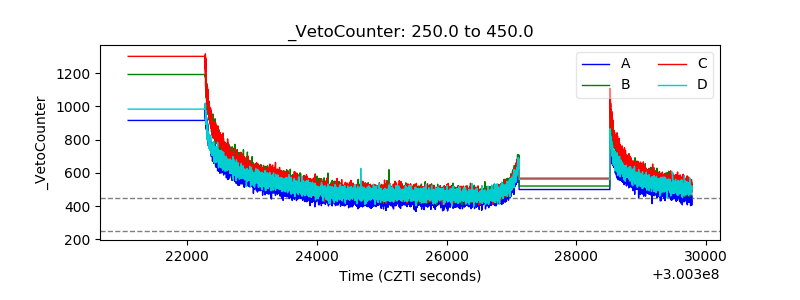 |