| Param | Original file | Final file |
|---|---|---|
| Filename | modeM0/AS1A05_188T01_9000003018_20425cztM0_level2.evt | modeM0/AS1A05_188T01_9000003018_20425cztM0_level2_quad_clean.evt |
| Size (bytes) | 497,453,760 | 79,974,720 |
| Size | 474.4 MB | 76.3 MB |
| Events in quadrant A | 3,245,208 | 506,349 |
| Events in quadrant B | 3,343,086 | 514,061 |
| Events in quadrant C | 3,302,549 | 492,139 |
| Events in quadrant D | 4,747,547 | 469,633 |
| Mode SS | |||
|---|---|---|---|
| Quadrant | BADHDUFLAG | Total packets | Discarded packets |
| A | 0 | 128 | 0 |
| B | 0 | 128 | 0 |
| C | 0 | 128 | 0 |
| D | 0 | 128 | 0 |
| Mode M9 | |||
|---|---|---|---|
| Quadrant | BADHDUFLAG | Total packets | Discarded packets |
| A | 0 | 22 | 0 |
| B | 0 | 23 | 0 |
| C | 0 | 23 | 0 |
| D | 0 | 23 | 0 |
| Mode M0 | |||
|---|---|---|---|
| Quadrant | BADHDUFLAG | Total packets | Discarded packets |
| A | 0 | 13270 | 2 |
| B | 0 | 13448 | 2 |
| C | 0 | 13289 | 2 |
| D | 0 | 18193 | 2 |
| Quadrant | Total seconds | Saturated seconds | Saturation percentage |
|---|---|---|---|
| A | 6295 | 52 | 0.826052% |
| B | 6295 | 91 | 1.445592% |
| C | 6295 | 117 | 1.858618% |
| D | 6295 | 255 | 4.050834% |
Noise dominated data is calculated using 1-second bins in cleaned event files. If a bin has >2000 counts, and if more than 50% of those come from <1% of pixels, then it is considered to be noise-dominated and hence unusable.
| Quadrant | # 1 sec bins | Bins with >0 counts | Bins with >2000 counts | High rate bins dominated by noise | Noise dominated (total time) | Noise dominated (detector-on time) | Marked lightcurve |
|---|---|---|---|---|---|---|---|
| A | 7570 | 6296 | 0 | 0 | 0.00% | 0.00% | 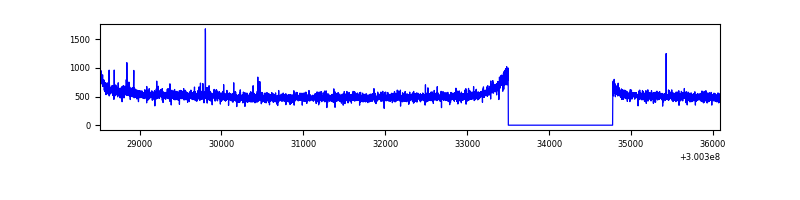 |
| B | 7570 | 6295 | 2 | 2 | 0.03% | 0.03% | 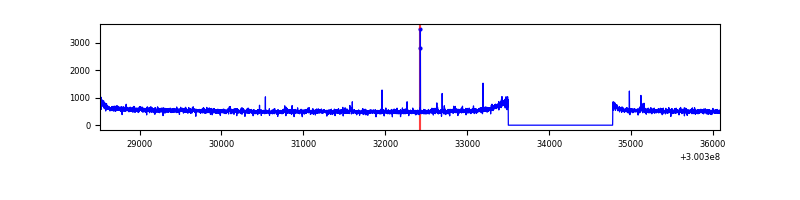 |
| C | 7570 | 6296 | 0 | 0 | 0.00% | 0.00% | 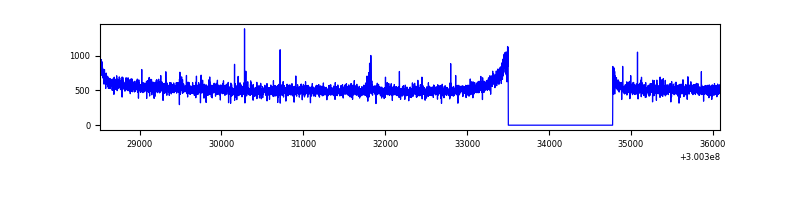 |
| D | 7570 | 6296 | 186 | 186 | 2.46% | 2.95% | 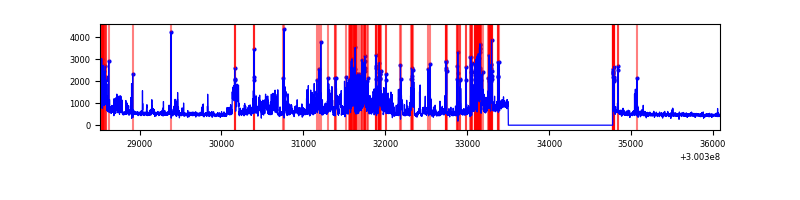 |
Top three noisy pixels from each quadrant. If the there are fewer than three noisy pixels in the level2.evt file, extra rows are filled as -1
| Pixel properties | Quadrant properties | ||||||
|---|---|---|---|---|---|---|---|
| Quadrant | DetID | PixID | Counts | Sigma | Mean | Median | Sigma |
| A | 5 | 16 | 20009 | 116.59 | 836 | 820 | 164.6 |
| A | 0 | 226 | 7206 | 38.8 | 836 | 820 | 164.6 |
| A | 3 | 137 | 6510 | 34.57 | 836 | 820 | 164.6 |
| B | 10 | 245 | 34830 | 219.35 | 833 | 815 | 155.1 |
| B | 12 | 111 | 18307 | 112.8 | 833 | 815 | 155.1 |
| B | 11 | 111 | 16728 | 102.62 | 833 | 815 | 155.1 |
| C | 14 | 238 | 129411 | 699.97 | 807 | 813 | 183.7 |
| C | 3 | 233 | 16971 | 87.95 | 807 | 813 | 183.7 |
| C | 13 | 61 | 5774 | 27.0 | 807 | 813 | 183.7 |
| D | 2 | 16 | 1280299 | 6630.93 | 807 | 785 | 193.0 |
| D | 13 | 153 | 289632 | 1496.91 | 807 | 785 | 193.0 |
| D | 1 | 52 | 138036 | 711.29 | 807 | 785 | 193.0 |
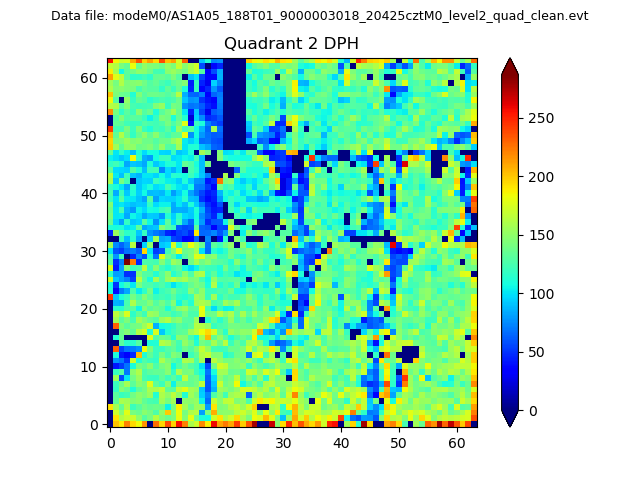
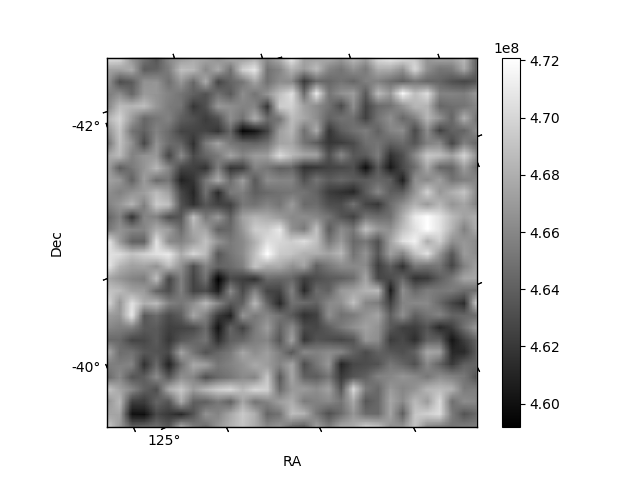
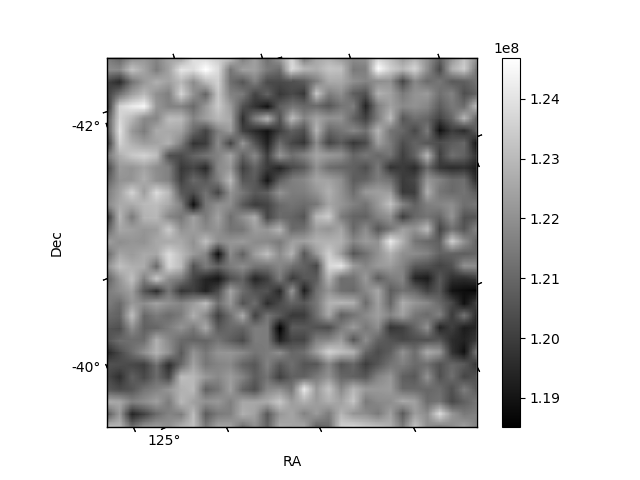
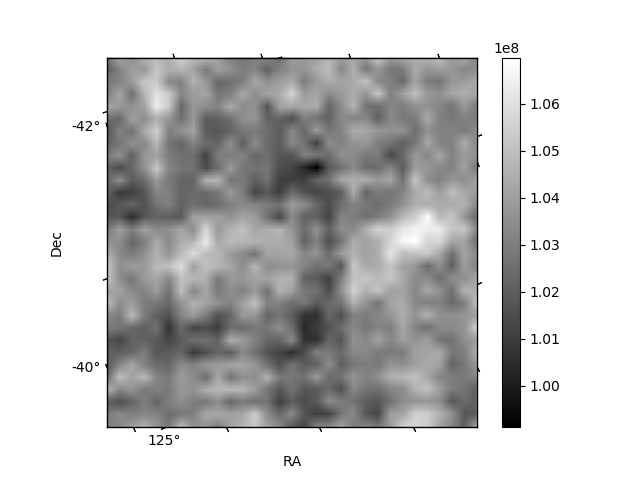
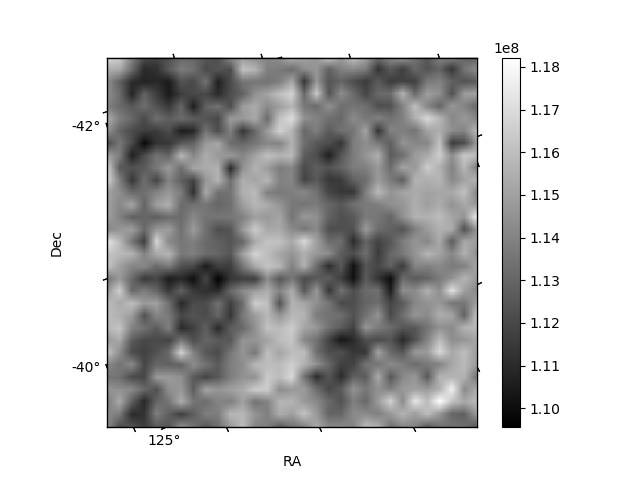
Histogram calculated using DETX and DETY for each event in the final _common_clean file
| Quadrant A | 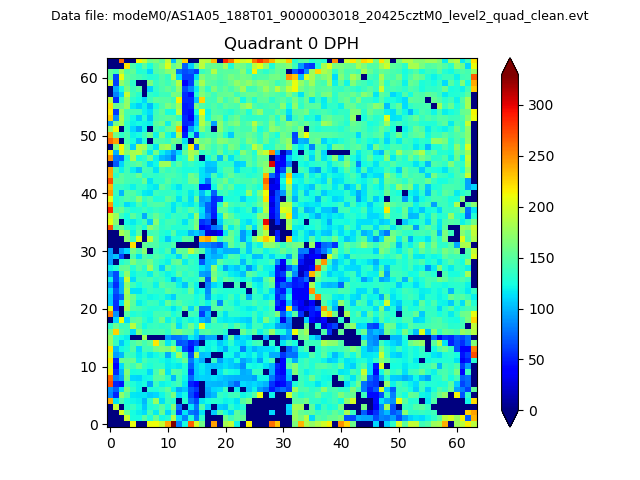 |
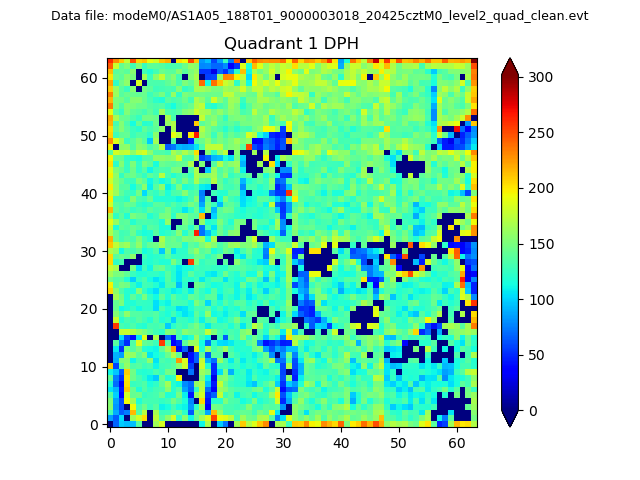 |
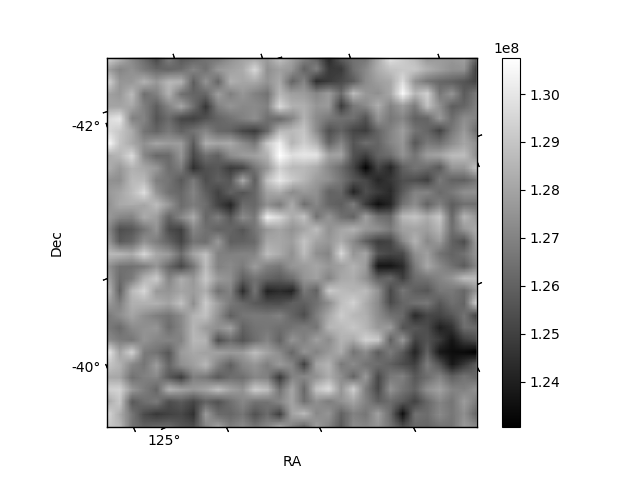
Quadrant B |
|---|---|---|---|
| Quadrant D | 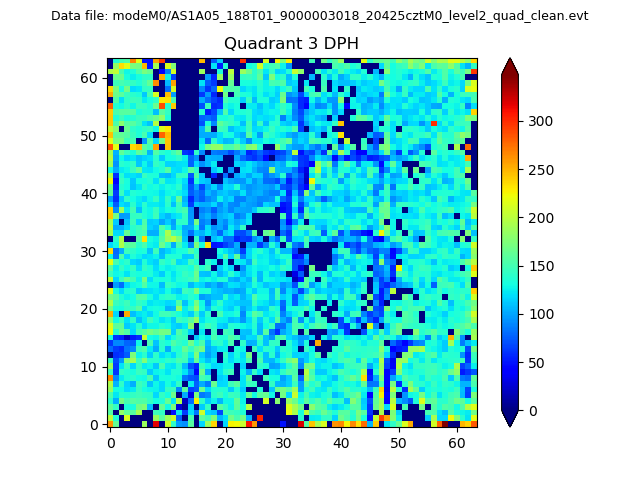 |
 |
Quadrant C |
| Plot type | Count rate plots | Images |
|---|---|---|
| Comparison with Poisson distribution Blue bars denote a histogram of data divided into 1 sec bins. Red curve is a Poisson curve with rate = median count rate of data. |
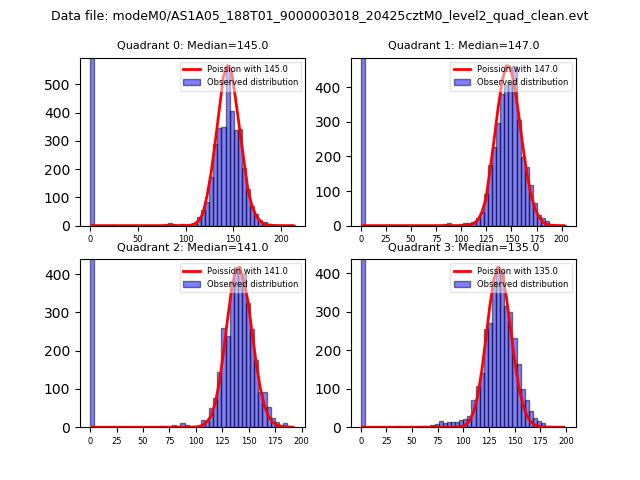 |
 |
| Quadrant-wise count rates Data is divided into 100 sec bins |
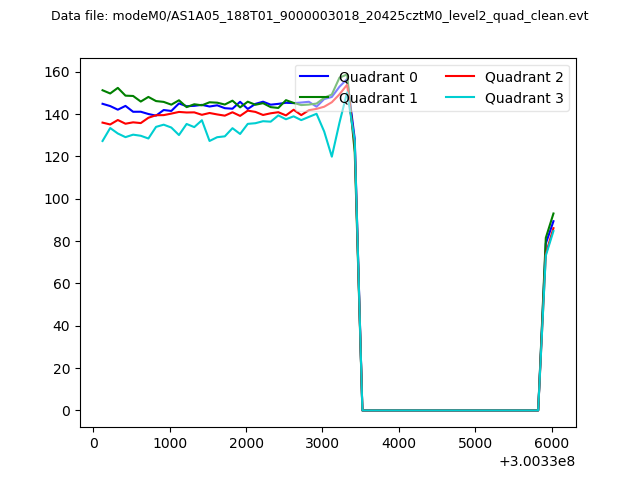 |
|
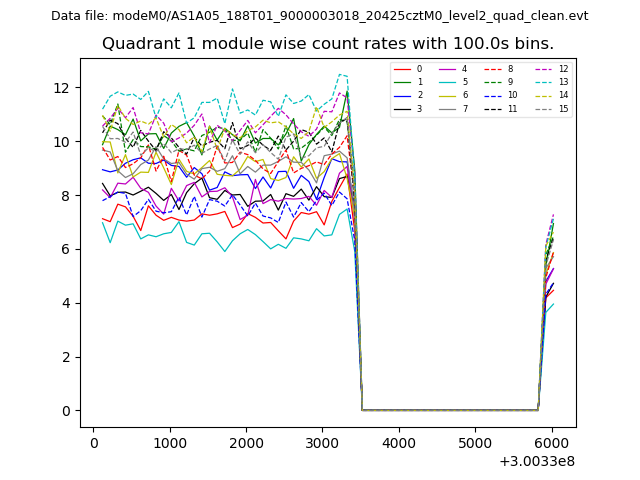
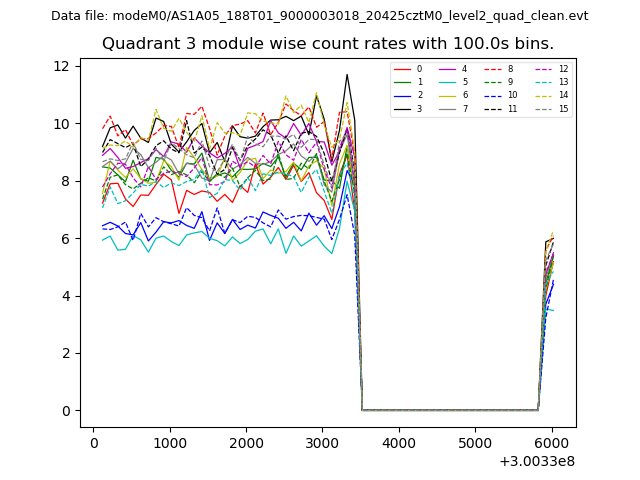
| Module-wise count rates for Quadrant A Data is divided into 100 sec bins |
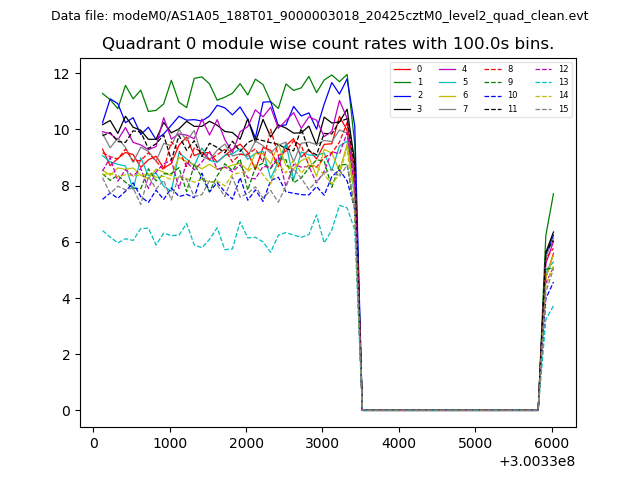 |
 |
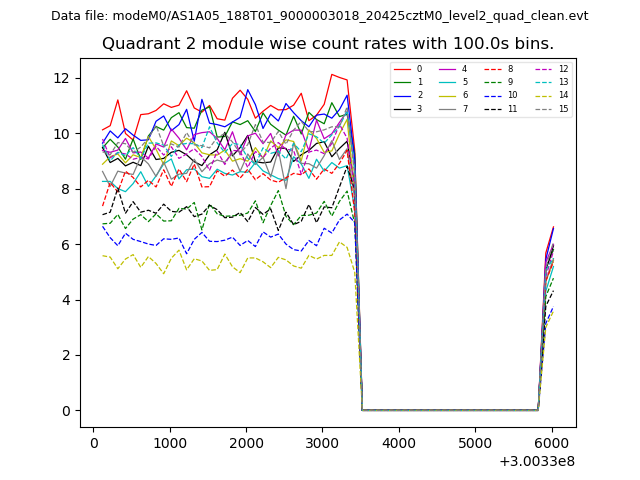
| Module-wise count rates for Quadrant B Data is divided into 100 sec bins |
 |
 |
| Module-wise count rates for Quadrant C Data is divided into 100 sec bins |
 |
 |
| Module-wise count rates for Quadrant D Data is divided into 100 sec bins |
 |
 |
| Parameter | Plot |
|---|---|
| CZT HV Monitor | 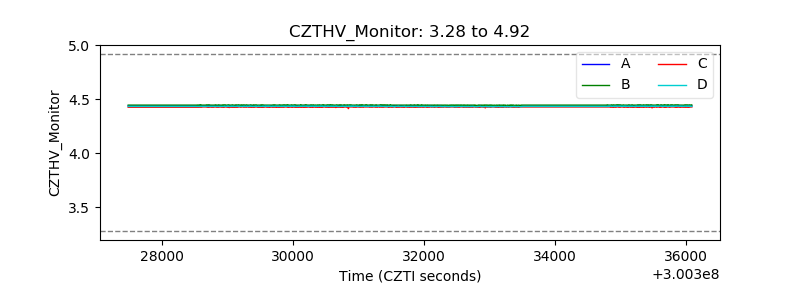 |
| D_VDD | 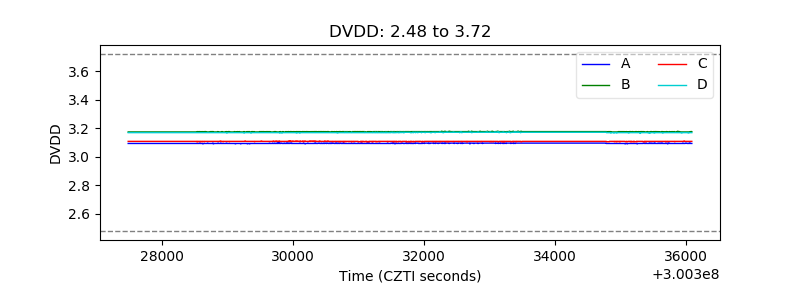 |
| Temperature 1 | 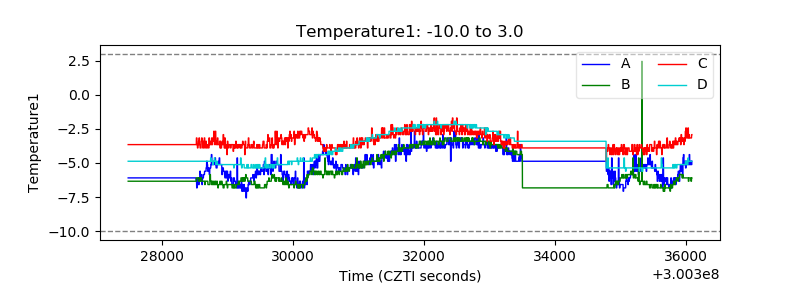 |
| Veto HV Monitor |  |
| Veto LLD | 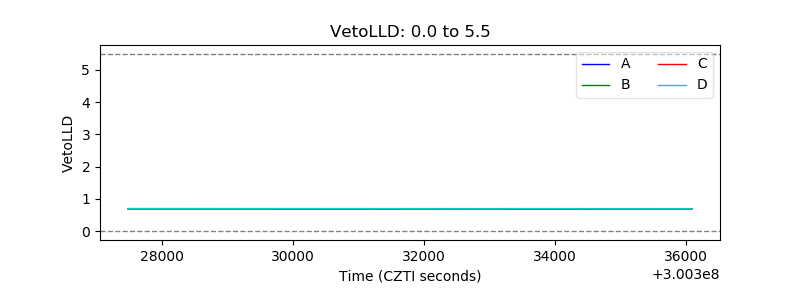 |
| Alpha Counter | 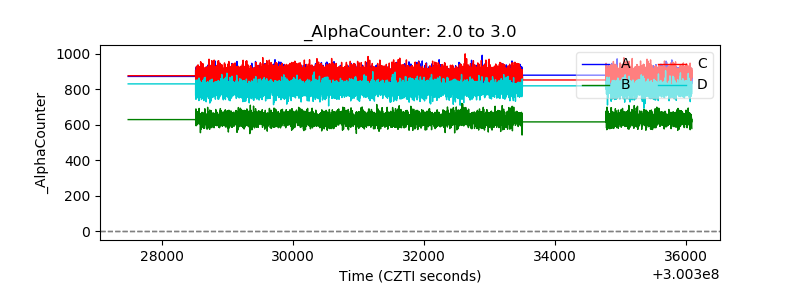 |
| _CPM_Rate | 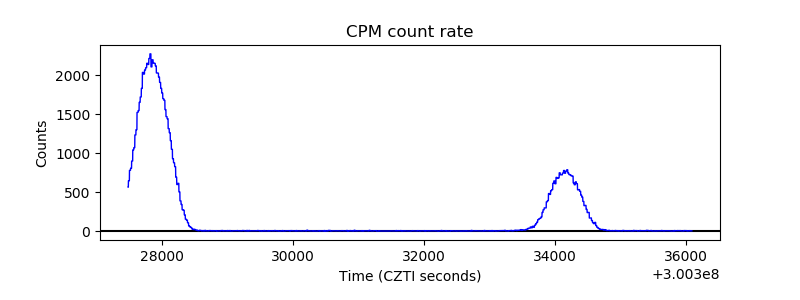 |
| CZT Counter | 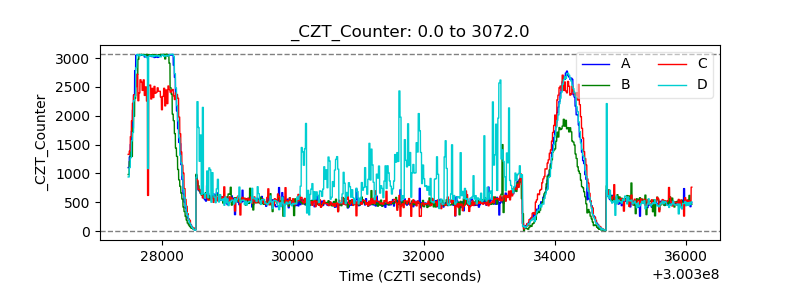 |
| +2.5 Volts monitor |  |
| +5 Volts monitor |  |
| _ROLL_ROT | 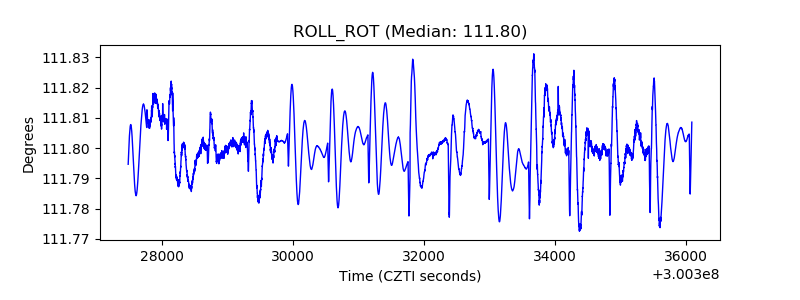 |
| _Roll_DEC | 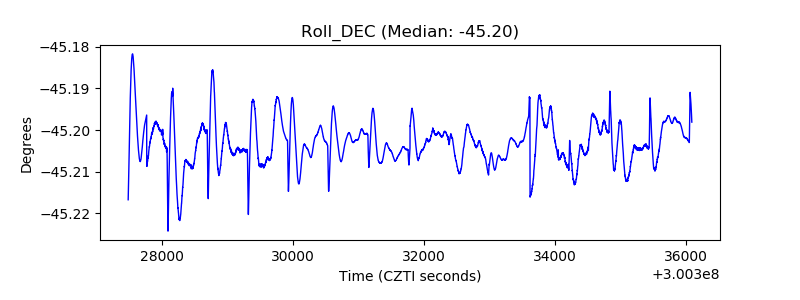 |
| _Roll_RA | 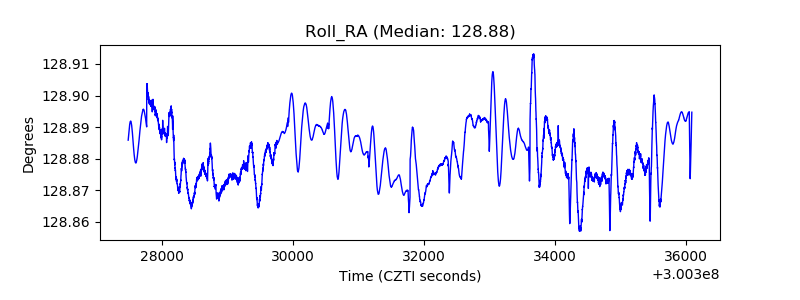 |
| Veto Counter | 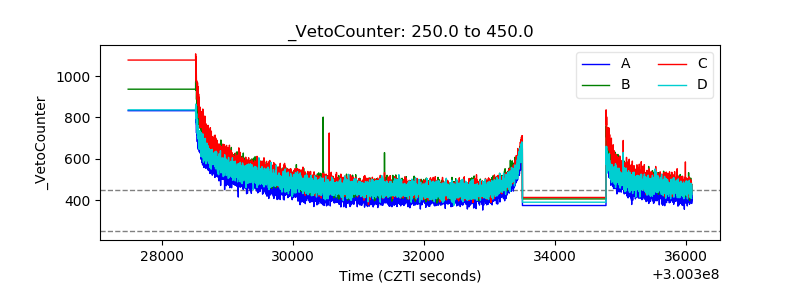 |