| Param | Original file | Final file |
|---|---|---|
| Filename | modeM0/AS1A05_188T01_9000003018_20426cztM0_level2.evt | modeM0/AS1A05_188T01_9000003018_20426cztM0_level2_quad_clean.evt |
| Size (bytes) | 588,718,080 | 89,176,320 |
| Size | 561.4 MB | 85.0 MB |
| Events in quadrant A | 3,221,472 | 587,996 |
| Events in quadrant B | 3,349,475 | 592,020 |
| Events in quadrant C | 3,281,783 | 570,618 |
| Events in quadrant D | 7,525,629 | 485,552 |
| Mode SS | |||
|---|---|---|---|
| Quadrant | BADHDUFLAG | Total packets | Discarded packets |
| A | 0 | 136 | 0 |
| B | 0 | 136 | 0 |
| C | 0 | 136 | 0 |
| D | 0 | 136 | 0 |
| Mode M9 | |||
|---|---|---|---|
| Quadrant | BADHDUFLAG | Total packets | Discarded packets |
| A | 0 | 13 | 0 |
| B | 0 | 14 | 0 |
| C | 0 | 14 | 0 |
| D | 0 | 14 | 0 |
| Mode M0 | |||
|---|---|---|---|
| Quadrant | BADHDUFLAG | Total packets | Discarded packets |
| A | 0 | 13588 | 2 |
| B | 0 | 13864 | 2 |
| C | 0 | 13619 | 2 |
| D | 0 | 26709 | 2 |
| Quadrant | Total seconds | Saturated seconds | Saturation percentage |
|---|---|---|---|
| A | 6648 | 37 | 0.556558% |
| B | 6648 | 70 | 1.052948% |
| C | 6648 | 94 | 1.413959% |
| D | 6648 | 1534 | 23.074609% |
Noise dominated data is calculated using 1-second bins in cleaned event files. If a bin has >2000 counts, and if more than 50% of those come from <1% of pixels, then it is considered to be noise-dominated and hence unusable.
| Quadrant | # 1 sec bins | Bins with >0 counts | Bins with >2000 counts | High rate bins dominated by noise | Noise dominated (total time) | Noise dominated (detector-on time) | Marked lightcurve |
|---|---|---|---|---|---|---|---|
| A | 7558 | 6649 | 0 | 0 | 0.00% | 0.00% | 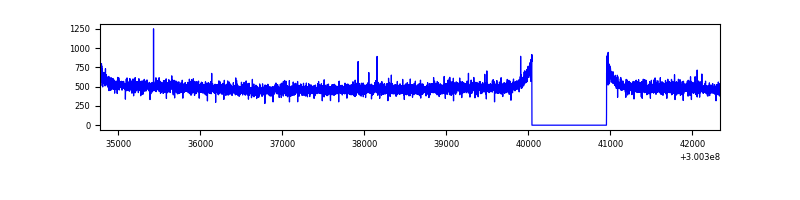 |
| B | 7558 | 6649 | 1 | 1 | 0.01% | 0.02% | 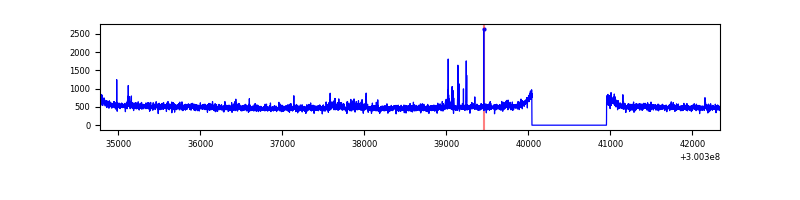 |
| C | 7558 | 6649 | 0 | 0 | 0.00% | 0.00% | 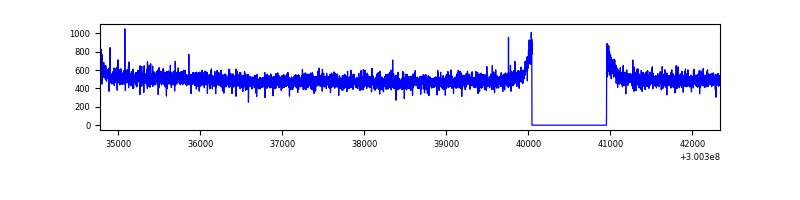 |
| D | 7558 | 6649 | 1512 | 1512 | 20.01% | 22.74% | 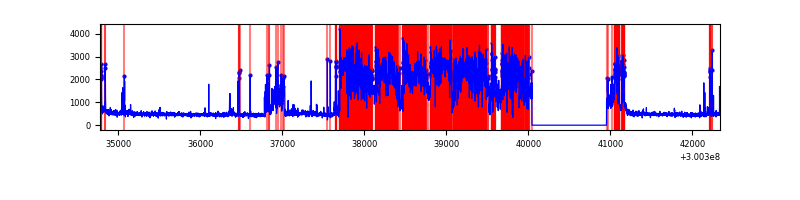 |
Top three noisy pixels from each quadrant. If the there are fewer than three noisy pixels in the level2.evt file, extra rows are filled as -1
| Pixel properties | Quadrant properties | ||||||
|---|---|---|---|---|---|---|---|
| Quadrant | DetID | PixID | Counts | Sigma | Mean | Median | Sigma |
| A | 0 | 226 | 7161 | 38.06 | 837 | 820 | 166.6 |
| A | 3 | 137 | 6875 | 36.34 | 837 | 820 | 166.6 |
| A | 13 | 254 | 6041 | 31.33 | 837 | 820 | 166.6 |
| B | 4 | 216 | 32187 | 198.81 | 831 | 810 | 157.8 |
| B | 10 | 245 | 27101 | 166.58 | 831 | 810 | 157.8 |
| B | 12 | 111 | 19303 | 117.17 | 831 | 810 | 157.8 |
| C | 14 | 238 | 129625 | 692.39 | 804 | 810 | 186.0 |
| C | 3 | 233 | 14802 | 75.21 | 804 | 810 | 186.0 |
| C | 13 | 61 | 5662 | 26.08 | 804 | 810 | 186.0 |
| D | 1 | 52 | 4292071 | 23661.89 | 754 | 732 | 181.4 |
| D | 2 | 165 | 200775 | 1103.01 | 754 | 732 | 181.4 |
| D | 13 | 153 | 140215 | 769.09 | 754 | 732 | 181.4 |
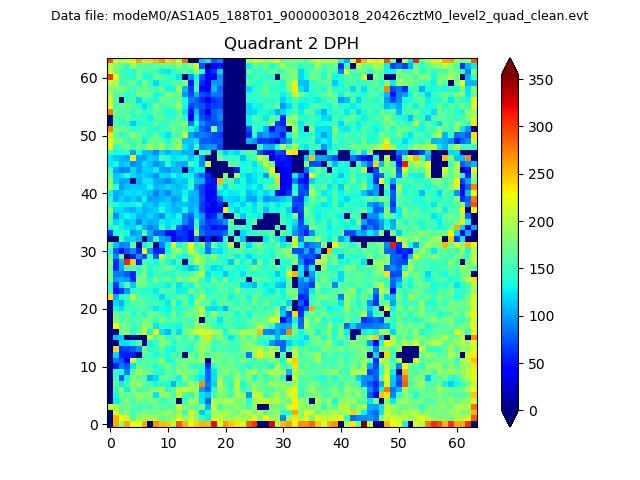
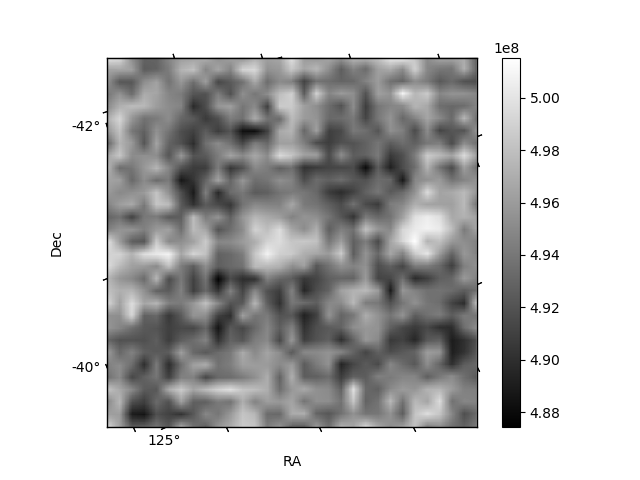
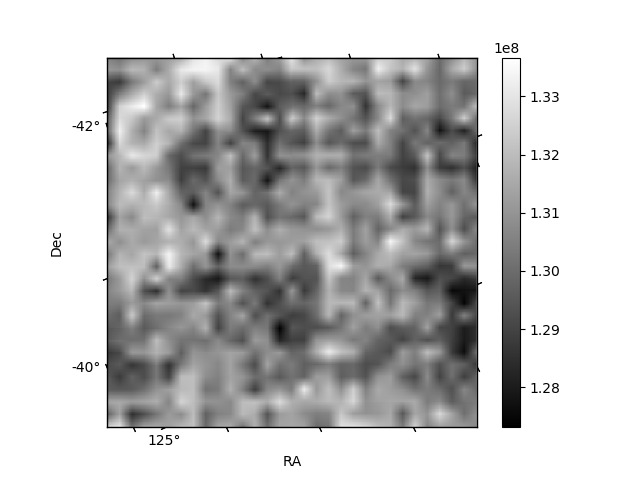
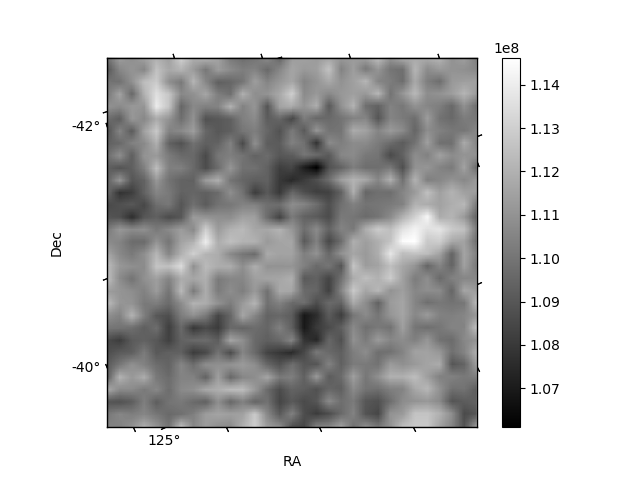
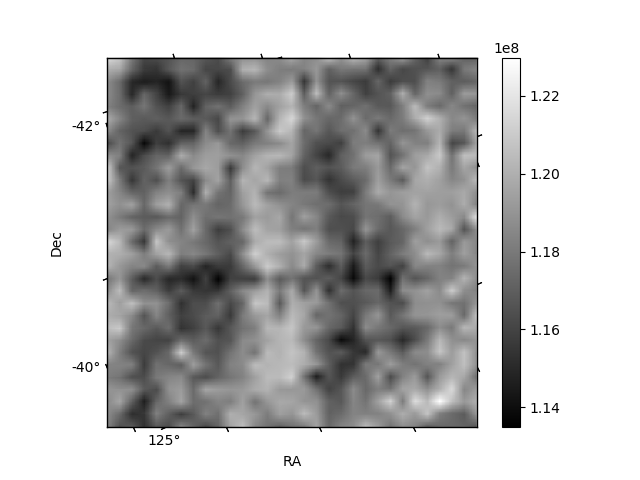
Histogram calculated using DETX and DETY for each event in the final _common_clean file
| Quadrant A | 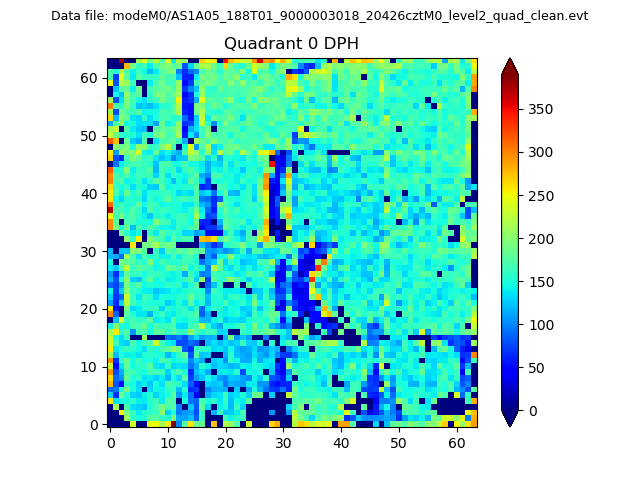 |
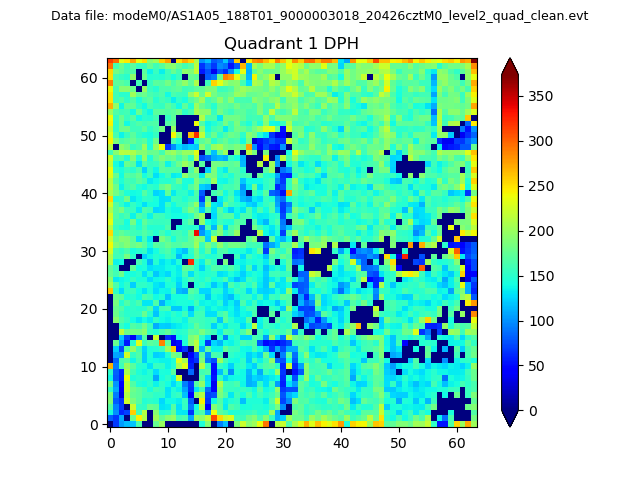 |
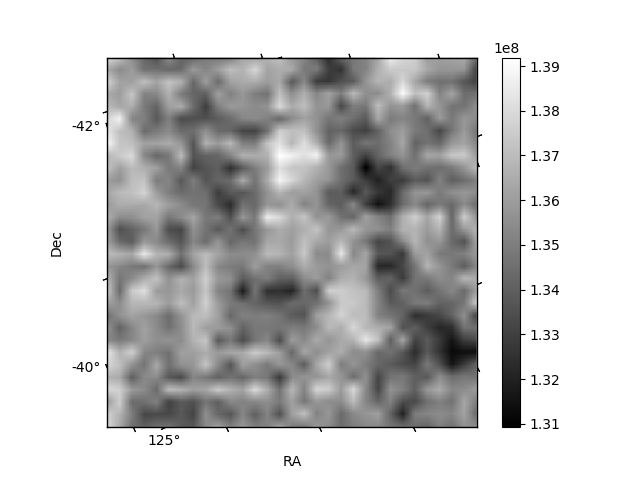
Quadrant B |
|---|---|---|---|
| Quadrant D | 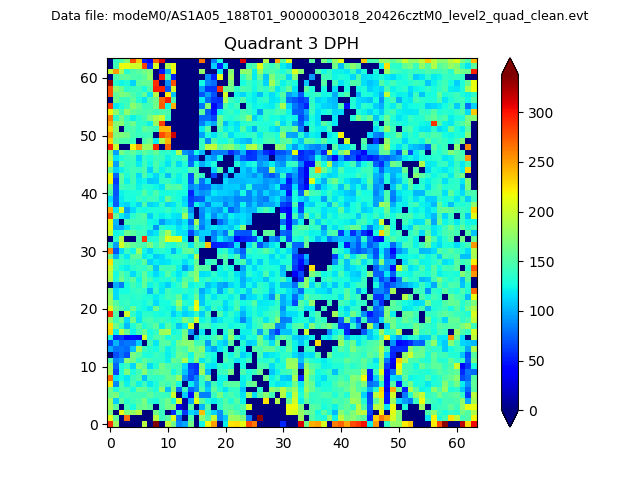 |
 |
Quadrant C |
| Plot type | Count rate plots | Images |
|---|---|---|
| Comparison with Poisson distribution Blue bars denote a histogram of data divided into 1 sec bins. Red curve is a Poisson curve with rate = median count rate of data. |
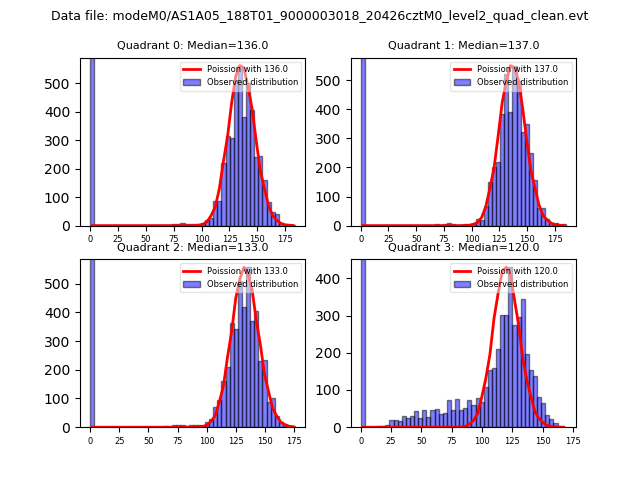 |
 |
| Quadrant-wise count rates Data is divided into 100 sec bins |
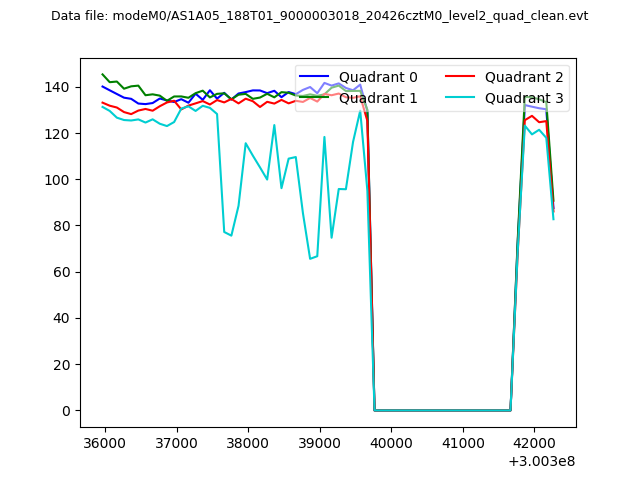 |
|
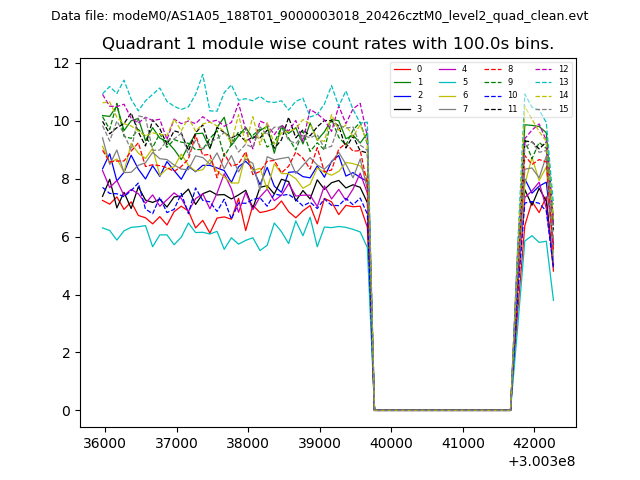
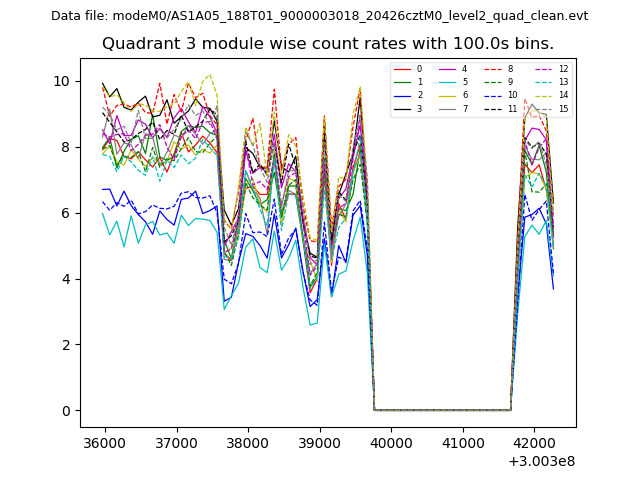
| Module-wise count rates for Quadrant A Data is divided into 100 sec bins |
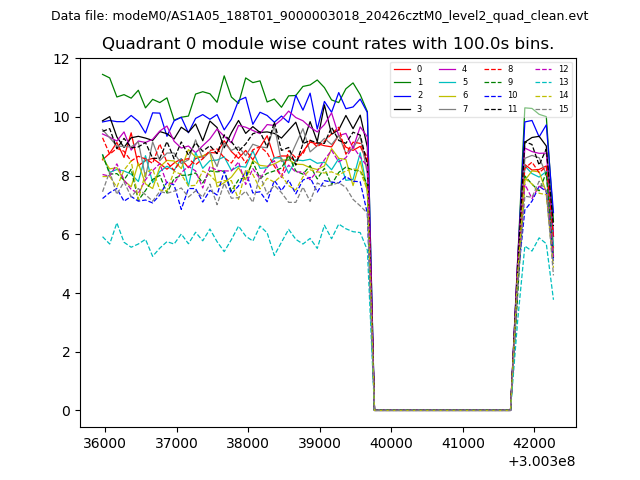 |
 |
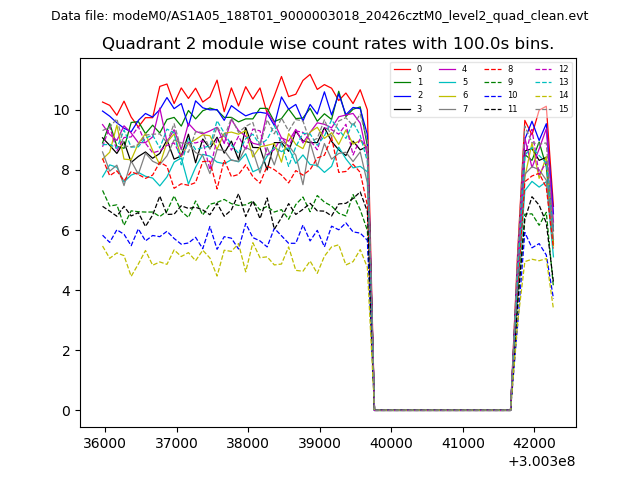
| Module-wise count rates for Quadrant B Data is divided into 100 sec bins |
 |
 |
| Module-wise count rates for Quadrant C Data is divided into 100 sec bins |
 |
 |
| Module-wise count rates for Quadrant D Data is divided into 100 sec bins |
 |
 |
| Parameter | Plot |
|---|---|
| CZT HV Monitor | 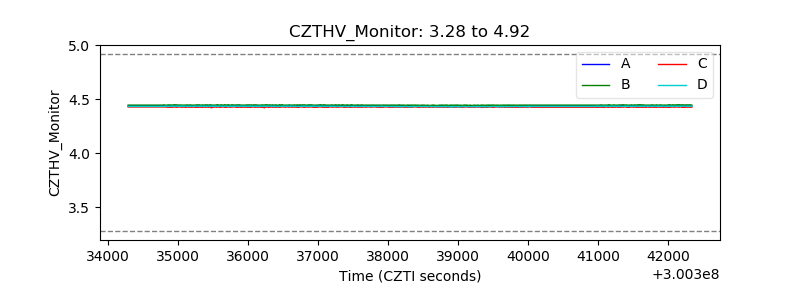 |
| D_VDD | 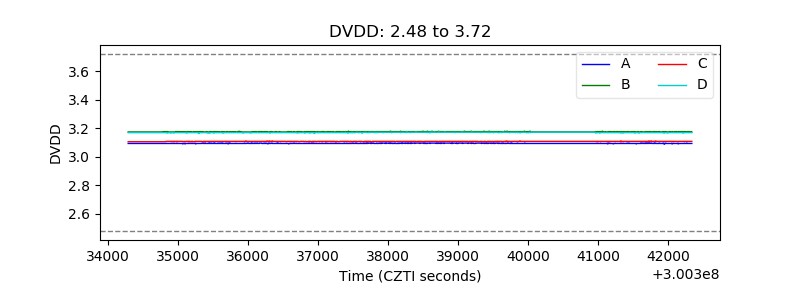 |
| Temperature 1 |  |
| Veto HV Monitor | 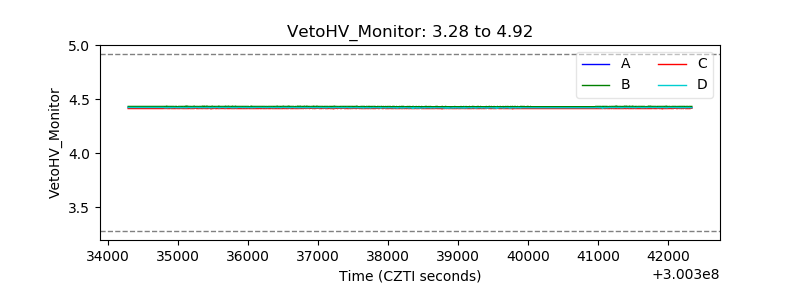 |
| Veto LLD | 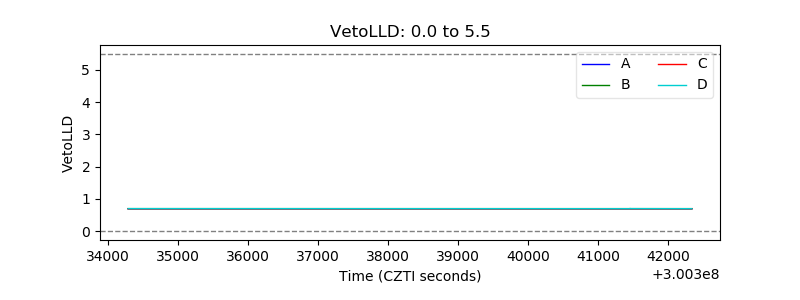 |
| Alpha Counter | 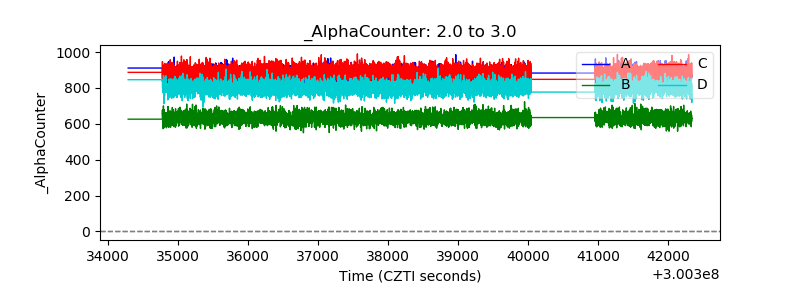 |
| _CPM_Rate | 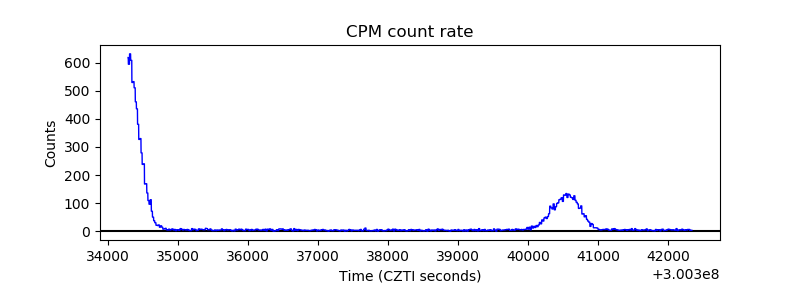 |
| CZT Counter | 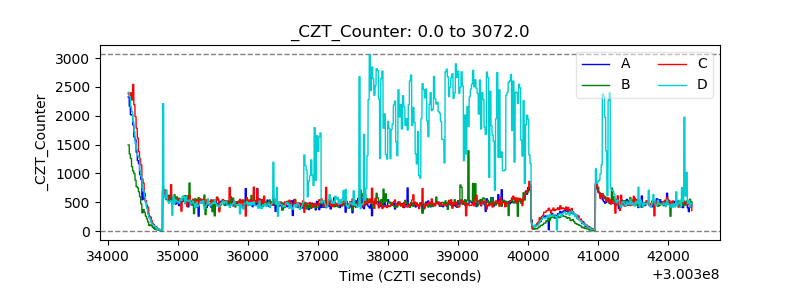 |
| +2.5 Volts monitor | 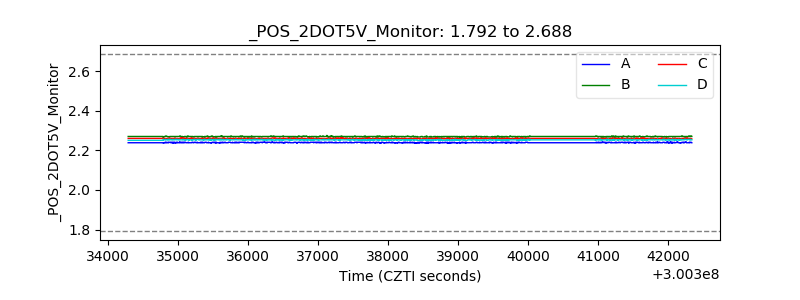 |
| +5 Volts monitor |  |
| _ROLL_ROT | 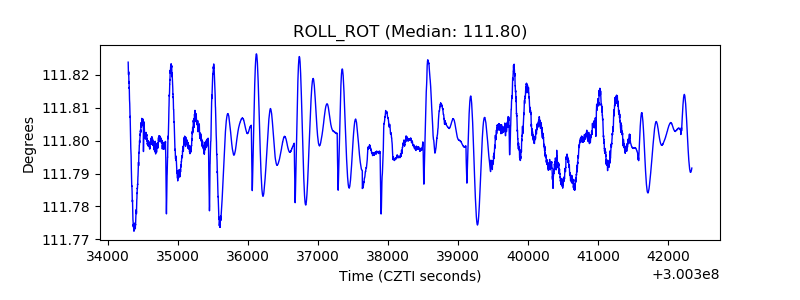 |
| _Roll_DEC | 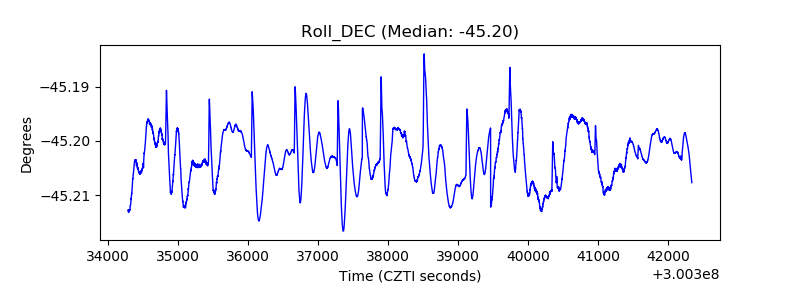 |
| _Roll_RA | 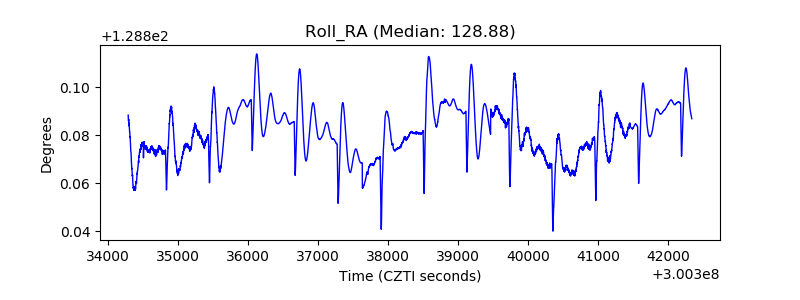 |
| Veto Counter |  |