| Param | Original file | Final file |
|---|---|---|
| Filename | modeM0/AS1A05_188T01_9000003018_20427cztM0_level2.evt | modeM0/AS1A05_188T01_9000003018_20427cztM0_level2_quad_clean.evt |
| Size (bytes) | 464,791,680 | 96,828,480 |
| Size | 443.3 MB | 92.3 MB |
| Events in quadrant A | 3,305,703 | 623,993 |
| Events in quadrant B | 3,385,718 | 628,651 |
| Events in quadrant C | 3,313,158 | 604,016 |
| Events in quadrant D | 3,602,036 | 594,608 |
| Mode SS | |||
|---|---|---|---|
| Quadrant | BADHDUFLAG | Total packets | Discarded packets |
| A | 0 | 140 | 0 |
| B | 0 | 140 | 0 |
| C | 0 | 140 | 0 |
| D | 0 | 140 | 0 |
| Mode M9 | |||
|---|---|---|---|
| Quadrant | BADHDUFLAG | Total packets | Discarded packets |
| A | 0 | 3 | 0 |
| B | 0 | 3 | 0 |
| C | 0 | 3 | 0 |
| D | 0 | 3 | 0 |
| Mode M0 | |||
|---|---|---|---|
| Quadrant | BADHDUFLAG | Total packets | Discarded packets |
| A | 0 | 14239 | 1 |
| B | 0 | 14346 | 1 |
| C | 0 | 14192 | 1 |
| D | 0 | 15265 | 1 |
| Quadrant | Total seconds | Saturated seconds | Saturation percentage |
|---|---|---|---|
| A | 6905 | 176 | 2.548878% |
| B | 6906 | 171 | 2.476108% |
| C | 6906 | 220 | 3.185636% |
| D | 6906 | 194 | 2.809151% |
Noise dominated data is calculated using 1-second bins in cleaned event files. If a bin has >2000 counts, and if more than 50% of those come from <1% of pixels, then it is considered to be noise-dominated and hence unusable.
| Quadrant | # 1 sec bins | Bins with >0 counts | Bins with >2000 counts | High rate bins dominated by noise | Noise dominated (total time) | Noise dominated (detector-on time) | Marked lightcurve |
|---|---|---|---|---|---|---|---|
| A | 7230 | 6905 | 2 | 2 | 0.03% | 0.03% | 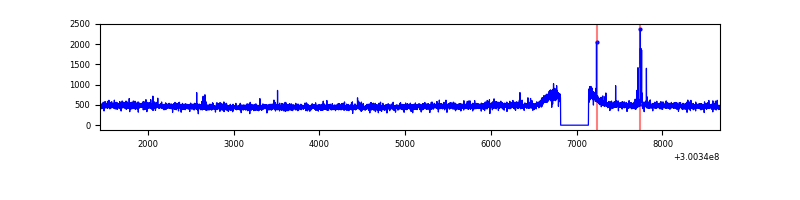 |
| B | 7231 | 6906 | 1 | 1 | 0.01% | 0.01% | 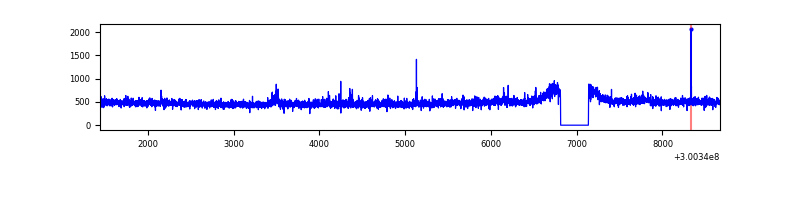 |
| C | 7231 | 6906 | 0 | 0 | 0.00% | 0.00% | 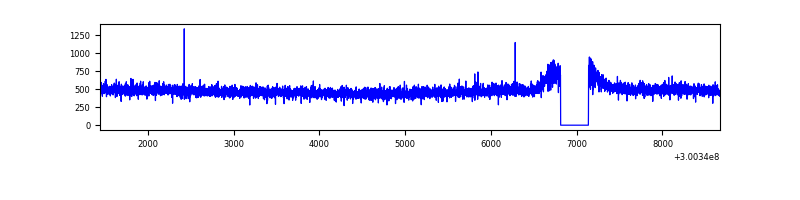 |
| D | 7231 | 6906 | 31 | 31 | 0.43% | 0.45% | 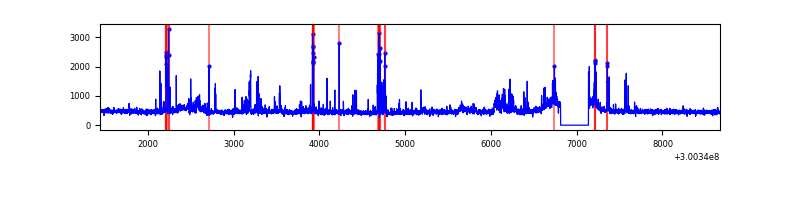 |
Top three noisy pixels from each quadrant. If the there are fewer than three noisy pixels in the level2.evt file, extra rows are filled as -1
| Pixel properties | Quadrant properties | ||||||
|---|---|---|---|---|---|---|---|
| Quadrant | DetID | PixID | Counts | Sigma | Mean | Median | Sigma |
| A | 5 | 16 | 25580 | 144.4 | 851 | 832 | 171.4 |
| A | 0 | 226 | 7432 | 38.51 | 851 | 832 | 171.4 |
| A | 3 | 137 | 7167 | 36.96 | 851 | 832 | 171.4 |
| B | 10 | 245 | 24325 | 145.3 | 842 | 820 | 161.8 |
| B | 0 | 219 | 23160 | 138.1 | 842 | 820 | 161.8 |
| B | 12 | 111 | 20105 | 119.21 | 842 | 820 | 161.8 |
| C | 14 | 238 | 127337 | 668.09 | 816 | 823 | 189.4 |
| C | 13 | 61 | 5625 | 25.36 | 816 | 823 | 189.4 |
| C | 5 | 4 | 2529 | 9.01 | 816 | 823 | 189.4 |
| D | 13 | 153 | 223263 | 1111.81 | 828 | 802 | 200.1 |
| D | 1 | 52 | 205189 | 1021.48 | 828 | 802 | 200.1 |
| D | 2 | 165 | 36360 | 177.71 | 828 | 802 | 200.1 |
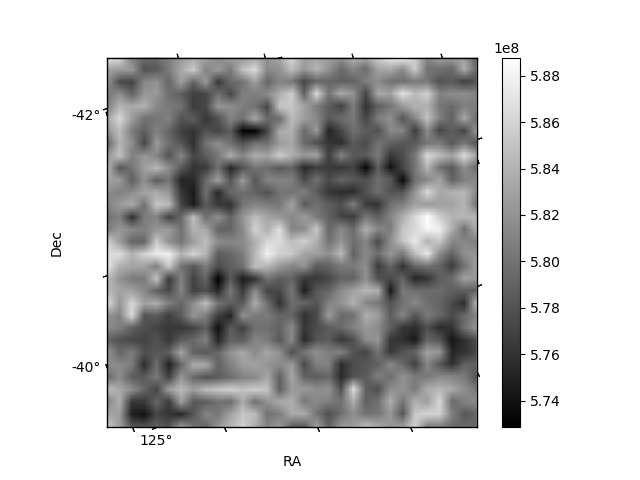
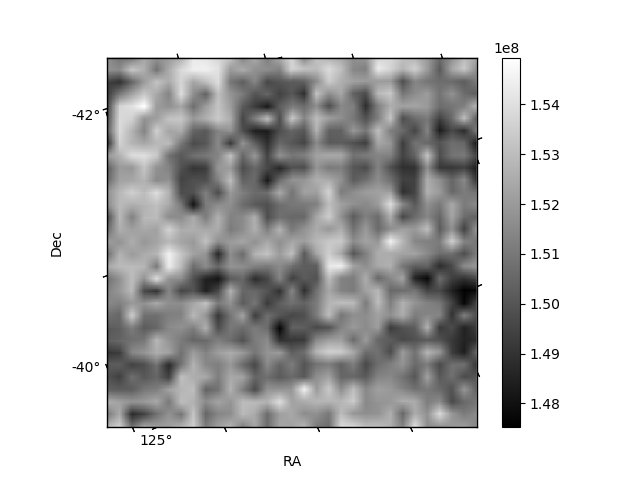
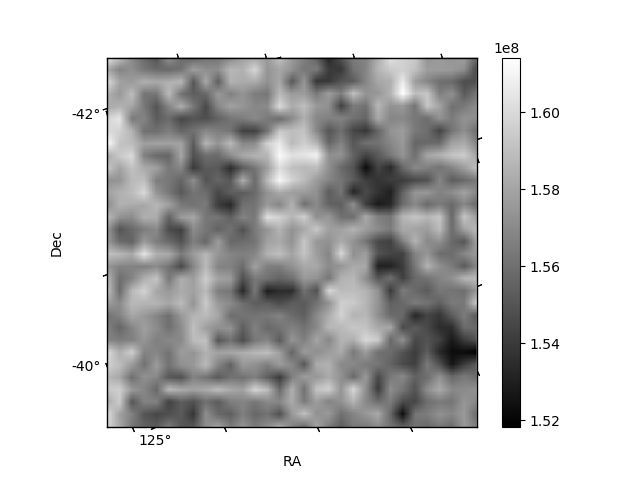
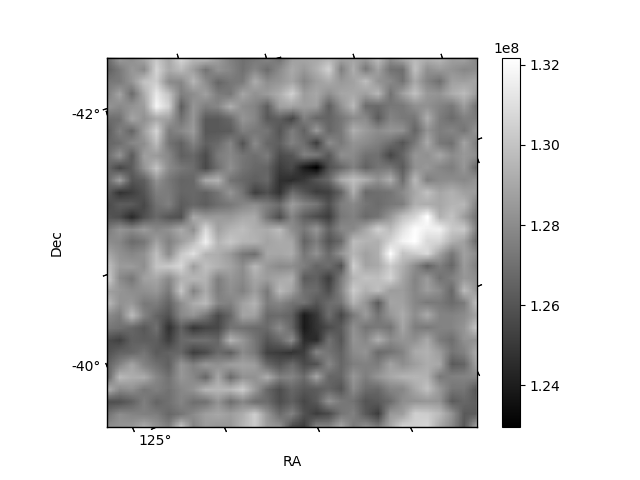
Histogram calculated using DETX and DETY for each event in the final _common_clean file
| Quadrant A | 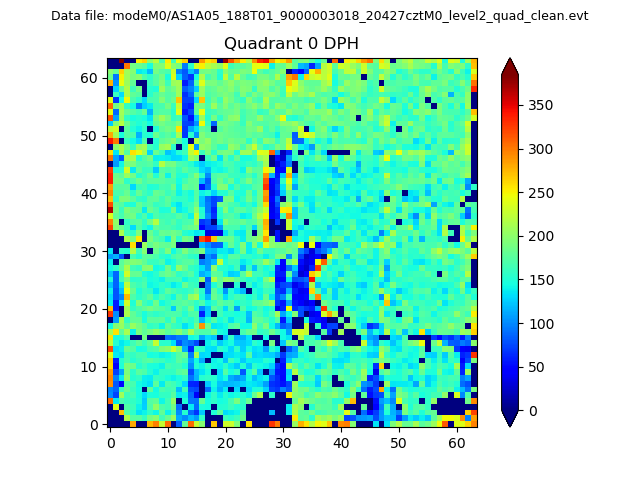 |
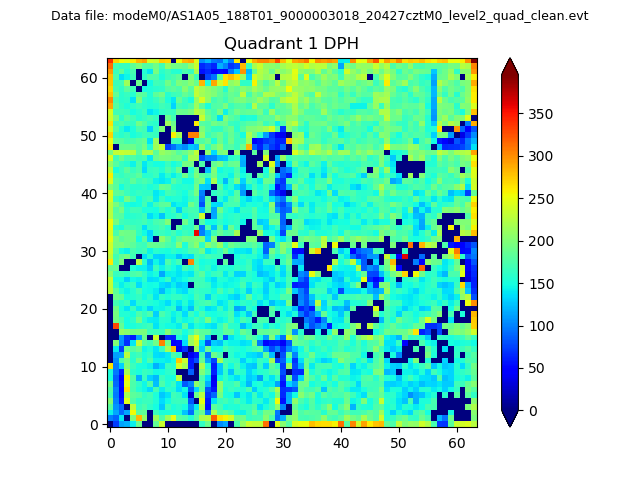 |
Quadrant B |
|---|---|---|---|
| Quadrant D |  |
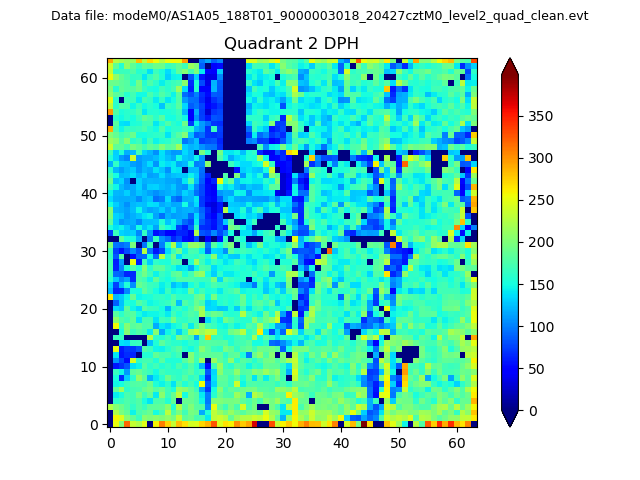 |
Quadrant C |
| Plot type | Count rate plots | Images |
|---|---|---|
| Comparison with Poisson distribution Blue bars denote a histogram of data divided into 1 sec bins. Red curve is a Poisson curve with rate = median count rate of data. |
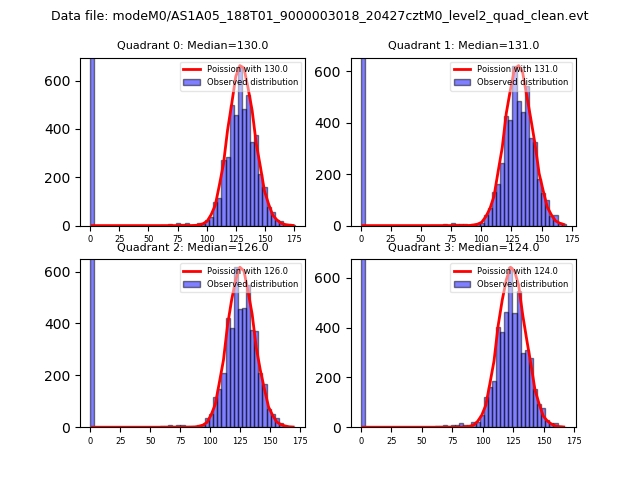 |
 |
| Quadrant-wise count rates Data is divided into 100 sec bins |
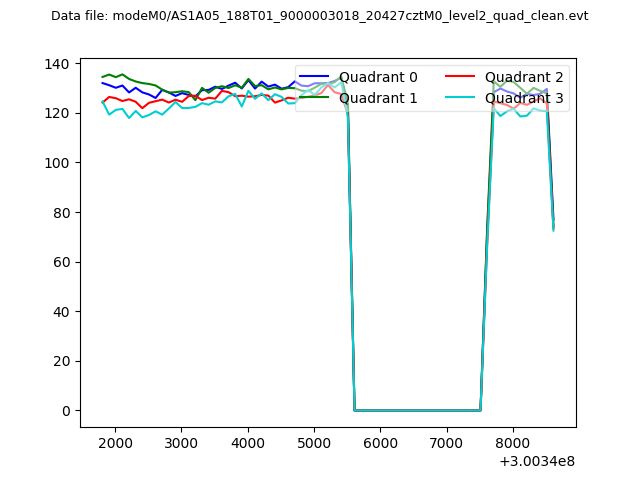 |
|
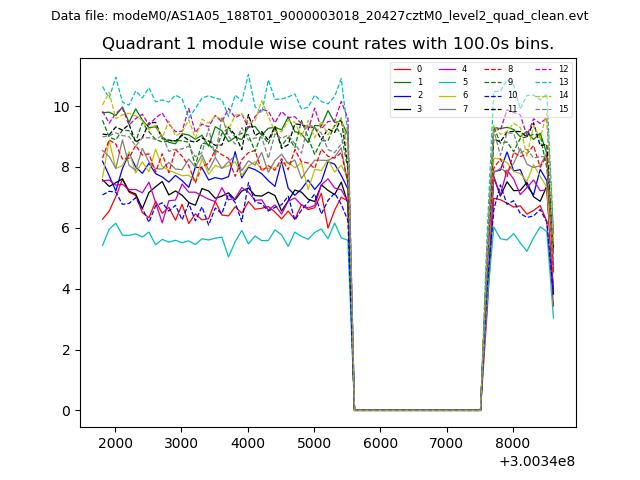
| Module-wise count rates for Quadrant A Data is divided into 100 sec bins |
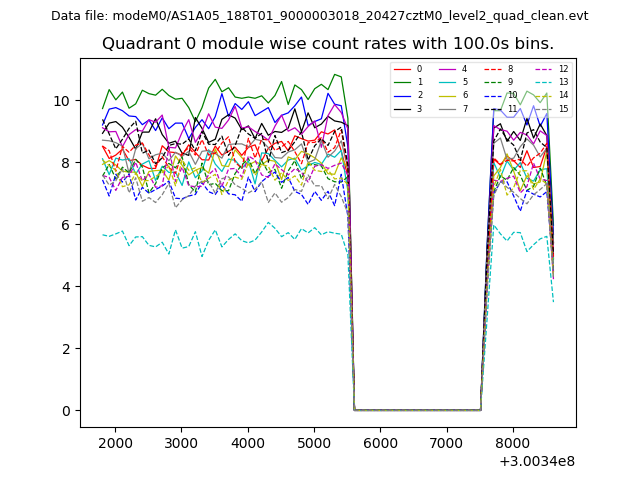 |
 |
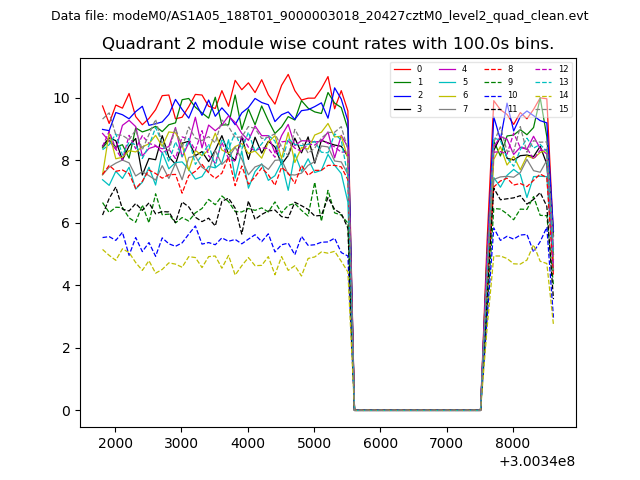
| Module-wise count rates for Quadrant B Data is divided into 100 sec bins |
 |
 |
| Module-wise count rates for Quadrant C Data is divided into 100 sec bins |
 |
 |
| Module-wise count rates for Quadrant D Data is divided into 100 sec bins |
 |
 |
| Parameter | Plot |
|---|---|
| CZT HV Monitor | 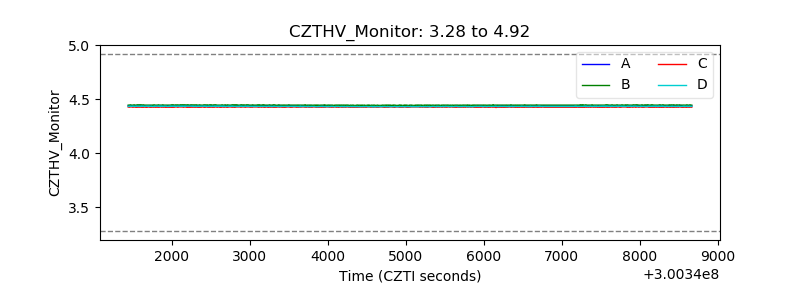 |
| D_VDD | 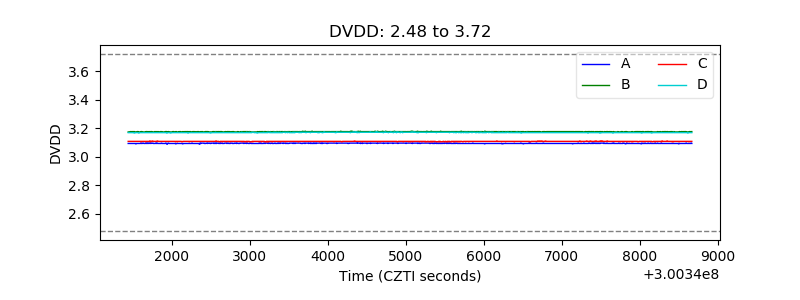 |
| Temperature 1 | 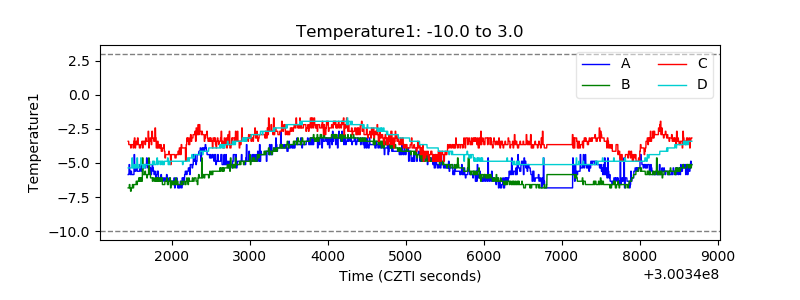 |
| Veto HV Monitor | 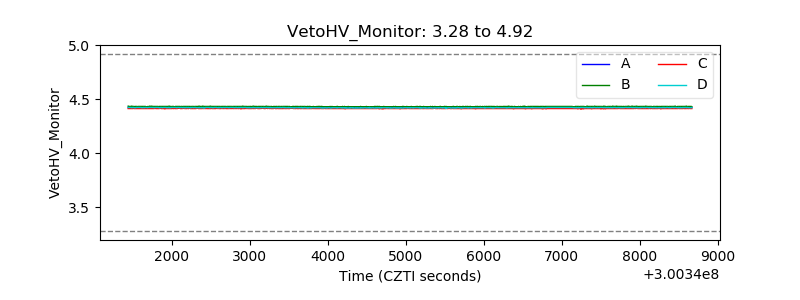 |
| Veto LLD | 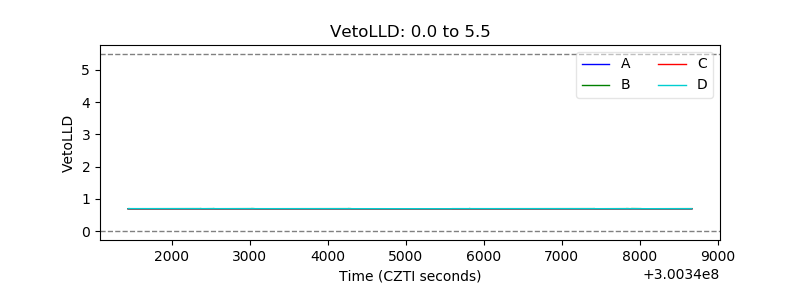 |
| Alpha Counter | 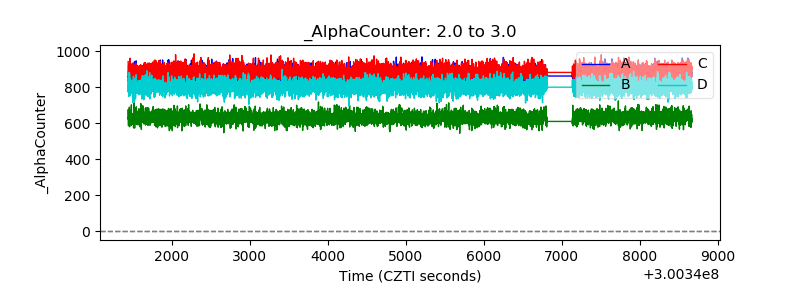 |
| _CPM_Rate | 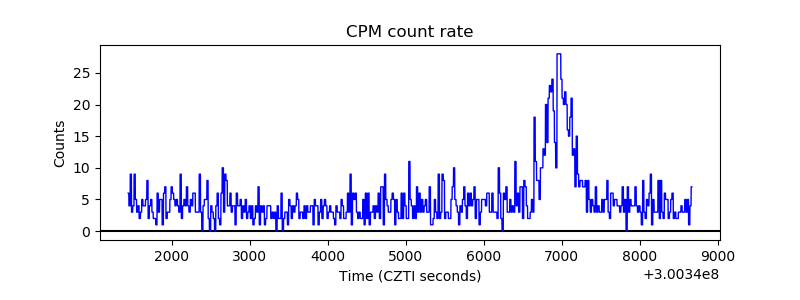 |
| CZT Counter | 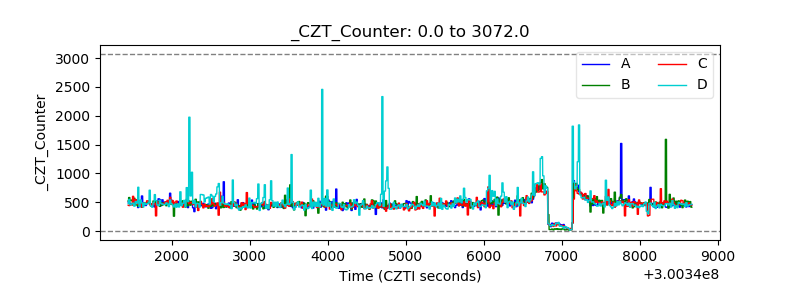 |
| +2.5 Volts monitor | 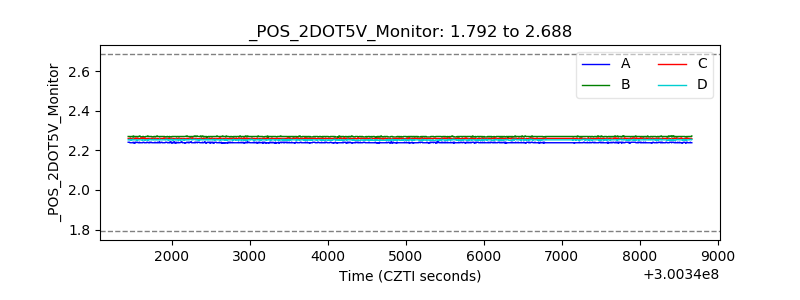 |
| +5 Volts monitor | 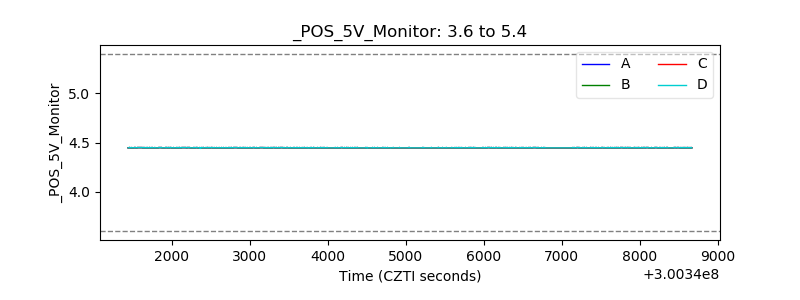 |
| _ROLL_ROT | 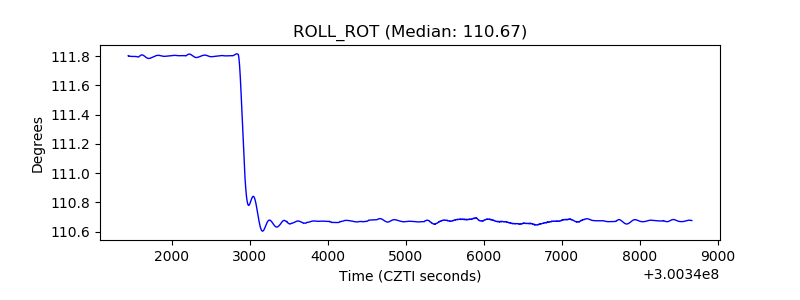 |
| _Roll_DEC | 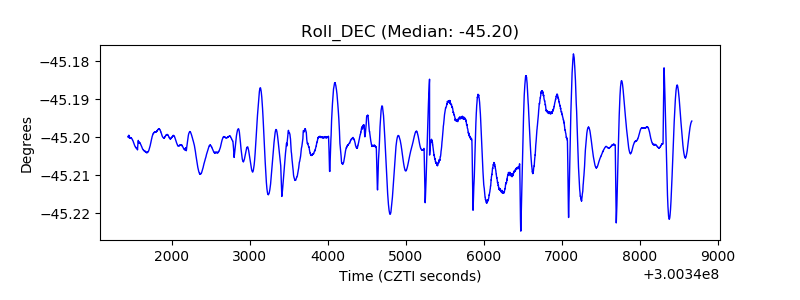 |
| _Roll_RA | 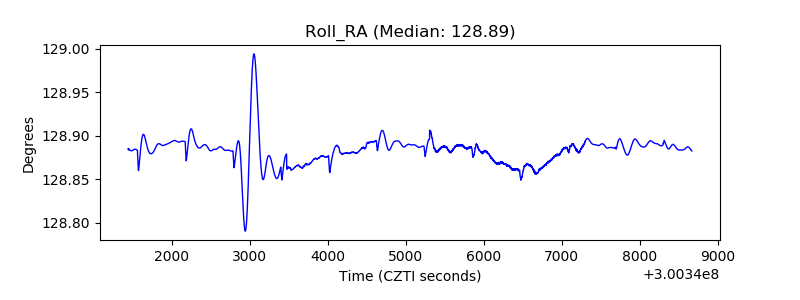 |
| Veto Counter | 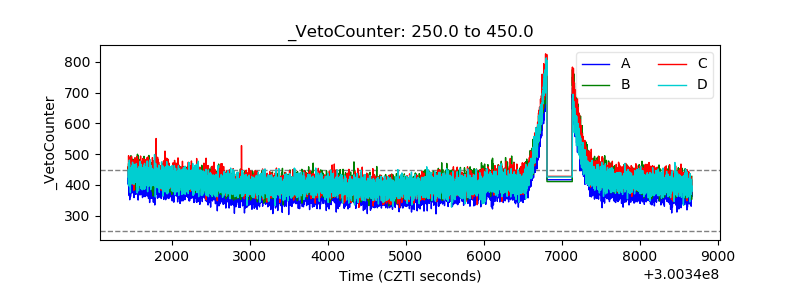 |