| Param | Original file | Final file |
|---|---|---|
| Filename | modeM0/AS1A05_188T01_9000003018_20428cztM0_level2.evt | modeM0/AS1A05_188T01_9000003018_20428cztM0_level2_quad_clean.evt |
| Size (bytes) | 534,044,160 | 104,952,960 |
| Size | 509.3 MB | 100.1 MB |
| Events in quadrant A | 3,673,260 | 673,914 |
| Events in quadrant B | 3,896,700 | 677,835 |
| Events in quadrant C | 3,699,741 | 653,313 |
| Events in quadrant D | 4,382,894 | 639,934 |
| Mode SS | |||
|---|---|---|---|
| Quadrant | BADHDUFLAG | Total packets | Discarded packets |
| A | 0 | 156 | 0 |
| B | 0 | 156 | 0 |
| C | 0 | 156 | 0 |
| D | 0 | 156 | 0 |
| Mode M9 | |||
|---|---|---|---|
| Quadrant | BADHDUFLAG | Total packets | Discarded packets |
| A | 0 | 1 | 0 |
| B | 0 | 1 | 0 |
| C | 0 | 1 | 0 |
| D | 0 | 1 | 0 |
| Mode M0 | |||
|---|---|---|---|
| Quadrant | BADHDUFLAG | Total packets | Discarded packets |
| A | 0 | 15859 | 1 |
| B | 0 | 16368 | 1 |
| C | 0 | 15859 | 1 |
| D | 0 | 17938 | 1 |
| Quadrant | Total seconds | Saturated seconds | Saturation percentage |
|---|---|---|---|
| A | 7670 | 192 | 2.503259% |
| B | 7671 | 205 | 2.672403% |
| C | 7671 | 230 | 2.998305% |
| D | 7670 | 230 | 2.998696% |
Noise dominated data is calculated using 1-second bins in cleaned event files. If a bin has >2000 counts, and if more than 50% of those come from <1% of pixels, then it is considered to be noise-dominated and hence unusable.
| Quadrant | # 1 sec bins | Bins with >0 counts | Bins with >2000 counts | High rate bins dominated by noise | Noise dominated (total time) | Noise dominated (detector-on time) | Marked lightcurve |
|---|---|---|---|---|---|---|---|
| A | 7720 | 7671 | 1 | 1 | 0.01% | 0.01% | 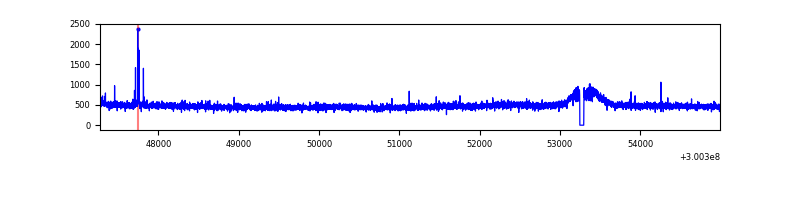 |
| B | 7721 | 7672 | 1 | 1 | 0.01% | 0.01% | 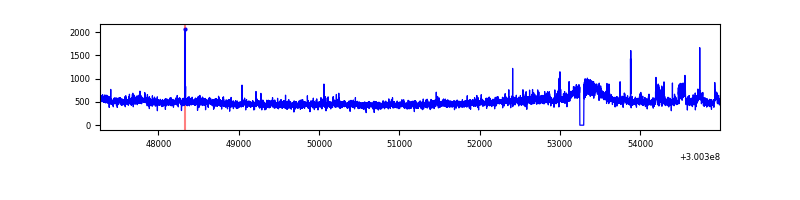 |
| C | 7721 | 7672 | 0 | 0 | 0.00% | 0.00% | 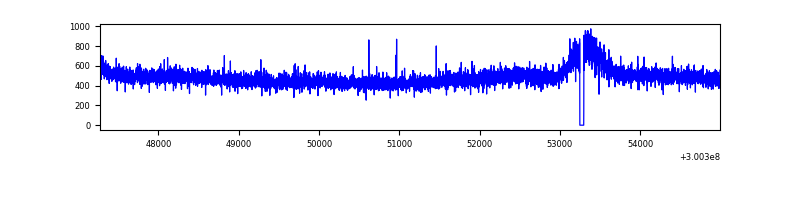 |
| D | 7720 | 7671 | 59 | 59 | 0.76% | 0.77% | 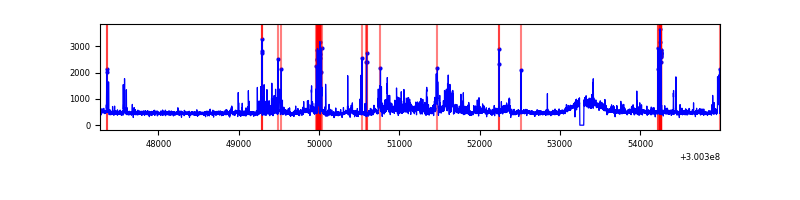 |
Top three noisy pixels from each quadrant. If the there are fewer than three noisy pixels in the level2.evt file, extra rows are filled as -1
| Pixel properties | Quadrant properties | ||||||
|---|---|---|---|---|---|---|---|
| Quadrant | DetID | PixID | Counts | Sigma | Mean | Median | Sigma |
| A | 5 | 16 | 26392 | 133.51 | 947 | 926 | 190.7 |
| A | 0 | 226 | 8086 | 37.54 | 947 | 926 | 190.7 |
| A | 3 | 137 | 8007 | 37.12 | 947 | 926 | 190.7 |
| B | 10 | 245 | 148288 | 817.7 | 937 | 913 | 180.2 |
| B | 12 | 111 | 22779 | 121.32 | 937 | 913 | 180.2 |
| B | 0 | 219 | 22524 | 119.91 | 937 | 913 | 180.2 |
| C | 14 | 238 | 140474 | 654.91 | 910 | 915 | 213.1 |
| C | 13 | 61 | 6287 | 25.21 | 910 | 915 | 213.1 |
| C | 8 | 128 | 5062 | 19.46 | 910 | 915 | 213.1 |
| D | 1 | 52 | 396316 | 1752.23 | 924 | 896 | 225.7 |
| D | 13 | 153 | 280513 | 1239.07 | 924 | 896 | 225.7 |
| D | 2 | 16 | 135950 | 598.47 | 924 | 896 | 225.7 |
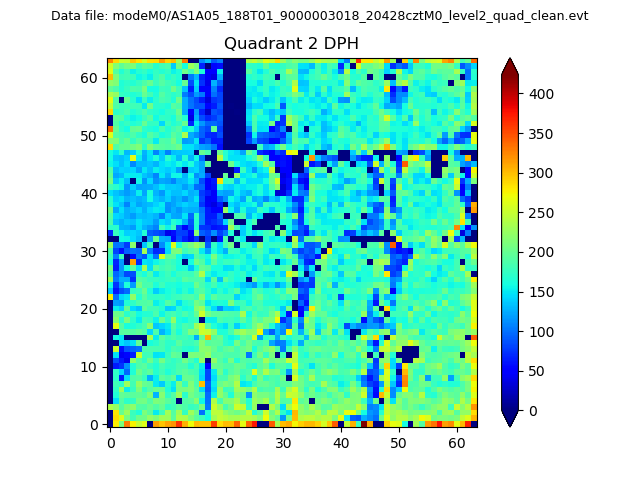
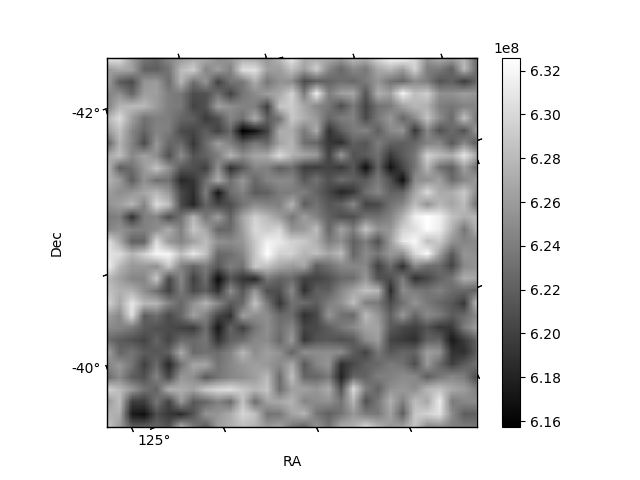
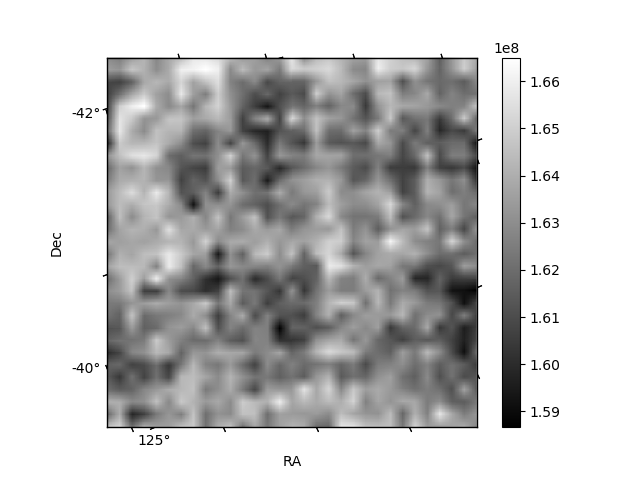
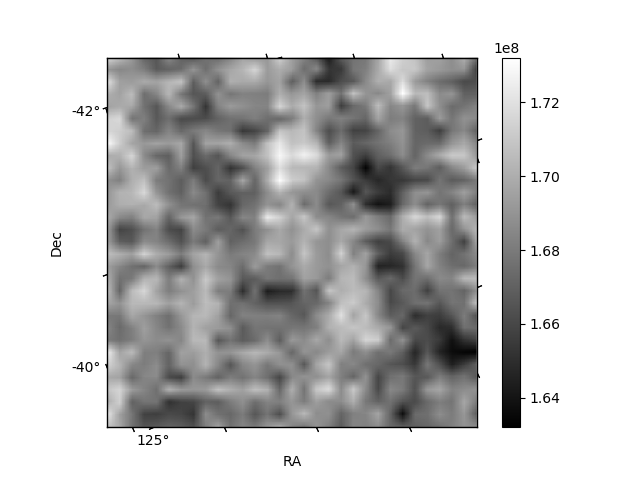
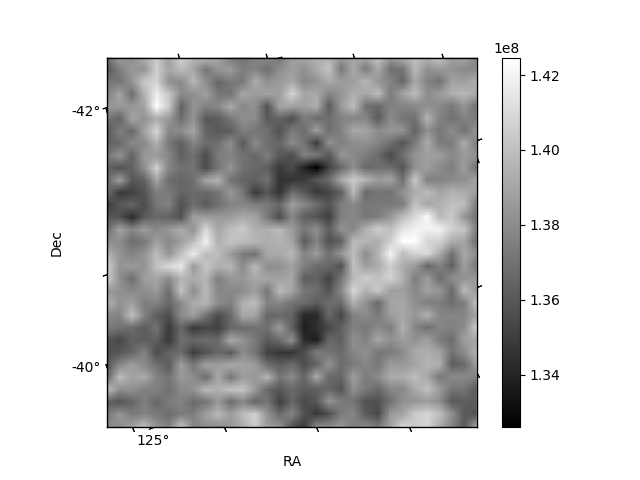
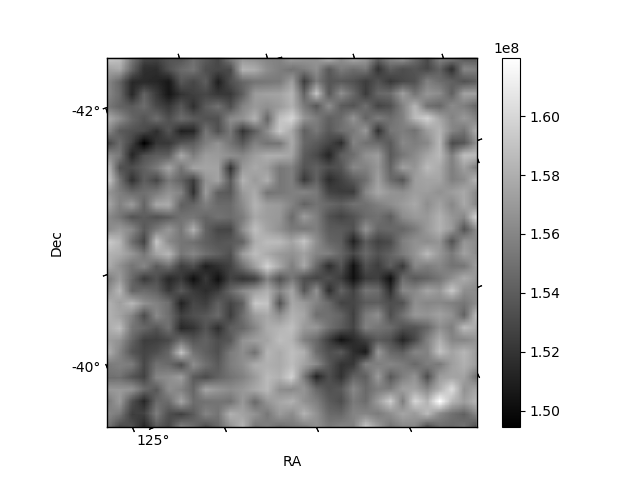
Histogram calculated using DETX and DETY for each event in the final _common_clean file
| Quadrant A | 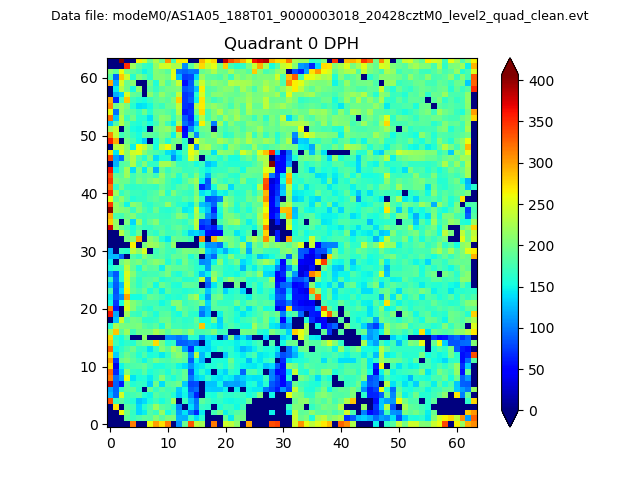 |
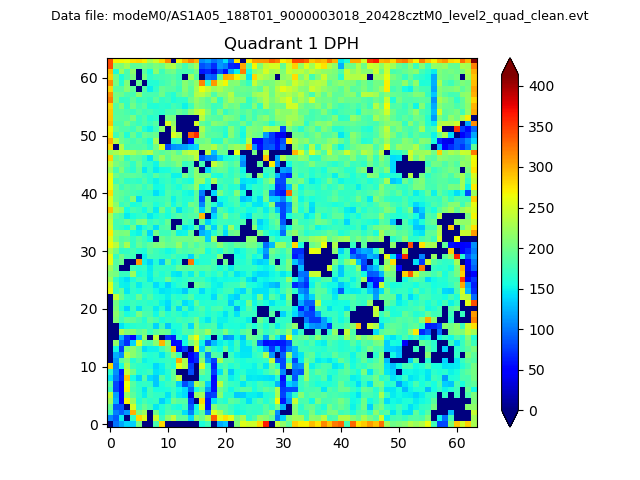 |
Quadrant B |
|---|---|---|---|
| Quadrant D | 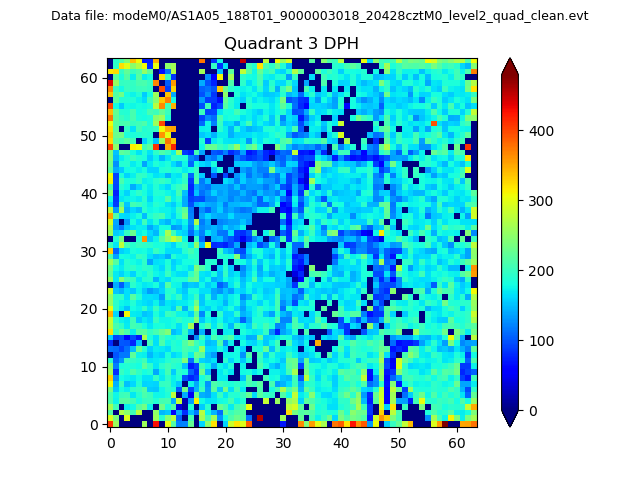 |
 |
Quadrant C |
| Plot type | Count rate plots | Images |
|---|---|---|
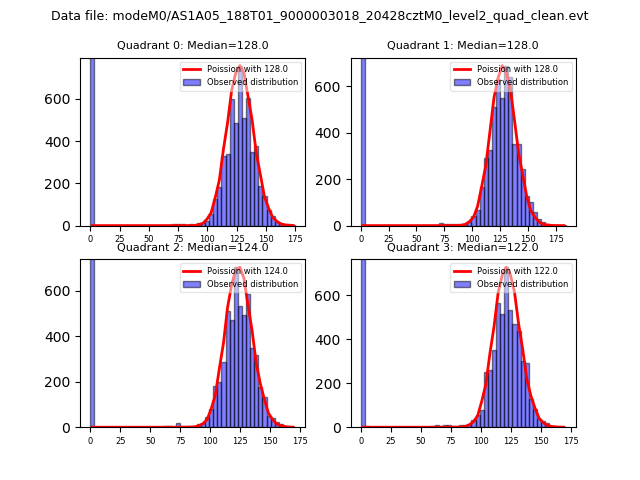
| Comparison with Poisson distribution Blue bars denote a histogram of data divided into 1 sec bins. Red curve is a Poisson curve with rate = median count rate of data. |
 |
 |
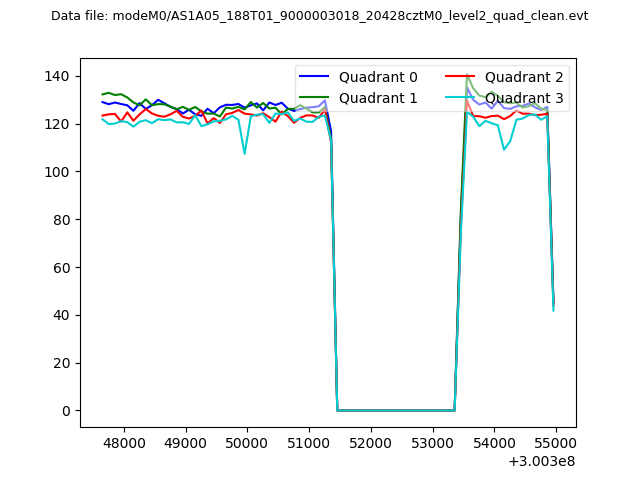
| Quadrant-wise count rates Data is divided into 100 sec bins |
 |
|
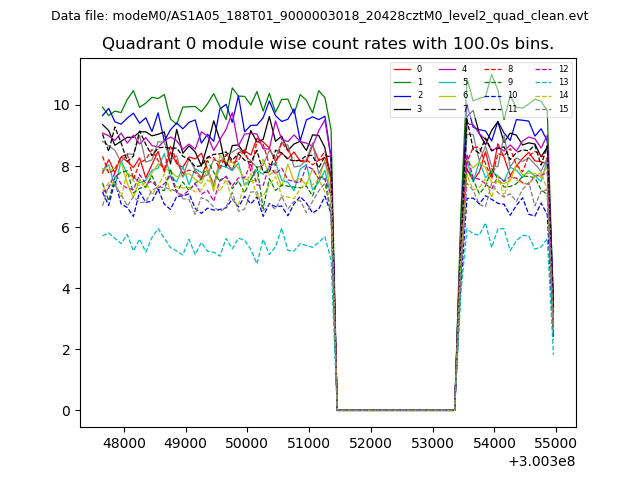
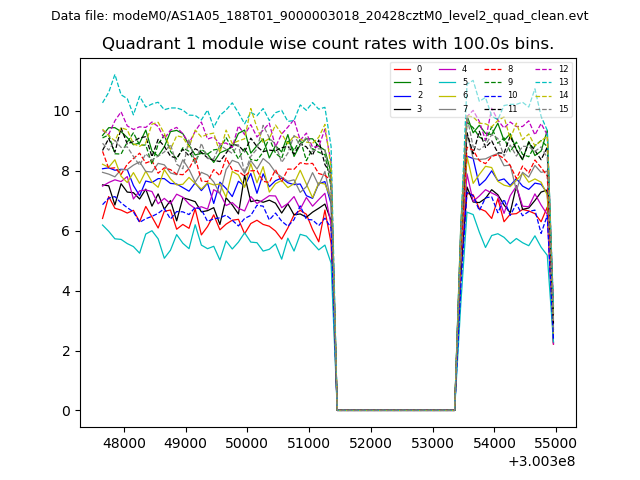
| Module-wise count rates for Quadrant A Data is divided into 100 sec bins |
 |
 |
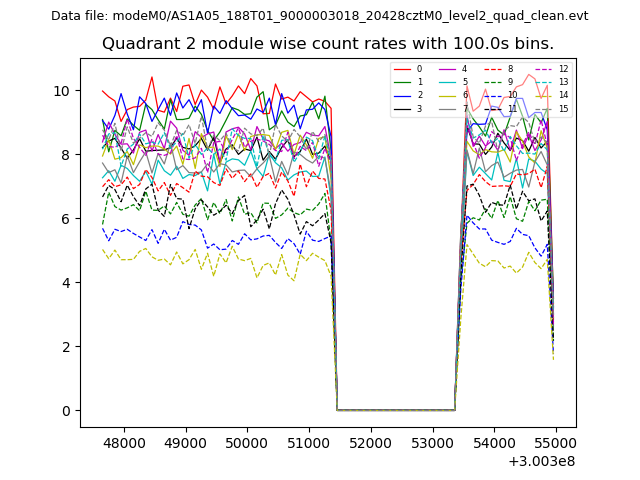
| Module-wise count rates for Quadrant B Data is divided into 100 sec bins |
 |
 |
| Module-wise count rates for Quadrant C Data is divided into 100 sec bins |
 |
 |
| Module-wise count rates for Quadrant D Data is divided into 100 sec bins |
 |
 |
| Parameter | Plot |
|---|---|
| CZT HV Monitor | 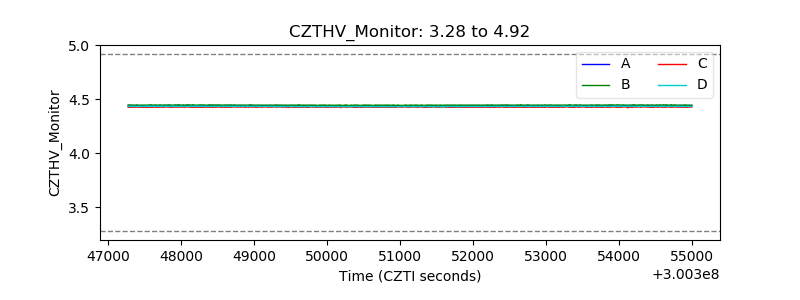 |
| D_VDD | 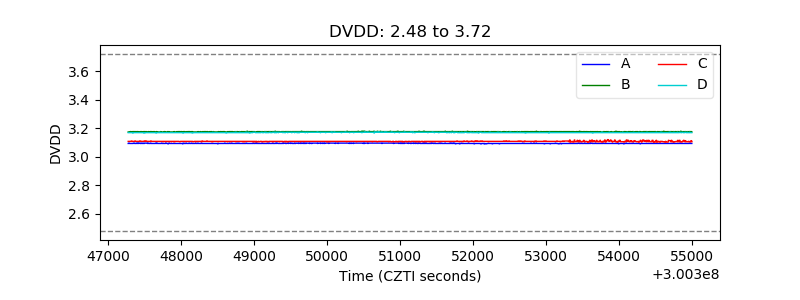 |
| Temperature 1 | 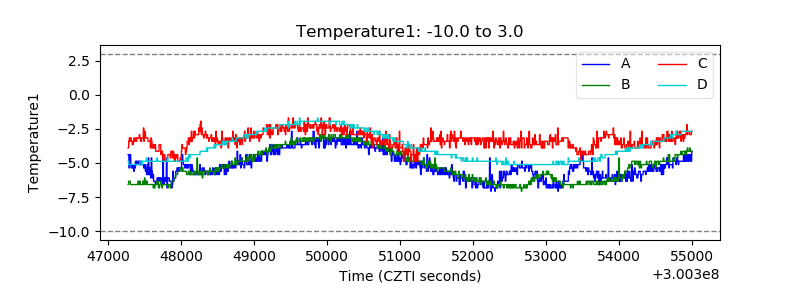 |
| Veto HV Monitor | 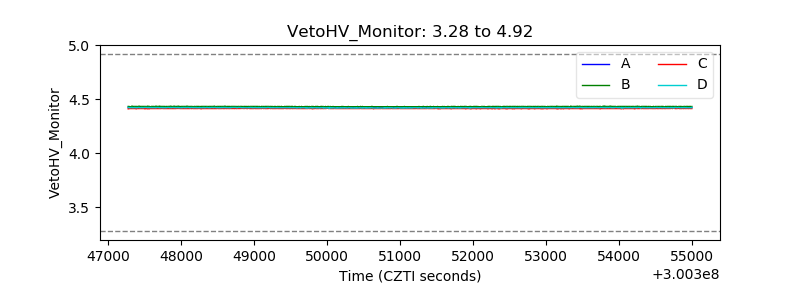 |
| Veto LLD | 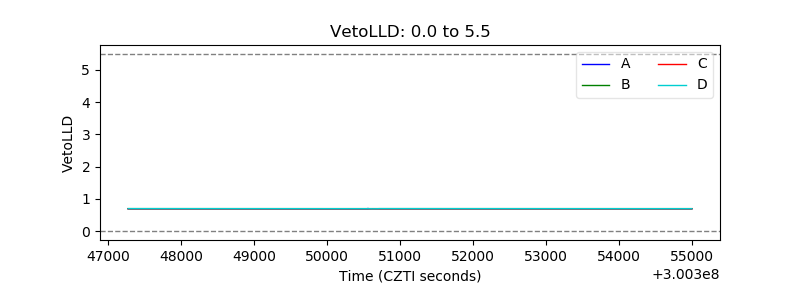 |
| Alpha Counter | 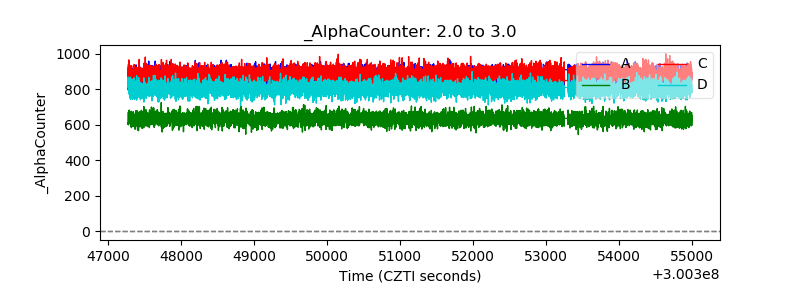 |
| _CPM_Rate | 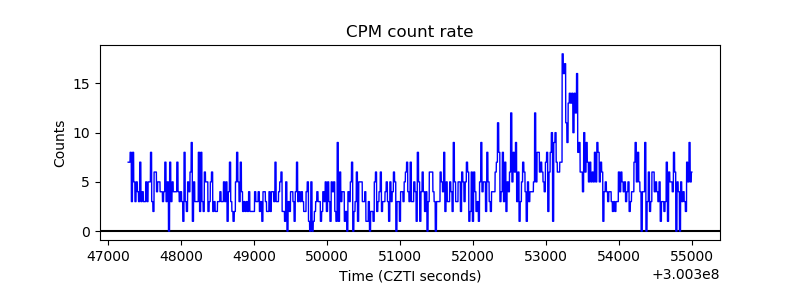 |
| CZT Counter | 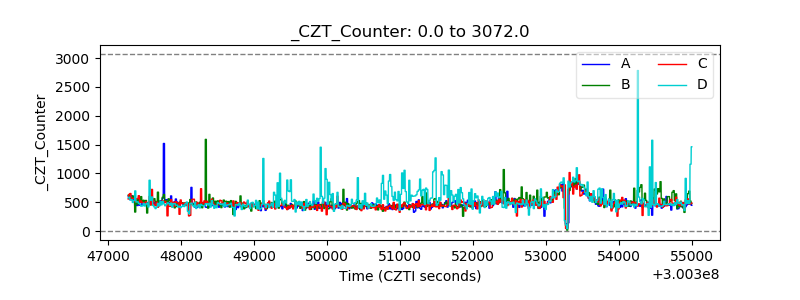 |
| +2.5 Volts monitor |  |
| +5 Volts monitor |  |
| _ROLL_ROT | 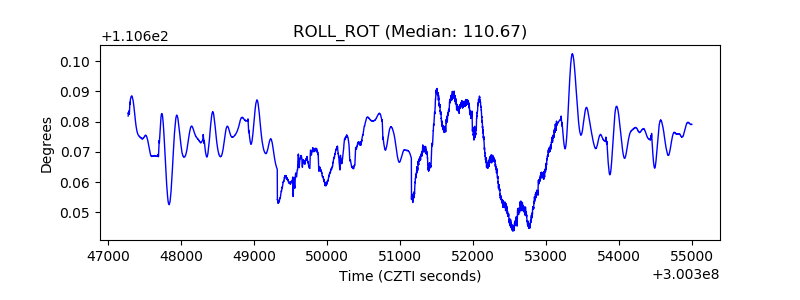 |
| _Roll_DEC | 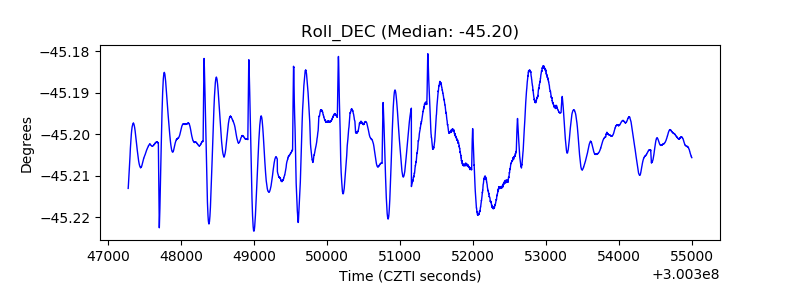 |
| _Roll_RA | 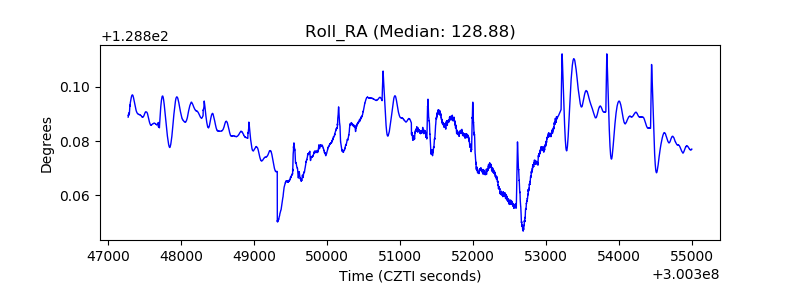 |
| Veto Counter | 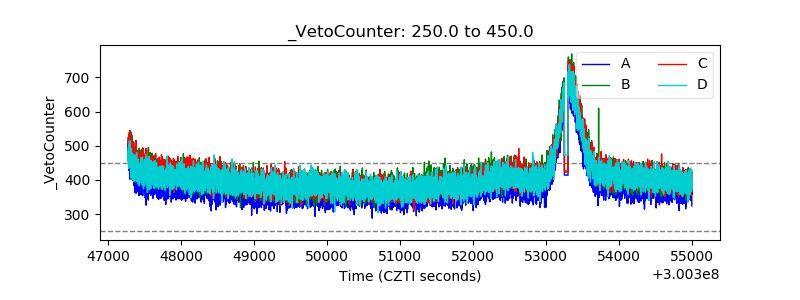 |