| Param | Original file | Final file |
|---|---|---|
| Filename | modeM0/AS1A05_188T01_9000003018_20431cztM0_level2.evt | modeM0/AS1A05_188T01_9000003018_20431cztM0_level2_quad_clean.evt |
| Size (bytes) | 879,298,560 | 167,045,760 |
| Size | 838.6 MB | 159.3 MB |
| Events in quadrant A | 5,811,346 | 1,073,032 |
| Events in quadrant B | 6,929,953 | 1,067,389 |
| Events in quadrant C | 5,826,761 | 1,035,622 |
| Events in quadrant D | 7,214,016 | 1,017,469 |
| Mode SS | |||
|---|---|---|---|
| Quadrant | BADHDUFLAG | Total packets | Discarded packets |
| A | 0 | 254 | 0 |
| B | 0 | 254 | 0 |
| C | 0 | 254 | 0 |
| D | 0 | 254 | 0 |
| Mode M9 | |||
|---|---|---|---|
| Quadrant | BADHDUFLAG | Total packets | Discarded packets |
| A | 0 | 11 | 0 |
| B | 0 | 11 | 0 |
| C | 0 | 11 | 0 |
| D | 0 | 11 | 0 |
| Mode M0 | |||
|---|---|---|---|
| Quadrant | BADHDUFLAG | Total packets | Discarded packets |
| A | 0 | 25448 | 2 |
| B | 0 | 28618 | 2 |
| C | 0 | 25552 | 2 |
| D | 0 | 29582 | 2 |
| Quadrant | Total seconds | Saturated seconds | Saturation percentage |
|---|---|---|---|
| A | 12520 | 103 | 0.822684% |
| B | 12521 | 197 | 1.573357% |
| C | 12521 | 121 | 0.966376% |
| D | 12521 | 363 | 2.899129% |
Noise dominated data is calculated using 1-second bins in cleaned event files. If a bin has >2000 counts, and if more than 50% of those come from <1% of pixels, then it is considered to be noise-dominated and hence unusable.
| Quadrant | # 1 sec bins | Bins with >0 counts | Bins with >2000 counts | High rate bins dominated by noise | Noise dominated (total time) | Noise dominated (detector-on time) | Marked lightcurve |
|---|---|---|---|---|---|---|---|
| A | 13645 | 12521 | 0 | 0 | 0.00% | 0.00% | 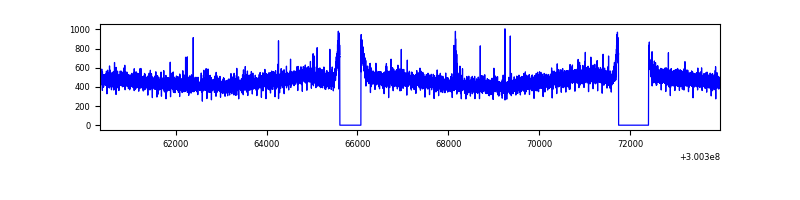 |
| B | 13646 | 12523 | 71 | 71 | 0.52% | 0.57% | 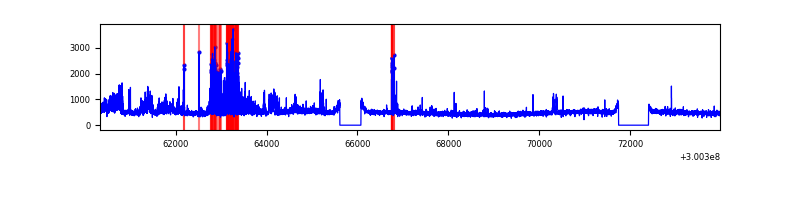 |
| C | 13646 | 12523 | 0 | 0 | 0.00% | 0.00% | 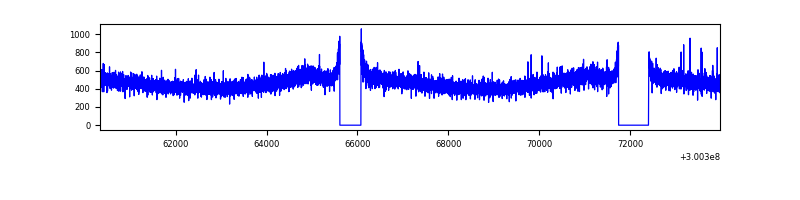 |
| D | 13646 | 12522 | 311 | 311 | 2.28% | 2.48% | 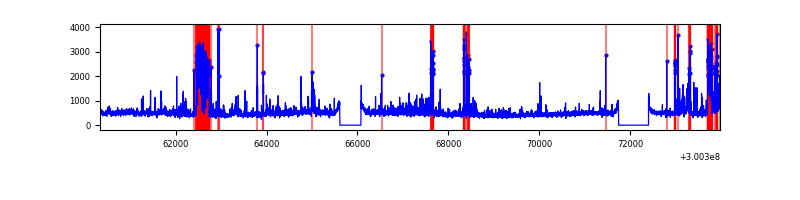 |
Top three noisy pixels from each quadrant. If the there are fewer than three noisy pixels in the level2.evt file, extra rows are filled as -1
| Pixel properties | Quadrant properties | ||||||
|---|---|---|---|---|---|---|---|
| Quadrant | DetID | PixID | Counts | Sigma | Mean | Median | Sigma |
| A | 0 | 226 | 13418 | 39.51 | 1506 | 1475 | 302.3 |
| A | 3 | 137 | 12750 | 37.3 | 1506 | 1475 | 302.3 |
| A | 12 | 194 | 11105 | 31.86 | 1506 | 1475 | 302.3 |
| B | 10 | 245 | 1001403 | 3520.37 | 1481 | 1441 | 284.1 |
| B | 12 | 111 | 35424 | 119.64 | 1481 | 1441 | 284.1 |
| B | 11 | 111 | 31624 | 106.26 | 1481 | 1441 | 284.1 |
| C | 14 | 238 | 225317 | 666.56 | 1432 | 1441 | 335.9 |
| C | 13 | 61 | 9927 | 25.27 | 1432 | 1441 | 335.9 |
| C | 3 | 233 | 9701 | 24.59 | 1432 | 1441 | 335.9 |
| D | 2 | 16 | 895464 | 2516.93 | 1460 | 1416 | 355.2 |
| D | 1 | 52 | 646215 | 1815.24 | 1460 | 1416 | 355.2 |
| D | 13 | 153 | 106475 | 295.76 | 1460 | 1416 | 355.2 |
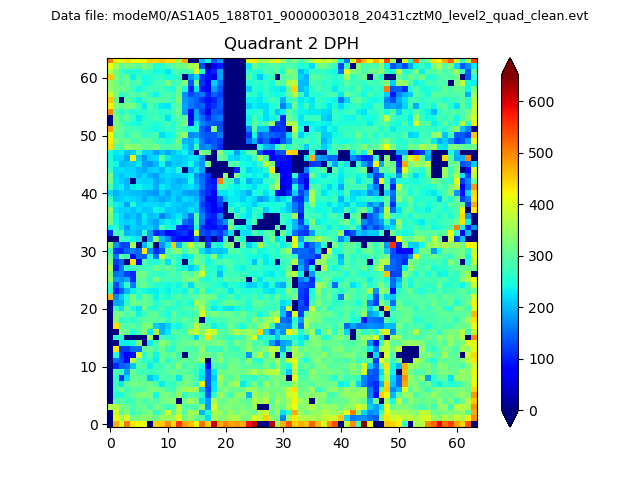
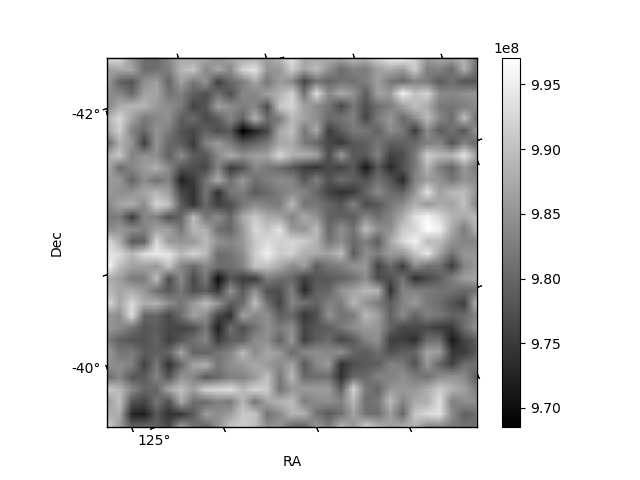
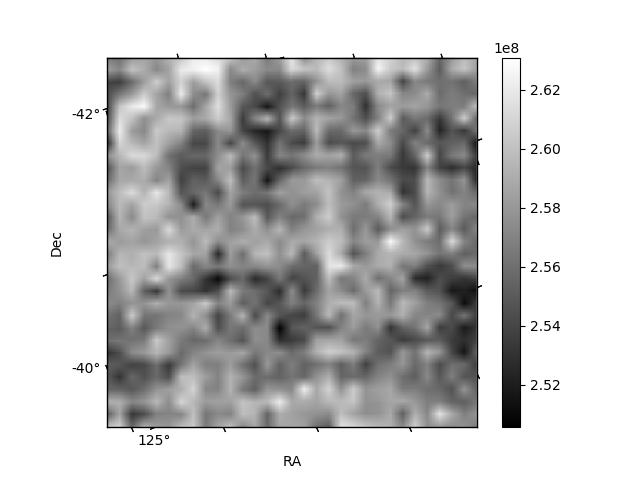
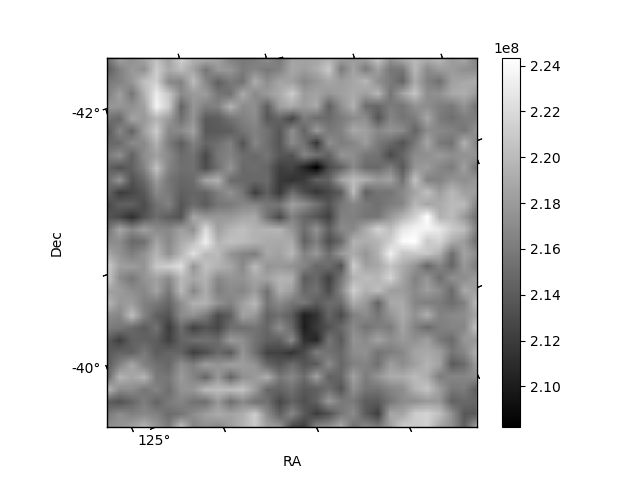
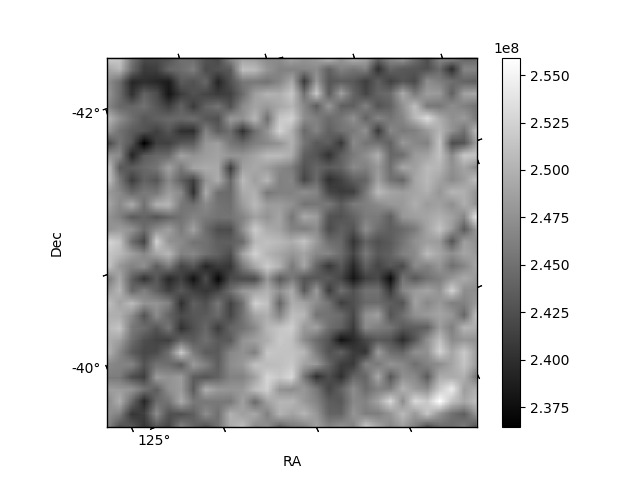
Histogram calculated using DETX and DETY for each event in the final _common_clean file
| Quadrant A | 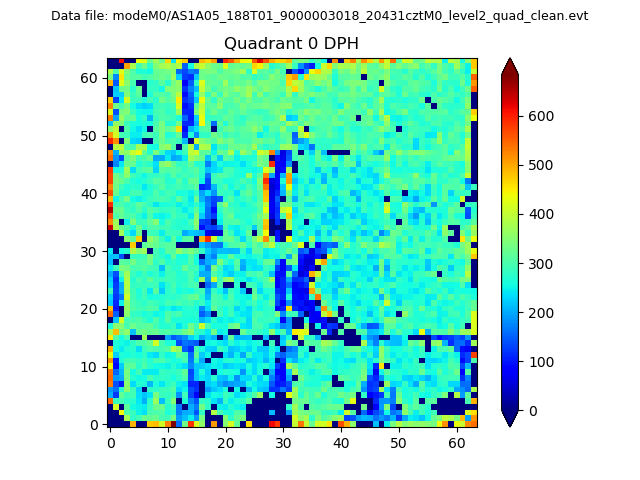 |
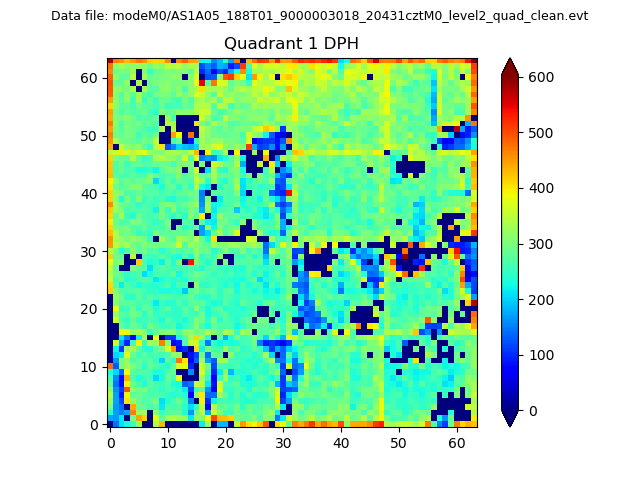 |
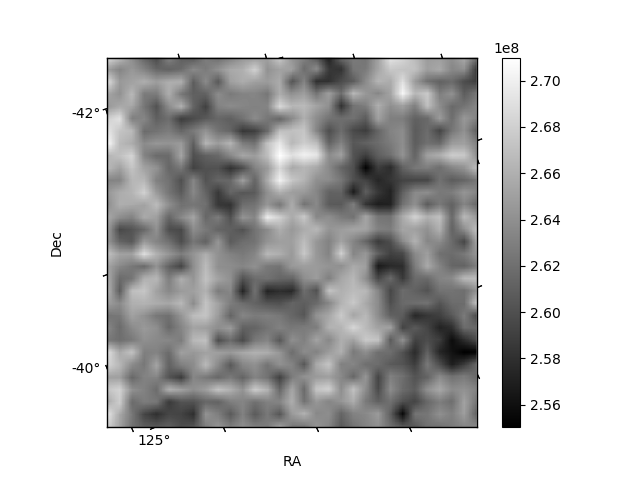
Quadrant B |
|---|---|---|---|
| Quadrant D | 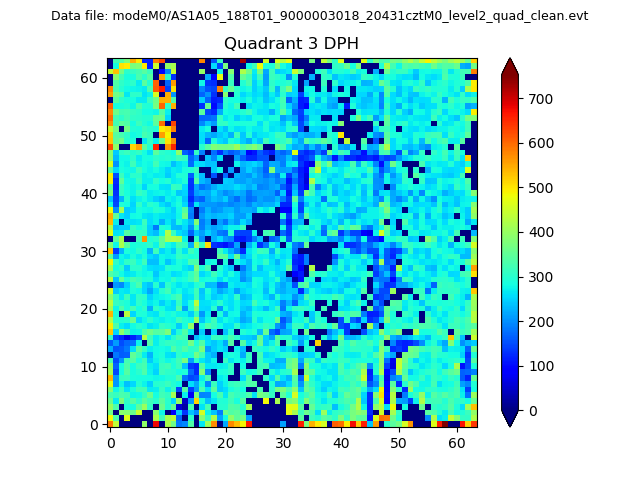 |
 |
Quadrant C |
| Plot type | Count rate plots | Images |
|---|---|---|
| Comparison with Poisson distribution Blue bars denote a histogram of data divided into 1 sec bins. Red curve is a Poisson curve with rate = median count rate of data. |
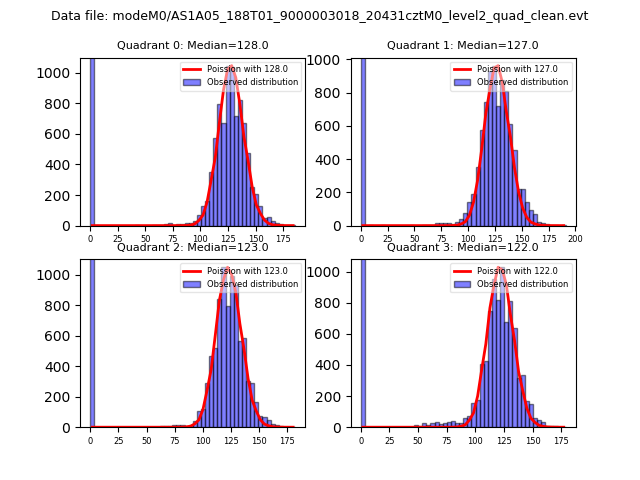 |
 |
| Quadrant-wise count rates Data is divided into 100 sec bins |
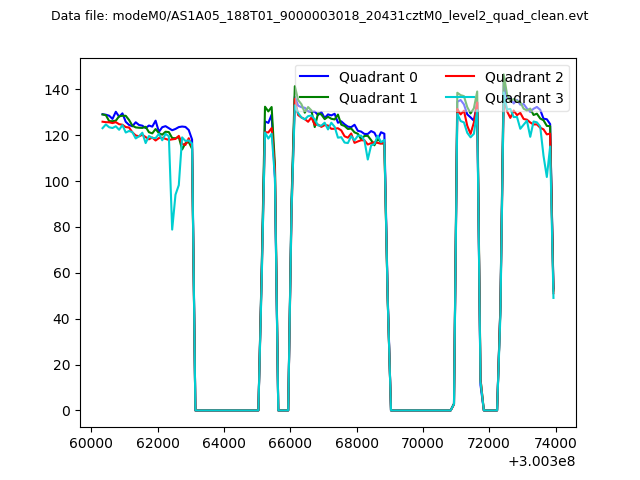 |
|
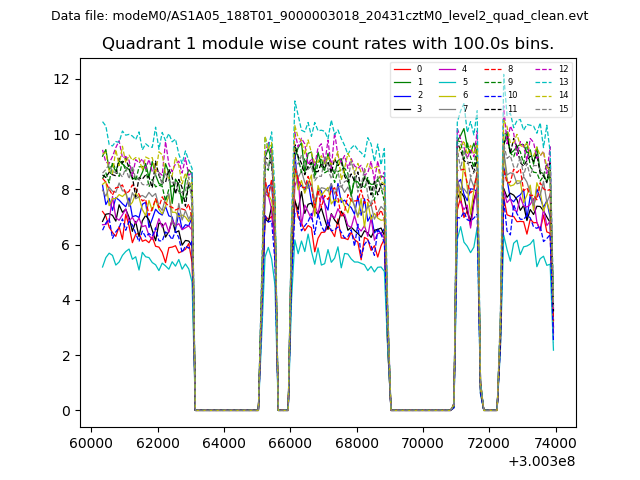
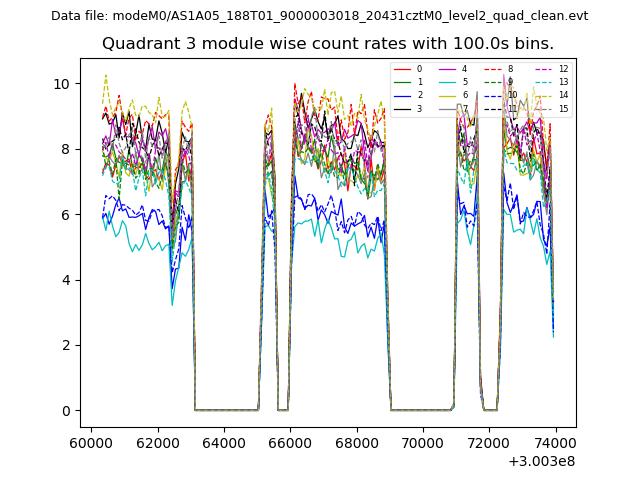
| Module-wise count rates for Quadrant A Data is divided into 100 sec bins |
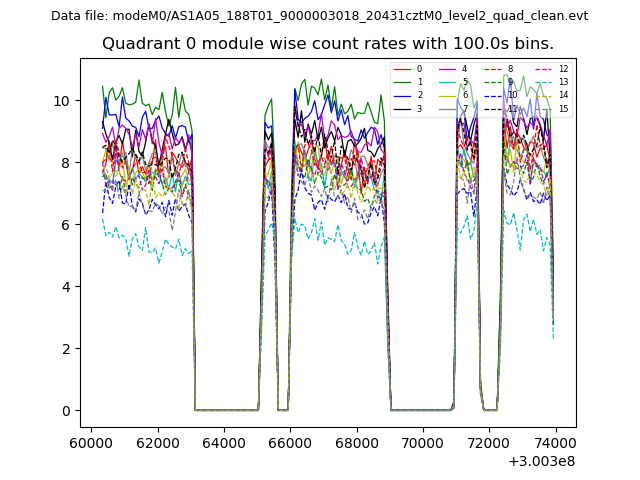 |
 |
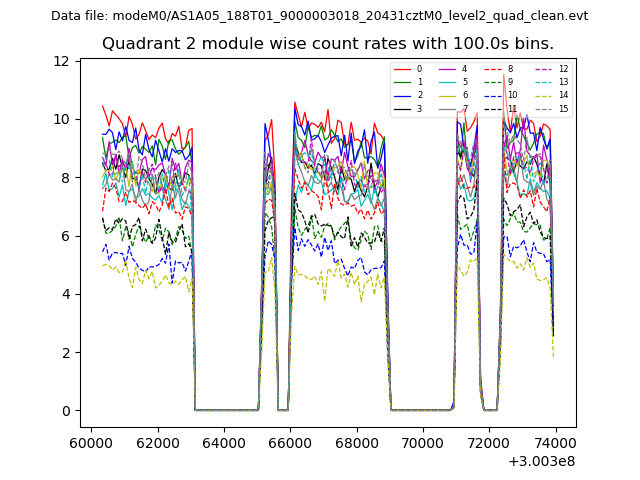
| Module-wise count rates for Quadrant B Data is divided into 100 sec bins |
 |
 |
| Module-wise count rates for Quadrant C Data is divided into 100 sec bins |
 |
 |
| Module-wise count rates for Quadrant D Data is divided into 100 sec bins |
 |
 |
| Parameter | Plot |
|---|---|
| CZT HV Monitor | 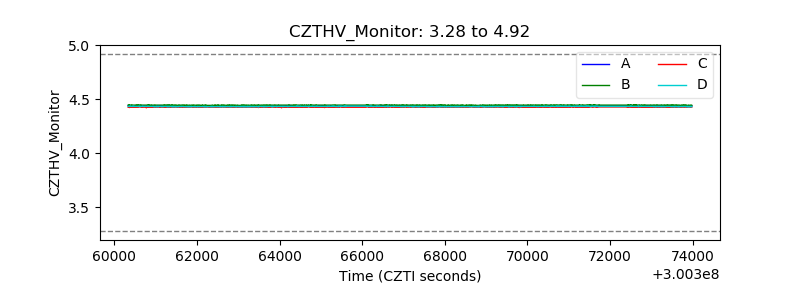 |
| D_VDD | 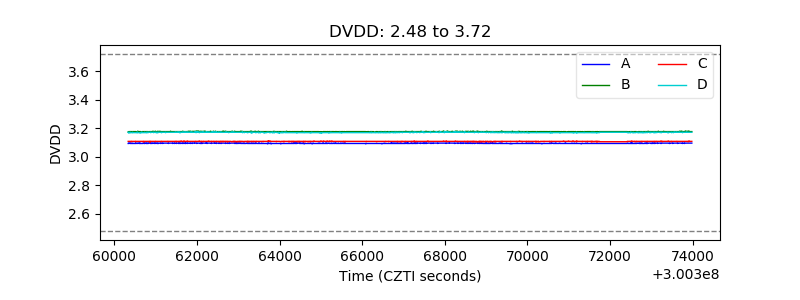 |
| Temperature 1 | 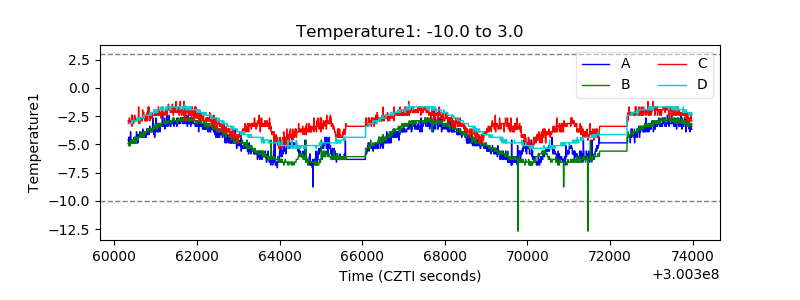 |
| Veto HV Monitor | 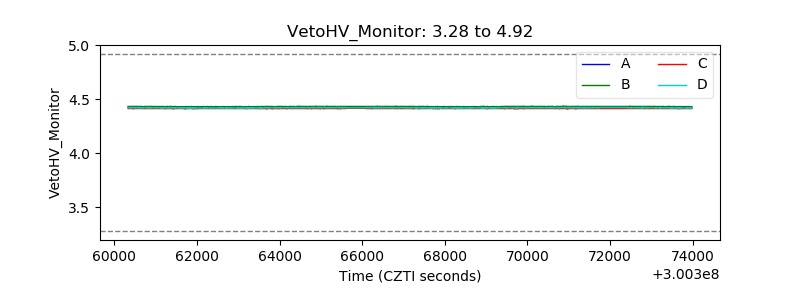 |
| Veto LLD | 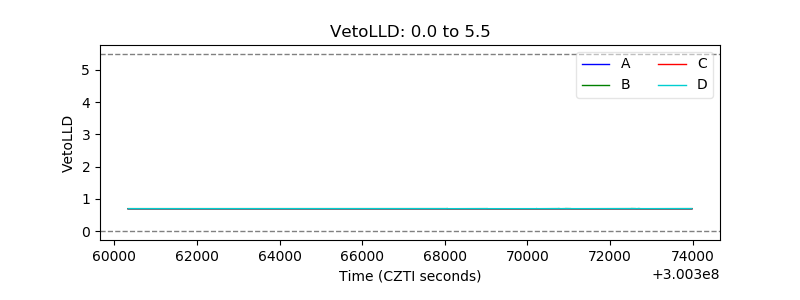 |
| Alpha Counter | 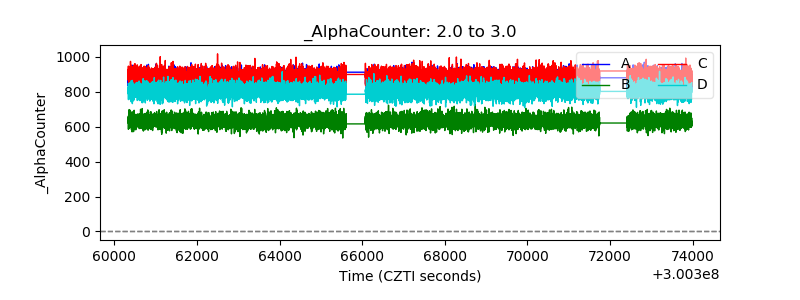 |
| _CPM_Rate | 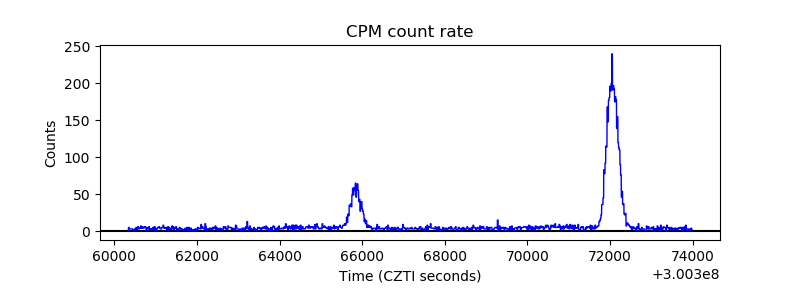 |
| CZT Counter |  |
| +2.5 Volts monitor |  |
| +5 Volts monitor |  |
| _ROLL_ROT | 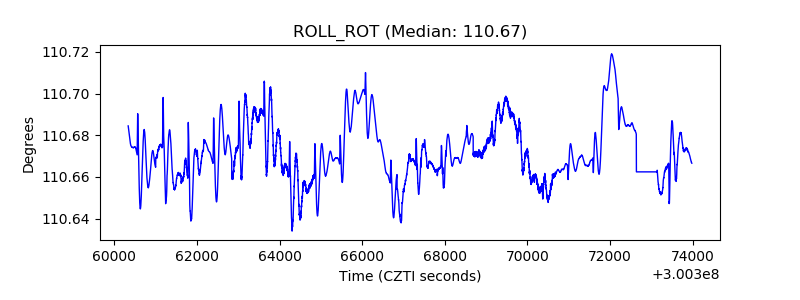 |
| _Roll_DEC | 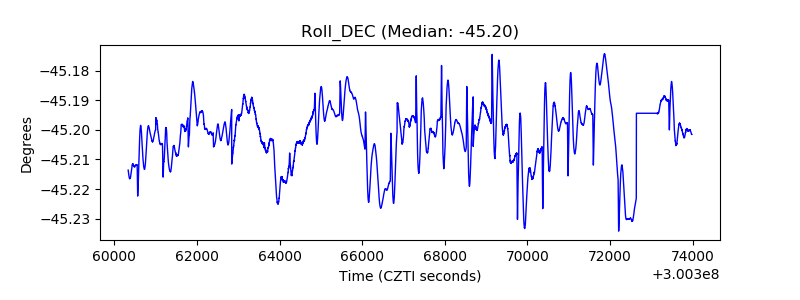 |
| _Roll_RA | 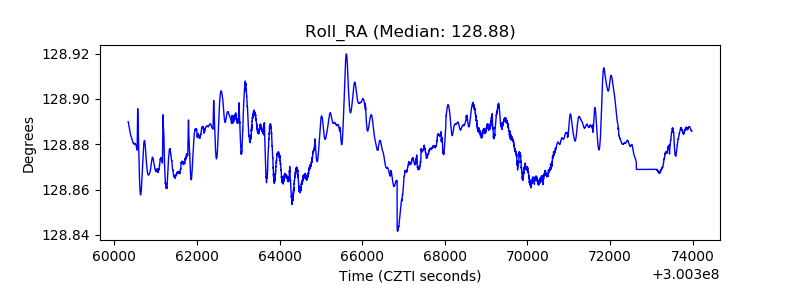 |
| Veto Counter | 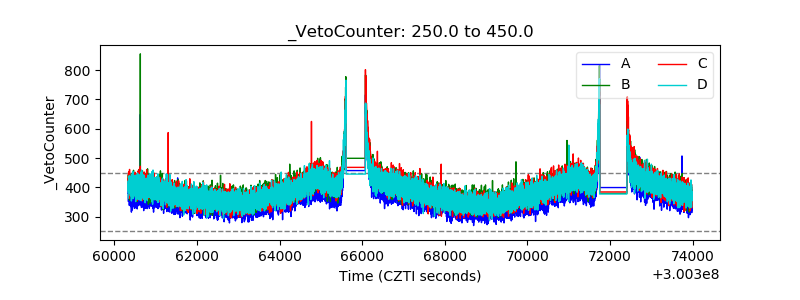 |