| Param | Original file | Final file |
|---|---|---|
| Filename | modeM0/AS1A05_188T01_9000003018_20432cztM0_level2.evt | modeM0/AS1A05_188T01_9000003018_20432cztM0_level2_quad_clean.evt |
| Size (bytes) | 461,698,560 | 90,380,160 |
| Size | 440.3 MB | 86.2 MB |
| Events in quadrant A | 3,050,248 | 587,273 |
| Events in quadrant B | 3,116,586 | 586,021 |
| Events in quadrant C | 3,038,046 | 564,053 |
| Events in quadrant D | 4,334,922 | 544,935 |
| Mode SS | |||
|---|---|---|---|
| Quadrant | BADHDUFLAG | Total packets | Discarded packets |
| A | 0 | 130 | 0 |
| B | 0 | 130 | 0 |
| C | 0 | 130 | 0 |
| D | 0 | 130 | 0 |
| Mode M9 | |||
|---|---|---|---|
| Quadrant | BADHDUFLAG | Total packets | Discarded packets |
| A | 0 | 9 | 0 |
| B | 0 | 9 | 0 |
| C | 0 | 9 | 0 |
| D | 0 | 9 | 0 |
| Mode M0 | |||
|---|---|---|---|
| Quadrant | BADHDUFLAG | Total packets | Discarded packets |
| A | 0 | 13293 | 1 |
| B | 0 | 13388 | 1 |
| C | 0 | 13317 | 1 |
| D | 0 | 17496 | 3 |
| Quadrant | Total seconds | Saturated seconds | Saturation percentage |
|---|---|---|---|
| A | 6525 | 58 | 0.888889% |
| B | 6525 | 55 | 0.842912% |
| C | 6526 | 63 | 0.965369% |
| D | 6525 | 276 | 4.229885% |
Noise dominated data is calculated using 1-second bins in cleaned event files. If a bin has >2000 counts, and if more than 50% of those come from <1% of pixels, then it is considered to be noise-dominated and hence unusable.
| Quadrant | # 1 sec bins | Bins with >0 counts | Bins with >2000 counts | High rate bins dominated by noise | Noise dominated (total time) | Noise dominated (detector-on time) | Marked lightcurve |
|---|---|---|---|---|---|---|---|
| A | 7345 | 6525 | 0 | 0 | 0.00% | 0.00% | 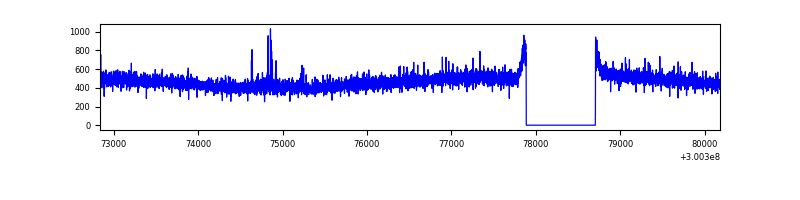 |
| B | 7345 | 6526 | 0 | 0 | 0.00% | 0.00% | 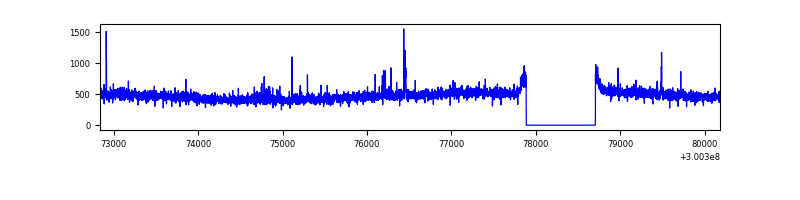 |
| C | 7346 | 6527 | 0 | 0 | 0.00% | 0.00% | 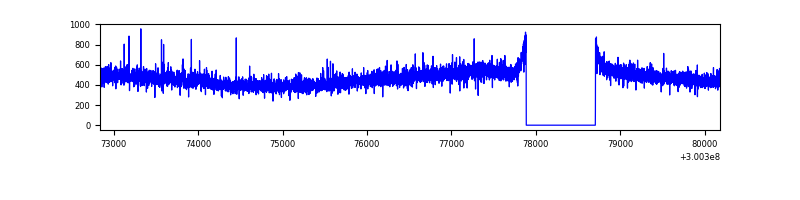 |
| D | 7345 | 6525 | 180 | 180 | 2.45% | 2.76% | 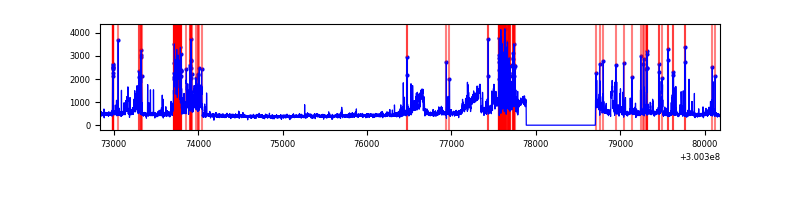 |
Top three noisy pixels from each quadrant. If the there are fewer than three noisy pixels in the level2.evt file, extra rows are filled as -1
| Pixel properties | Quadrant properties | ||||||
|---|---|---|---|---|---|---|---|
| Quadrant | DetID | PixID | Counts | Sigma | Mean | Median | Sigma |
| A | 12 | 16 | 13940 | 82.16 | 788 | 771 | 160.3 |
| A | 12 | 194 | 7636 | 42.83 | 788 | 771 | 160.3 |
| A | 0 | 226 | 6802 | 37.62 | 788 | 771 | 160.3 |
| B | 12 | 111 | 18306 | 116.65 | 776 | 755 | 150.5 |
| B | 11 | 111 | 16345 | 103.62 | 776 | 755 | 150.5 |
| B | 14 | 111 | 14445 | 90.99 | 776 | 755 | 150.5 |
| C | 14 | 238 | 117843 | 669.06 | 745 | 748 | 175.0 |
| C | 3 | 247 | 12980 | 69.89 | 745 | 748 | 175.0 |
| C | 13 | 61 | 5319 | 26.12 | 745 | 748 | 175.0 |
| D | 1 | 52 | 1033981 | 5722.08 | 749 | 728 | 180.6 |
| D | 15 | 0 | 287262 | 1586.8 | 749 | 728 | 180.6 |
| D | 13 | 153 | 158395 | 873.15 | 749 | 728 | 180.6 |
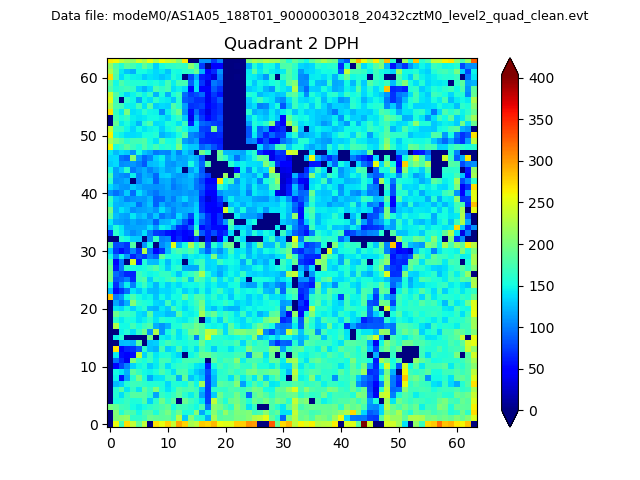
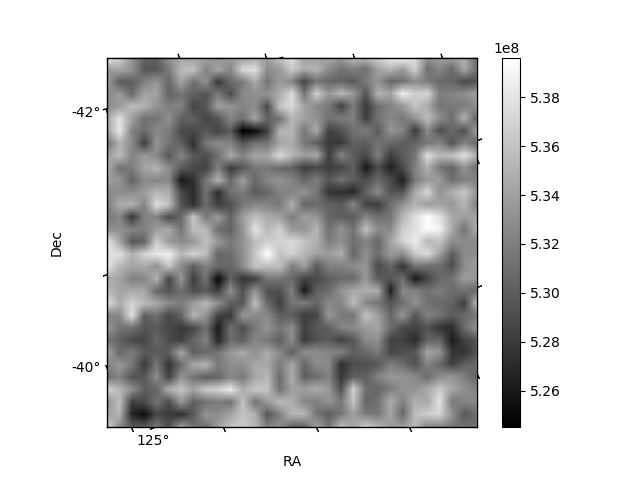
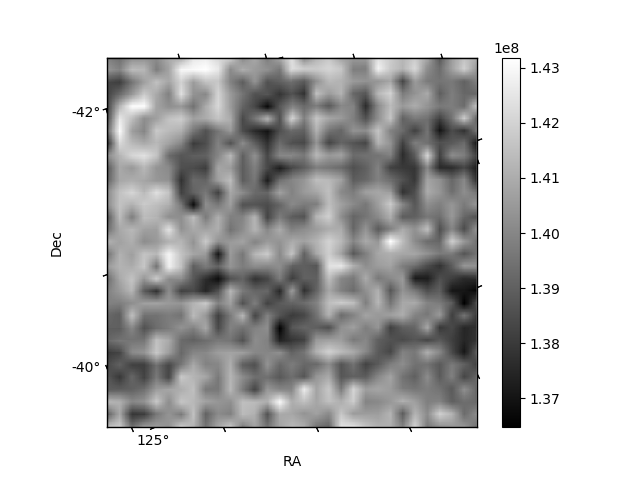
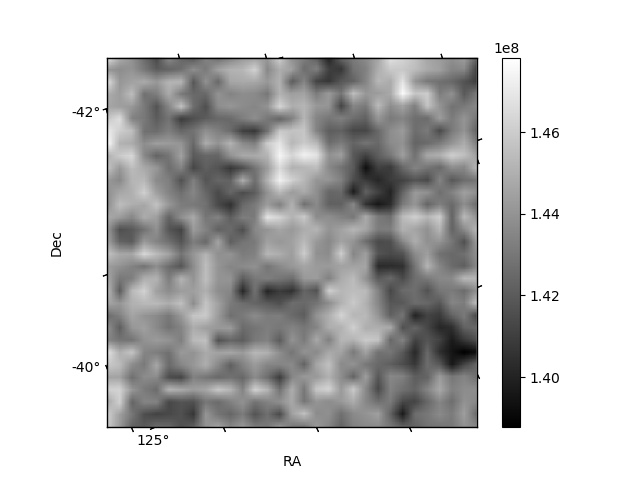
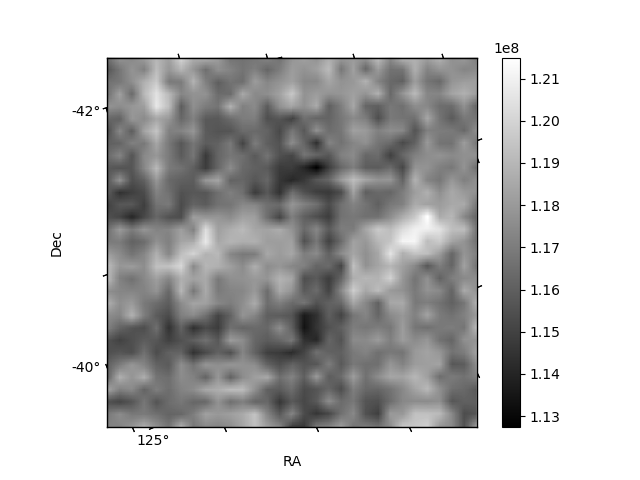
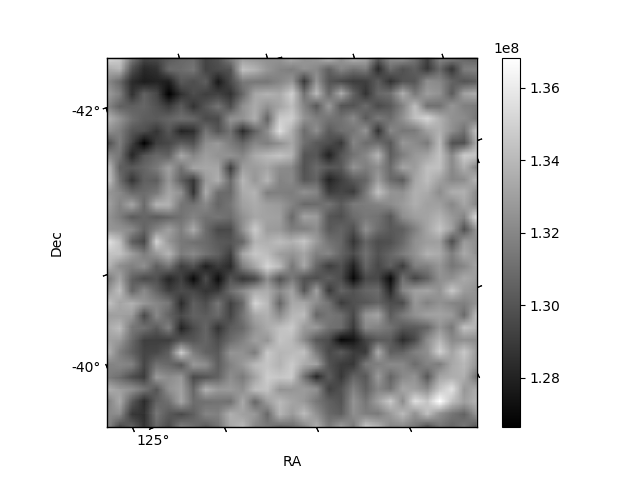
Histogram calculated using DETX and DETY for each event in the final _common_clean file
| Quadrant A | 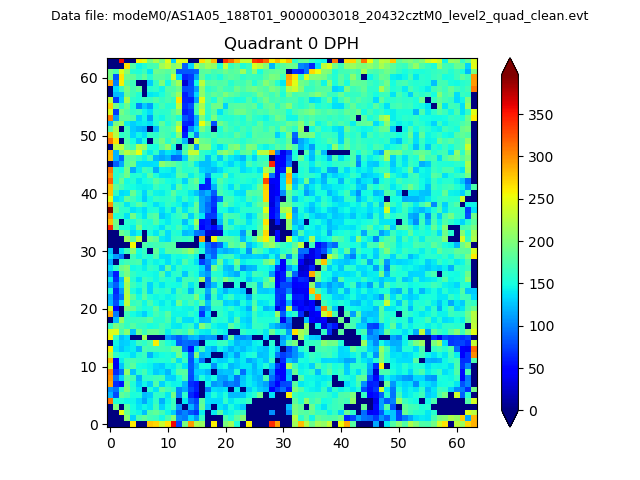 |
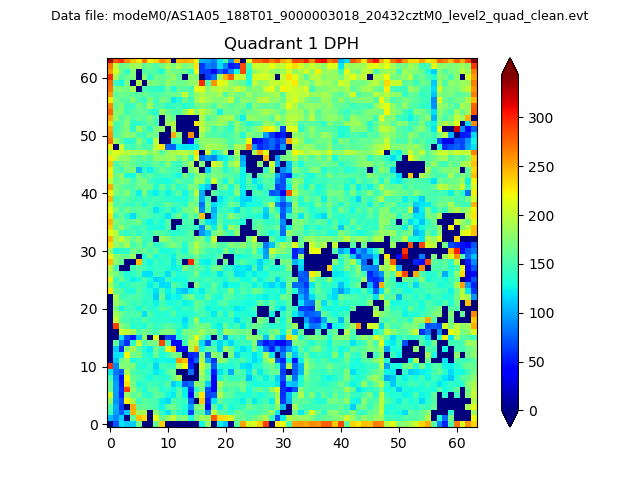 |
Quadrant B |
|---|---|---|---|
| Quadrant D | 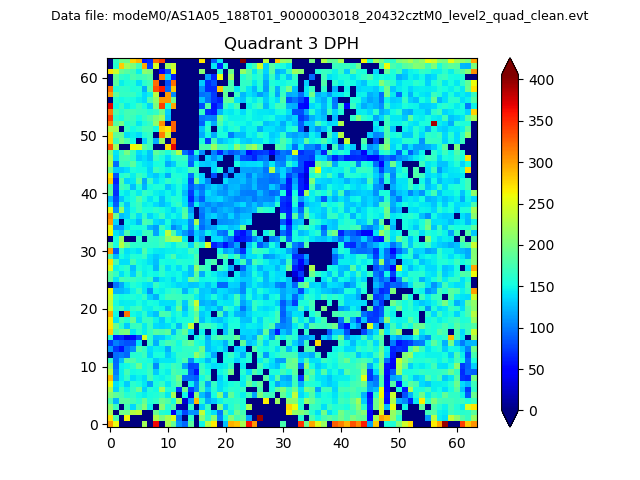 |
 |
Quadrant C |
| Plot type | Count rate plots | Images |
|---|---|---|
| Comparison with Poisson distribution Blue bars denote a histogram of data divided into 1 sec bins. Red curve is a Poisson curve with rate = median count rate of data. |
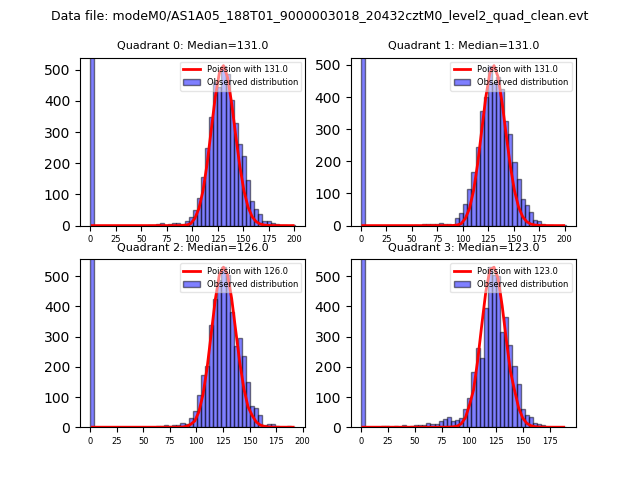 |
 |
| Quadrant-wise count rates Data is divided into 100 sec bins |
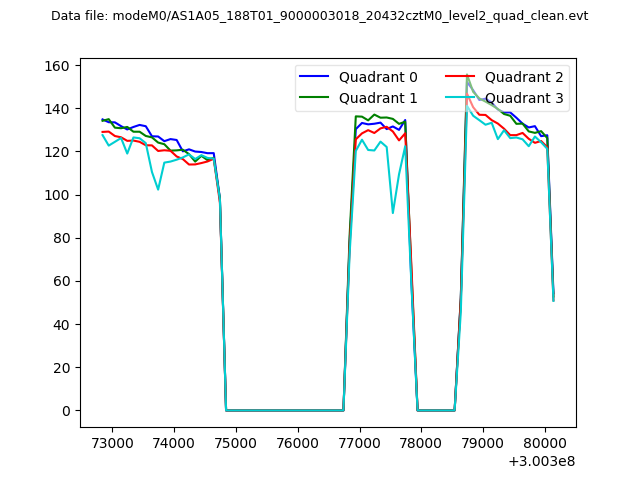 |
|
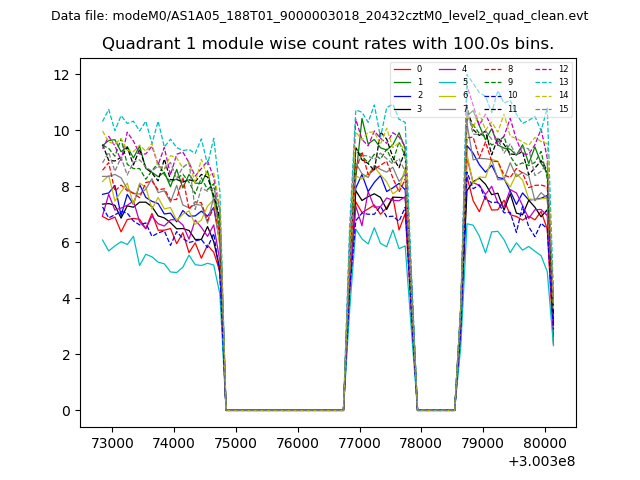
| Module-wise count rates for Quadrant A Data is divided into 100 sec bins |
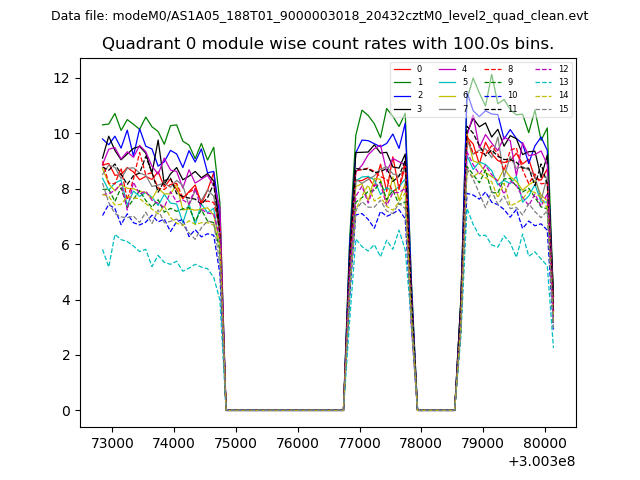 |
 |
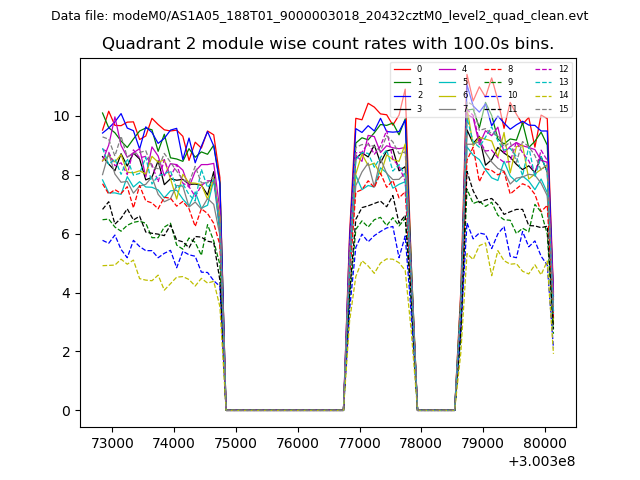
| Module-wise count rates for Quadrant B Data is divided into 100 sec bins |
 |
 |
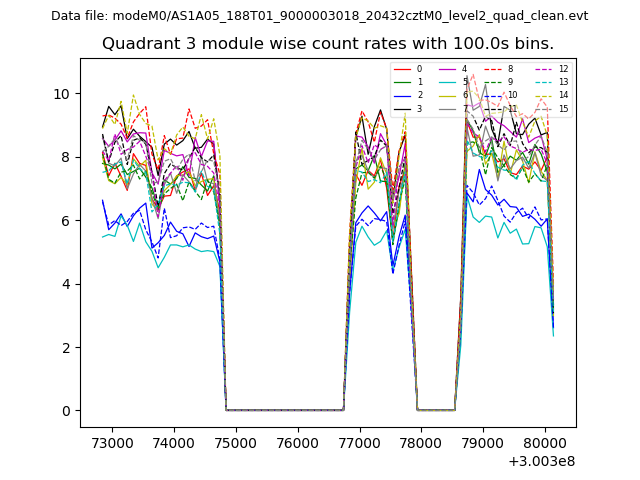
| Module-wise count rates for Quadrant C Data is divided into 100 sec bins |
 |
 |
| Module-wise count rates for Quadrant D Data is divided into 100 sec bins |
 |
 |
| Parameter | Plot |
|---|---|
| CZT HV Monitor | 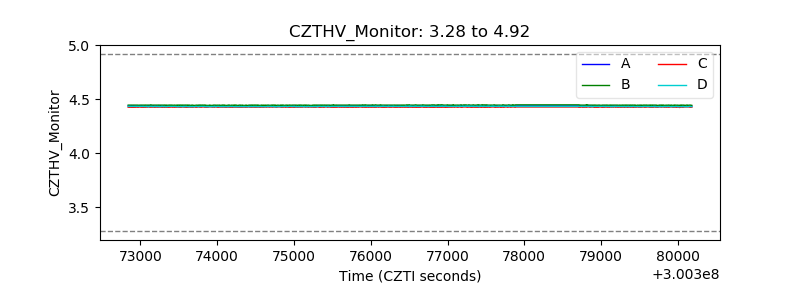 |
| D_VDD | 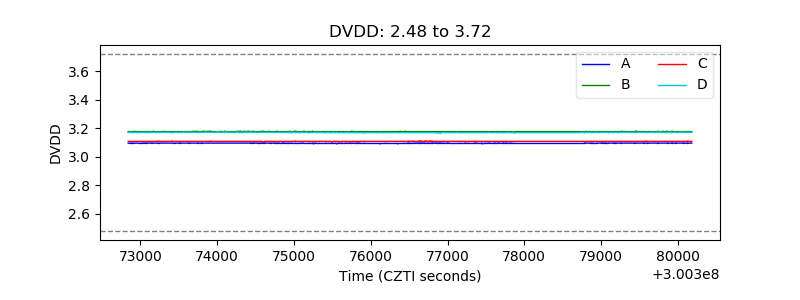 |
| Temperature 1 | 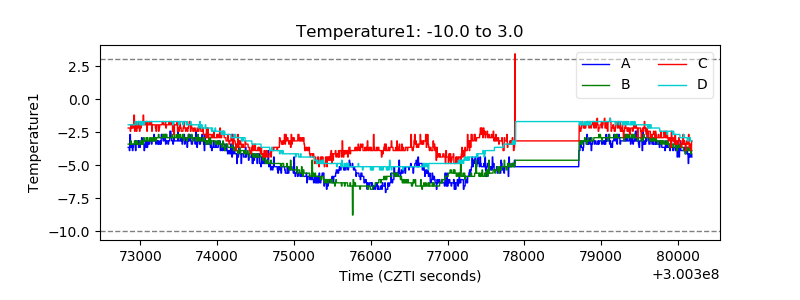 |
| Veto HV Monitor | 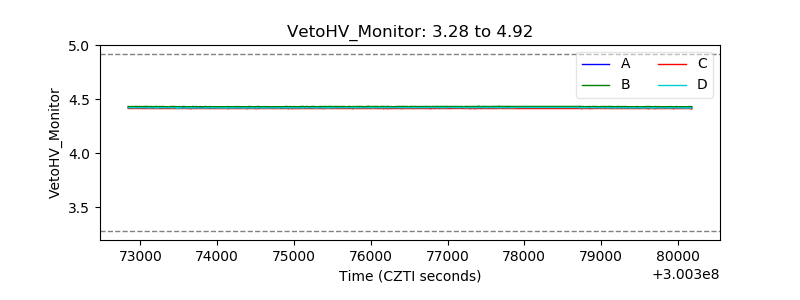 |
| Veto LLD |  |
| Alpha Counter | 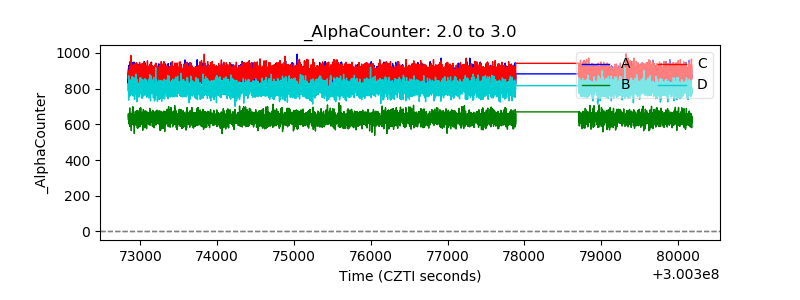 |
| _CPM_Rate | 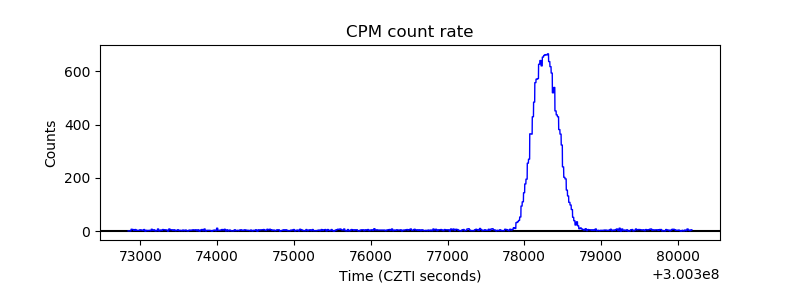 |
| CZT Counter | 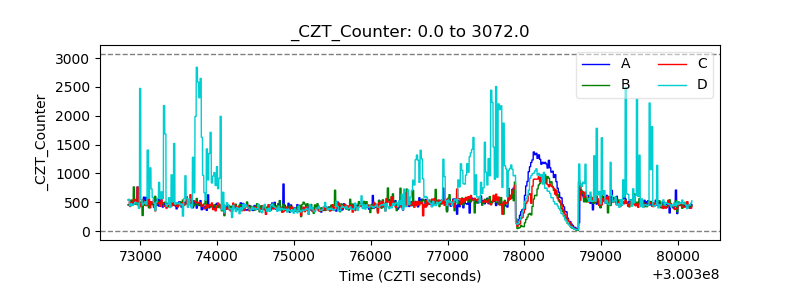 |
| +2.5 Volts monitor |  |
| +5 Volts monitor |  |
| _ROLL_ROT |  |
| _Roll_DEC | 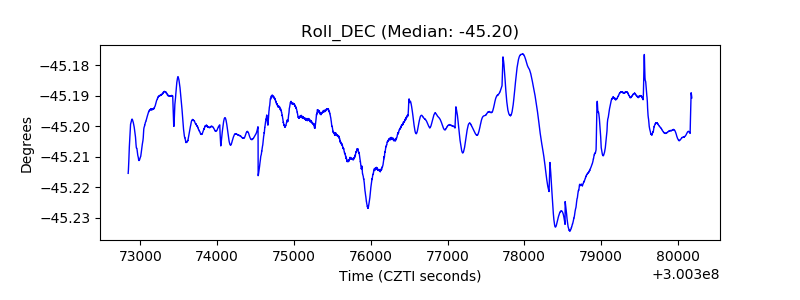 |
| _Roll_RA | 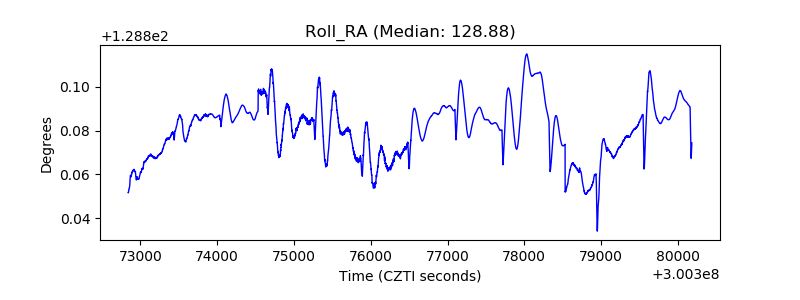 |
| Veto Counter | 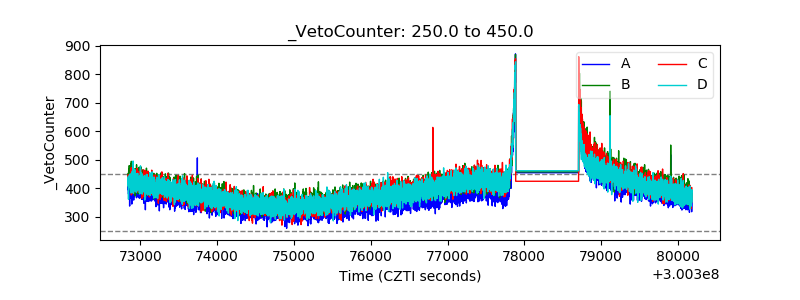 |